

Abstract
Background
A higher serum phosphate level is associated with worse outcome. Energy-demanding intracellular transport of phosphate is needed to secure anion bioavailability. In heart failure (HF), energy starvation may modify intracellular and serum levels of phosphate. We analysed determinants of serum phosphates in HF and assessed if catabolic/anabolic balance (CAB) was associated with elevation of serum phosphate.
Methods
We retrospectively reviewed data from 1029 stable patients with HF and have calculated negative (loss) and positive (gain) components of weight change from the onset of HF till index date. The algebraic sum of these components was taken as CAB. The univariate and multivariable predictors of serum phosphorus were calculated. In quintiles of CAB, we have estimated odds ratios for serum phosphorus above levels previously identified to increase risk of mortality. As a reference, we have selected a CAB quintile with similar loss and gain.
Results
Apart from sex, age, and kidney function, we identified serum sodium, N-terminal fragment of pro-brain-type natriuretic peptide, and CAB as independent predictors of serum phosphorus. The odds for serum phosphorus above thresholds found in literature to increase risk were highest in more catabolic patients. In most catabolic quintile relative to neutral balance, the odds across selected phosphorus thresholds rose, gradually peaking at 1.30 mmol/L with a value of 3.29 (95% confidence interval: 2.00–5.40, P < 0.0001) in an unadjusted analysis and 2.55 (95% confidence interval: 1.38–2.72, P = 0.002) in a fully adjusted model.
Conclusions
Metabolic status is an independent determinant of serum phosphorus in HF. Higher catabolism is associated with serum phosphorus above mortality risk-increasing thresholds.
Keywords: Serum phosphorus, Determinants, Catabolism, Anabolism, Heart failure, Chronic
Introduction
Phosphorus is the third most abundant mineral in living systems where its dominating chemical configuration in body fluids is divalent phosphate (HPO4−2). This anion is essential for intracellular signalling, cell proliferation, regulation of metabolism, and bioenergetics to name just part of its functions. Energy production in oxidative phosphorylation requires availability of phosphates within a cell.1 Intracellular phosphorus concentration is three to four times higher than that in extracellular fluids.2 Energy-consuming membrane Na+/K+/ATPase maintains electrochemical sodium gradient, which is the primary driving force for the uphill transport of phosphate by sodium-dependent phosphorus channels.3 In cellular energy-starving states such as in heart failure (HF), a reduction of transmembrane sodium gradient may impede intracellular transport of phosphorus with a consequent increase of phosphorus in serum. Also, hypoxia-induced disintegration of cells such as in tumour lysis syndrome may release intracellular content, increasing serum levels of phosphorus.4
In HF, limited oxygen delivery and energy starvation at tissue levels induce hypoxia, catabolism, progressive cell damage, and multiorgan failure.5 Weight loss after HF onset indirectly proves catabolic dominance.6 Modern treatment is associated with reduction of wasting or may even induce weight gain, indirectly documenting anabolic advantage.7,8 The net weight change after HF onset is a fingerprint of global catabolic/anabolic balance (CAB).
Higher, but still within normal boundaries, serum phosphorus is associated with increased morbidity and mortality even in subjects with normal renal function.9,10 Majority of determinants remains unknown. The impact of CAB on serum phosphorus has never been examined in HF. Our aim was to assess the association of CAB with different levels of serum phosphorus.
Materials and methods
Study group
For the purpose of the current study, we selected patients with HF and reduced left ventricle ejection fraction (LVEF) ≤40%, diagnosed according to criteria published by the European Society of Cardiology,11 with age >18 years and HF duration of more than 6 months, included into the Prospective Registry of HF undertaken in our department since 2003 and Studies Investigating Co-morbidities Aggravating HF (SICA-HF).12 Patients were recruited in an outpatient clinic between January 2004 and March 2013. We included those who reached maximal tolerated dosages of recommended drugs, in whom the onset of HF could be identified with 1 month precision and records on body weight before first diagnosis of HF and on minimal weight during HF were available. The onset of HF was defined as a month when medical records prepared by cardiologist in ambulatory settings showed coexistence of LVEF ≤ 40% with typical signs and/or symptoms of HF.
The maximal body weight was defined based on medical records of the outpatient clinic as the highest weight within a year, but not later than 2 months before diagnosed HF. The lowest weight, afterwards, was defined as minimal HF oedema-free body weight, when the attending cardiologist neither changed diuretic therapy nor recorded signs and/or symptoms of fluid retention on clinical examination.
Duration of maximal unchanged therapy had to be longer than 1 month before index date.
We excluded patients treated with glucocorticosteroids, bisphosphonates, vitamin D preparations, or calcium or phosphorus salts; those having active infection, liver disease with enzymes four times higher than normal levels, active bleeding, known neoplasm, or granulomatous disease; and patients who had undergone bariatric surgery or procedures reducing gut absorptive capacity. Out of 1168 registry or SICA-HF participants, 1029 fulfilled study criteria.
This group was used for a cross-sectional, retrospective, and single-centre study.
Medical records were reviewed, and co-morbidities such as hypertension, diabetes mellitus, and hypercholesterolaemia were recognized based on clinical history, current medication, or actual measurements of respective variables. History of smoking was defined as current or previous use of tobacco products.
Blood samples were taken in a standardized fashion in the morning (between 8 and 10 a.m., at least 8 h fasting) and after 30 min resting in a supine position in a quiet, environmentally controlled room. Blood was immediately centrifuged at 4°C and stored at −75°C for further analyses. All procedures were undertaken in accordance with the Helsinki Declaration, and protocol was reviewed and accepted by the Ethics Committee of Silesian Medical University. All patients have expressed their informed, written consent. Study procedures are shown in Figure 1.
Figure 1.
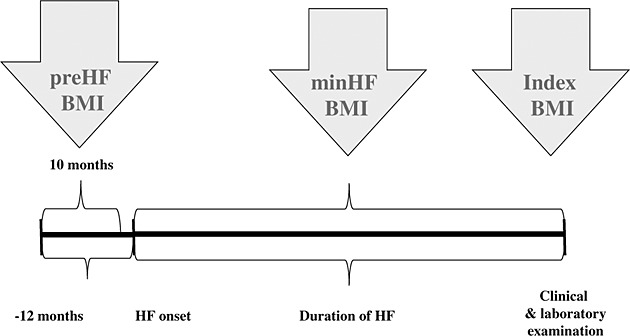
Chronology of study measurements and examinations. HF, heart failure; BMI, body mass index.
Body mass and height were measured at a day of blood sampling (index date) using a certified scale (B150L, Redwag, Zawiercie, Poland). By dividing weights in kilograms and by height in metres squared, we have calculated body mass indexes (BMI) for maximal, minimal, and index weight as pre-HF BMI, min HF BMI, and index BMI, respectively. We have calculated weight loss and weight gain using the following formulations:
We used a Sonos-5000 Hewlett-Packard Ultrasound Scanner (Hewlett-Packard, Andover, MA, USA) to measure LVEF from the apical four-chamber view and calculated it with the following formula:
Bone mineral density was measured using dual X-ray absorptiometry with a pencil beam Lunar DRX-L device (General Electric, Brussels, Belgium).
Commercially available reagents (Roche Diagnostics, Switzerland) allowed measurements of serum creatinine, albumin, alkaline phosphatase, N-terminal fragment of pro-brain-type natriuretic peptide (NTproBNP), high-sensitivity C-reactive protein, phosphorus, and calcium. We have calculated the glomerular filtration rate (GFR) using the known Modification of Diet in Renal Disease (MDRD) formulation:
In case of serum albumin <40 g/L, we have corrected calcium using the following formulation:
Catabolic/anabolic balance was calculated as an algebraic sum of negative weight change (loss) after HF onset and positive weight change (gain) occurring afterwards. In patients who never lost any weight, a null value for the catabolic phase was applied. Similarly, a null value for weight gain was taken as representation for the anabolic phase in patients who never displayed any weight gain. Values of CAB were split into quintiles, and for further calculations, Quintile 4 in which CAB was close to zero was taken as a reference.
Based on published data showing increased risk of all-cause mortality,9,10,13–19 we have selected four serum phosphorus levels: 1.15, 1.20, 1.25, and 1.30 mmol/L. For each quintile of CAB, we have calculated raw and adjusted odds of serum phosphorus level above selected thresholds.
Statistics
Continuous variables were presented as mean values and standard deviations, and categorical variables as percentages. For parameters with a skewed distribution, median value and interquartile range were given. In order to assure normal distribution for highly skewed variables [NTproBNP and high-sensitivity C-reactive protein estimated glomerular filtration rate using MDRD formulation (eGFRMDRD)], log10-transformed values were used (in tables shown before transformation). Comparison between groups was carried out using Kruskal–Wallis or χ2 test where appropriate. Logistic regression analysis was utilized to assess the risk of serum phosphorus level above selected thresholds and to adjust for potential confounders. Significance level was set at 0.05 (two tailed), and all calculations were performed using software packages of ‘Statistica’ v.10.0 and NCSS v2007.
Results
The clinical characteristics of patients are shown in Table 1.
Table 1.
Clinical and laboratory characteristics of study participants and comparison between quintiles of catabolic/anabolic balance
| Quintiles of catabolic/anabolic balance from the onset of heart failure (HF) till index date (weight change till index date) | |||||||
|---|---|---|---|---|---|---|---|
| Feature | Catabolic predominance (C > A) | Neutral balance C = A (reference) | Anabolic predominance C < A | P-value | |||
| Q1 | Q2 | Q3 | Q4 | Q5 | |||
| All | n = 206 | n = 205 | n = 206 | n = 207 | n = 205 | ||
| Demography and clinical characteristics | |||||||
| Women (%) | 13.7 | 14.0 | 13.2 | 8.7 | 12.1 | 20.5 | 0.01 |
| Age (years) | 53 ± 10 | 52.8 ± 11 | 53.0 ± 11 | 51.7 ± 11 | 54.3 ± 10 | 52.2 ± 9 | 0.29 |
| Pre-HF BMI (kg/m2) | 28.3 ± 5 | 30.6 ± 5 | 28.7 ± 5 | 28.2 ± 4 | 27.7 ± 4 | 26.3 ± 5 | <0.0001 |
| Min HF BMI (kg/m2) | 24.8 ± 4 | 23.5 ± 4 | 24.4 ± 4 | 25.4 ± 4 | 25.4 ± 4 | 25. 2 ± 4 | 0.0003 |
| Index BMI (kg/m2) | 26.4 ± 4 | 24.2 ± 4 | 25.2 ± 4 | 26.4 ± 4 | 27.2 ± 4 | 29.2 ± 4 | <0.0001 |
| Aetiology of HF (% ischemic) | 63.0 | 55.8 | 66.3 | 61.2 | 70.5 | 60.5 | <0.0001 |
| Duration of HF (months) | 35 (56) | 41 (63) | 26 (41) | 33 (55) | 33 (47) | 49 (65) | 0.0001 |
| Mean blood pressure (mmHg) | 83 ± 11 | 79 ± 10 | 81 ± 10 | 84 ± 11 | 84 ± 11 | 85 ± 12 | <0.0001 |
| Heart rate (beats per minute) | 82 ± 15 | 81 ± 15 | 81 ± 14 | 83 ± 16 | 81 ± 14 | 82 ± 15 | 0.58 |
| NYHA class I (%) | 6.3 | 2.4 | 3.4 | 6.8 | 10.6 | 8.3 | 0.001 |
| NYHA class II (%) | 36.5 | 23.3 | 33.7 | 45.1 | 43.0 | 37.6 | <0.0001 |
| NYHA class III (%) | 47.7 | 52.4 | 53.7 | 42.2 | 39.6 | 50.7 | <0.0001 |
| NYHA class IV (%) | 9.5 | 21.8 | 9.3 | 5.8 | 6.8 | 3.4 | <0.0001 |
| CAB = weight change from pre-HF BMI till index BMI as per cent of pre-HF BMI (%) | −6.7 (13.3) | −19.1 (6.0) | −11.8 (2.8) | −6.3 (2.8) | −1.2 (3.0) | 9.2 (10.5) | <0.0001 |
| Weight loss from HF onset to min HF BMI relative to pre-HF weight (negative value) (%) | −11.0 (12.7) | −20.5 (8.9) | −13.3 (5.4) | −8.7 (5.9) | −6.3 (8.6) | 0.0 (4.4) | <0.0001 |
| Weight gain from min HF BMI till index date relative to min HF weight (positive value) (%) | 3.6 (8.7) | 0.0 (3.3) | 1.1 (4.0) | 2.2 (6.1) | 5.1 (7.5) | 13.5 (10.6) | <0.0001 |
| Total bone mineral density (g/cm2) | 1.19 ± 0.1 | 1.19 ± 0.1 | 1.19 ± 0.1 | 1.20 ± 0.1 | 1.18 ± 0.1 | 1.19 ± 0.1 | 0.63 |
| LVEF (%) | 25 ± 8 | 23 ± 9 | 24 ± 7 | 25 ± 8 | 27 ± 9 | 27 ± 8 | <0.0001 |
| Laboratory findings | |||||||
| eGFRMDRD (mL/min × 1.73 m2) | 85 (38) | 78 (38) | 83 (34) | 89 (35) | 87 (37) | 86 (44) | 0.14 |
| Albumin (g/L) | 42 ± 4 | 41 ± 5 | 41 ± 4 | 42 ± 4 | 42 ± 4 | 43 ± 4 | 0.15 |
| Alkaline phosphatase (iu) | 80 ± 45 | 95 ± 43 | 84 ± 45 | 83 ± 61 | 68 ± 26 | 72 ± 38 | <0.0001 |
| Sodium (mmol/L) | 135.9 ± 3.8 | 134.9 ± 4.3 | 135.6 ± 3.7 | 136.3 ± 3.8 | 136.5 ± 3.4 | 136.4 ± 3.5 | <0.0001 |
| NTproBNP (pg/mL) | 1393 (2538) | 2632 (3830) | 1671 (2820) | 1303 (1988) | 1051 (1808) | 872 (1657) | <0.0001 |
| hsCRP (mg/L) | 2.9 (1.3; 6.9) | 4.1 (7.8) | 2.8 (6.4) | 2.4 (4.4) | 2.5 (4.0) | 2.8 (5.3) | 0.003 |
| Phosphorus (mmol/L) | 1.13 ± 0.2 | 1.21 ± 0.27 | 1.13 ± 0.2 | 1.13 ± 0.2 | 1.08 ± 0.2 | 1.09 ± 0.2 | <0.0001 |
| >1.15 mmol/L (%) | 43.1 | 35.9 | 35.6 | 43.7 | 35.3 | 36.1 | <0.0001 |
| >1.20 mmol/L (%) | 33.7 | 48.5 | 34.1 | 33.5 | 24.6 | 27.8 | <0.0001 |
| >1.25 mmol/L (%) | 26.6 | 39.8 | 25.9 | 27.7 | 17.4 | 22.4 | <0.0001 |
| >1.30 mmol/L (%) | 20.0 | 33.0 | 18.5 | 18.9 | 13.0 | 16.6 | <0.0001 |
| Corrected calcium (mmol/L) | 2.31 ± 0.2 | 2.35 ± 0.2 | 2.33 ± 0.2 | 2.31 ± 0.2 | 2.30 ± 0.2 | 2.27 ± 0.2 | 0.0005 |
| Comorbidities (%) | |||||||
| Hypertension | 55.2 | 53.9 | 52.7 | 52.4 | 59.9 | 57.0 | 0.48 |
| Diabetes mellitus type 2 | 30.7 | 37.9 | 36.1 | 25.7 | 27.1 | 26.8 | 0.01 |
| Hypercholesterolemia | 60.6 | 57.3 | 61.0 | 56.3 | 64.3 | 64.4 | 0.29 |
| History of smoking | 72.1 | 71.8 | 68.8 | 75.2 | 71.0 | 73.7 | 0.002 |
| Pharmacotherapy (per cent of treated patients) | |||||||
| ACI/ARB& | 93/60 ± 51 | 89/49 ± 49 | 92/55 ± 41 | 93/60 ± 40 | 95/61 ± 50 | 97/72 ± 55 | 0.02/0.04 |
| Beta-blockers& | 98/49 ± 30 | 98/48 ± 33 | 97/47 ± 27 | 95/48 ± 32 | 99/45 ± 25 | 99/55 ± 33 | 0.06/0.36 |
| Aldosterone antagonists& | 92/119 ± 65 | 97/131 ± 69 | 94/126 ± 61 | 92/115 ± 59 | 88/110 ± 64 | 90/114 ± 71 | 0.02/0.01 |
| Loop diuretics | 87 | 95 | 92 | 87 | 81 | 82 | <0.0001 |
| Thiazides | 15 | 20 | 15 | 12 | 12 | 18 | 0.04 |
Data are expressed as mean values ± standard deviation, as medians and interquartile range or as percentages.
A, anabolism; ACEI/ARB, angiotensin converting enzyme inhibitor/angiotensin II receptor blocker; C, catabolism; CAB, catabolic/anabolic balance; eGFRMDRD, estimated glomerular filtration rate using MDRD formulation; hsCRP, high-sensitivity C-reactive protein; index BMI, body mass index at inclusion to the study; LVEF, left ventricle ejection fraction; Min HF BMI, minimal body mass index between the onset of heart failure and index date; NTproBNP, N-terminal fragment of pro-brain-type natriuretic peptide; NYHA, New York Heart Association class; Pre-HF BMI, maximal body mass index within a year before diagnosis of heart failure.
&Per cent of treated patients/mean percentage of recommended dose ± standard deviation.
The catabolic and anabolic components of weight change from the HF onset till index date for consecutive quintiles of CAB were shown in Figure 2.
Figure 2.
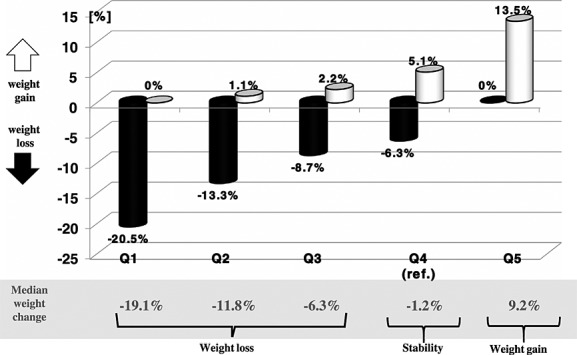
Catabolic and anabolic components of weight change from heart failure onset till index date in consecutive quintiles of catabolic/anabolic balance.
Univariate and multivariable predictors of serum phosphorus
On univariate analysis, serum phosphorus was positively associated with sex (female): r = 0.137 (P < 0.0001), New York Heart Association class: r = 0.224 (P < 0.0001), alkaline phosphatase: r = 0.168 (P < 0.0001), high-sensitivity C-reactive protein: r = 0.08 (P = 0.009), NTproBNP: r = 0.258 (P < 0.0001), loop diuretics treatment: r = 0.147 (P < 0.0001), and percentage of recommended dosage of aldosterone blockers: r = 0.111 (P < 0.0001). Negative correlations were found between serum phosphorus and age: r = −0.128 (P < 0.0001), min HF BMI: r = −0.09 (P = 0.005), index BMI: r = −0.128 (P < 0.0001), mean blood pressure: r = −0.246 (P < 0.0001), CAB: r = −0.1530 (P < 0.0001) (Figure 3), serum sodium: r = −0.266 (P < 0.001), GFRMDRD: r = −0.163 (P < 0.0001), LVEF: r = −0.174 (P < 0.0001), and percentage of recommended dosage of angiotensin-converting enzyme inhibitor or angiotensin II receptor blocker: r = −0.113 (P = 0.0005).
Figure 3.
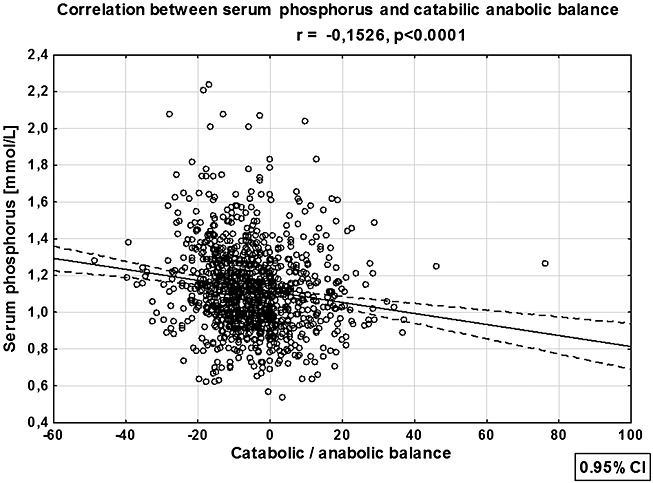
Linear correlation of serum phosphorus with catabolic/anabolic balance. CI, confidence interval.
In a multivariable model, only age, sex, GFRMDRD, serum sodium, NTproBNP, and CAB remained significantly and independently associated with serum phosphorus. These variables explained 18.3% of serum phosphorus variation (Table 2).
Table 2.
Multivariable predictors of serum phosphorus
| Determinants of serum phosphorus | ||||||
|---|---|---|---|---|---|---|
| R2 model = 0.183 | Regression coefficient | Standard error | −95% CI | +95% CI | Standardized beta | P-value |
| Intercept | 3.0280 | 0.3193 | 2.4020 | 3.6539 | 0.0000 | <0.0001 |
| Sex (female) | 0.1234 | 0.0252 | 0.0740 | 0.1728 | 0.1775 | <0.0001 |
| Age (years) | −0.0032 | 0.0008 | −0.0049 | −0.0016 | −0.1440 | 0.0002 |
| eGFRMDRD (mL/min × 1.73 m2) | −0.0016 | 0.0003 | −0.0022 | −0.0010 | −0.2043 | <0.0001 |
| NTproBNP (pg/mL) | 0.000012 | 0.000002 | 0.000007 | 0.000016 | 0.1666 | <0.0001 |
| Sodium (mmol/L) | −0.0122 | 0.0024 | −0.0168 | −0.0076 | −0.1887 | <0.0001 |
| CAB (%) | −0.0025 | 0.0007 | −0.0040 | −0.0011 | −0.1245 | 0.0005 |
CAB, catabolic/anabolic balance; eGFRMDRD, estimated glomerular filtration rate using MDRD formulation; NTproBNP, N-terminal fragment of pro-brain-type natriuretic peptide; CI, confidence interval.
The catabolic/anabolic balance and the risk of higher serum phosphorus
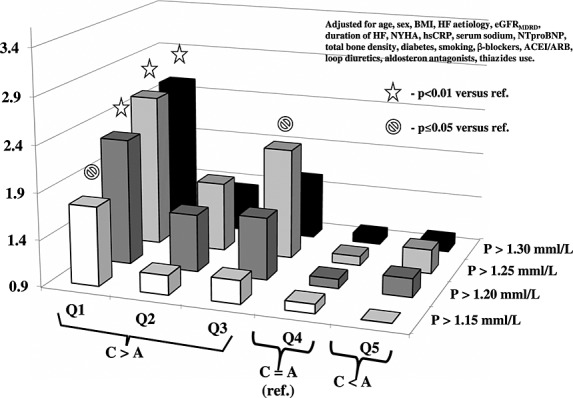
In comparison with neutral CAB represented by Quintile 4, for most catabolic profile in Quintile 1, the risk of serum phosphorus above all selected thresholds was the highest. In none of the selected thresholds, the odds for higher phosphorus were substantially modified by adjustment for age, sex, index BMI, HF aetiology, and GFRMDRD, and the risk remained highly significant for Quintile 1 (Table 3, Figure 3). Even after most robust adjustment including the New York Heart Association class, NTproBNP, and serum sodium, the risk of phosphorus above all thresholds in most catabolic Quintile 1 of CAB was still highly significant. The risk for phosphorus >1.25 and >1.20 mmol/L was also significantly higher in less catabolic Quintiles 3 and 2 in comparison with Quintile 4 (Table 3, Figure 4). The significance was lost after full adjustment in case of threshold >1.20 mmol/L and remained significant for CAB Quintile 3 in case of phosphorus >1.25 mmol/L (Table 3, Figure 5).
The unadjusted and multivariable adjusted odds for serum phosphorus above selected thresholds in quintiles of catabolic/anabolic balance
| Catabolic predominance (C > A) | Neutral balance C = A (reference) | Anabolic predominance (C < A) | |||
|---|---|---|---|---|---|
| Q1 | Q2 | Q3 | Q4 | Q5 | |
| Odds ± 95% confidence intervals for serum phosphorus > 1.15 mmol/L | |||||
| Unadjusted analysis | 2.46 (1.66–3.66) P < 0.0001 | 1.38 (0.93–2.05) P = 0.11 | 1.42 (0.96–2.12) P = 0.08 | 1.0 | 1.03 (0.69–1.55) P = 0.86 |
| R2 = 1.0% | |||||
| Model 1* | 2.14 (1.4–3.27) P = 0.0004 | 1.31 (0.87–1.99) P = 0.2 | 1.4 (0.93–2.12) P = 0.11 | 1.0 | 0.95 (0.62–1.46) P = 0.83 |
| R2 = 7.0% | |||||
| Model 2** | 1.75 (1.05–2.91) P = 0.03 | 1.11 (0.68–1.81) P = 0.68 | 1.15 (0.71–1.87) P = 0.58 | 1.0 | 0.83 (0.49–1.42) P = 0.57 |
| R2 = 12.0% | |||||
| Odds ± 95% confidence intervals for serum phosphorus > 1.20 mmol/L | |||||
| Unadjusted analysis | 2.89 (1.90–4.38) P < 0.0001 | 1.59 (1.03–2.43) P = 0.03 | 1.54 (1.00–2.36) P = 0.048 | 1.0 | 1.18 (0.76–1.83) P = 0.47 |
| R2 = 1.0% | |||||
| Model 1* | 2.63 (1.69–4.11) P < 0.0001 | 1.56 (1.00–2.44) P = 0.05 | 1.54 (0.99–2.41) P = 0.054 | 1.0 | 1.09 (0.68–1.73) P = 0.73 |
| R2 = 7.6% | |||||
| Model 2** | 2.26 (1.32–3.86) P = 0.003 | 1.52 (0.89–3.86) P = 0.12 | 1.57 (0.92–2.67) P = 0.09 | 1.0 | 1.10 (0.61–1.97) P = 0.74 |
| R2 = 14.5% | |||||
| Odds ± 95% confidence intervals for serum phosphorus > 1.25 mmol/L | |||||
| Unadjusted analysis | 3.14 (1.99–4.95) P < 0.0001 | 1.66 (1.03–2.67) P = 0.04 | 1.82 (1.13–2.91) P = 0.01 | 1.0 | 1.37 (0.84–2.24) P = 0.20 |
| R2 = 1.0% | |||||
| Model 1* | 2.92 (1.81–4.71) P < 0.001 | 1.65 (1.01–2.7) P = 0.05 | 1.85 (1.14–3.00) P = 0.01 | 1.0 | 1.25 (0.75–2.08) P = 0.39 |
| R2 = 6.6% | |||||
| Model 2** | 2.55 (1.43–4.52) P = 0.001 | 1.65 (0.92–2.96) P = 0.09 | 2.10 (1.18–3.74) P = 0.01 | 1.0 | 1.16 (0.61–2.19) P = 0.65 |
| R2 = 13.8% | |||||
| Odds ± 95% confidence intervals for serum phosphorus > 1.30 mmol/L | |||||
| Unadjusted analysis | 3.29 (2.00–5.40) P < 0.0001 | 1.52 (0.89–2.59) P = 0.13 | 1.56 (0.91–2.66) P = 0.10 | 1.0 | 1.33 (0.77–2.39) P = 0.31 |
| R2 = 1.0% | |||||
| Model 1* | 3.11 (1.86–5.28) P < 0.0001 | 1.54 (0.88–2.68) P = 0.13 | 1.57 (0.90–2.73) P = 0.11 | 1.0 | 1.17 (0.66–2.08) P = 0.59 |
| R2 = 8.3% | |||||
| Model 2** | 2.55 (1.38–2.72) P = 0.002 | 1.35 (0.71–2.56) P = 0.36 | 1.55 (0.83–2.93) P = 0.17 | 1.0 | 1.02 (0.50–2.04) P = 0.97 |
| R2 = 16.1% | |||||
A, Anabolism; ACEI/ARB, angiotensin converting enzyme inhibitor/angiotensin II receptor blocker; C, catabolism; eGFRMDRD, estimated glomerular filtration rate using MDRD formulation; hsCRP, high-sensitivity C-reactive protein; LVEF, left ventricle ejection fraction; NTproBNP, N-terminal fragment of pro-brain-type natriuretic peptide; NYHA, New York Heart Association class.
Model 1: adjusted for age, sex, index BMI, heart failure aetiology and eGFRMDRD.
Model 2: adjusted for age, sex, index BMI, heart failure aetiology, duration of heart failure, NYHA class, alkaline phosphatase, hsCRP, serum sodium, NTproBNP, total bone density, eGFRMDRD, LVEF, diabetes, history of smoking, beta-blockers, ACEI/ARB, aldosterone antagonists, loop diuretics, and thiazides use.
Figure 4.
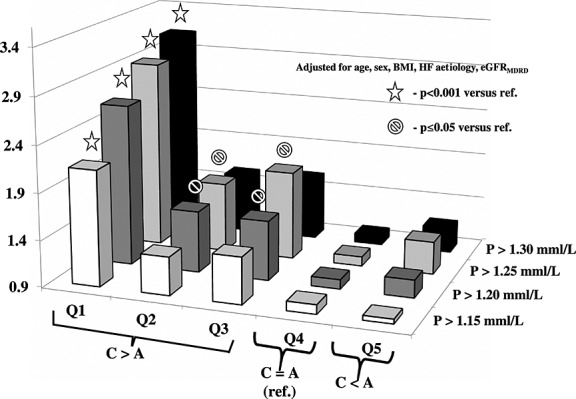
Odds for serum phosphorus above selected thresholds for quintiles of catabolic/anabolic balance after adjustment for age, sex, heart failure (HF) aetiology and glomerular filtration rate (GFR)MDRD. BMI, body mass index.
Figure 5.
Odds for serum phosphorus above selected thresholds for quintiles of catabolic/anabolic balance after full adjustment. BMI, body mass index; HF, heart failure; GFR, glomerular filtration rate; NYHA, New York Heart Association; hsCRP, high-sensitivity C-reactive protein; NTproBNP, N-terminal fragment of pro-brain-type natriuretic peptide; ACEI, angiotensin converting enzyme inhibitor; ARB, angiotensin II receptor blocker.
In an unadjusted model and after correction for age, sex, index BMI, HF aetiology, and eGFRMDRD, there was significant gradual risk increase from lowest to highest selected phosphorus thresholds (P = 0.026 and P = 0.022, respectively). In fully adjusted model 2, this increase was no longer significant (P = 0.08).
In anabolic CAB Quintile 5, the risk of phosphorus above none of the selected thresholds was different as compared with neutral CAB in Quintile 4.
Discussion
Our study is the first to demonstrate the independent association of higher serum phosphorus with higher catabolic rate in patients with HF. In various populations free of kidney impairment, higher mortality was associated with serum phosphorus values between 1.15 and 1.30 mmol/L or higher.9,10,13–19 In models adjusted for potential confounders including kidney function, we consistently found serum phosphorus levels exceeding all predefined thresholds only in patients with weight loss but no detectable weight gain during HF.
Beyond kidney function, determinants of serum phosphorus are weakly understood. In general population, only 12% of serum phosphorus variation can be explained by nutritional, demographic, and cardiovascular risk factors profile and kidney function variables.20 To the best of our knowledge, no studies so far assessed serum phosphorus determinants in HF. Our data confirmed association of serum phosphorus with age, gender, and kidney function but not with body mass. Instead, we found independent correlation of serum phosphorus with CAB, serum NTproBNP, and sodium. Variables included into our model explained 18% of total serum phosphorus variability.
Reasons for higher serum phosphorus in more catabolic patients are not clear. Here, we point out several potential mechanisms to be explored in dedicated studies.
Impaired kidney function is recognized frequently in more haemodynamically compromised patients. Low GFR may be responsible for phosphorus retention. This was not the case in our study, because even in the most catabolic patients, the mean estimated GFR = 78 mL/min/1.73 m2 was far above the threshold below which phosphorus retention is usually detected.21
Bone loss is a part of general body wasting in HF.22 Liberation of phosphorus from skeleton might have elevated its serum level. However, as opposed to patients with normal bone mineral content, higher serum phosphorus has never been shown in HF patients with reduced bone mineral density. In our study, we have not found differences in bone mineral densities between groups with various phosphorus levels. This effect is likely due to the phosphaturic action of parathyroid hormone excess frequently found in HF.23
It is commonly accepted that reduced tissue perfusion with excessive neuroendocrine activation, oxidative stress, inflammation, and multiple anabolic deficits are all responsible for cellular energy starvation, catabolism in HF, progressive tissue damage, and death.24 The intracellular transport of phosphorus is coupled to energy-consuming sodium pumping in the opposite direction, and this gives a primary force to intracellular transport of phosphorus.3 Both sodium and phosphorus use common sodium/phosphate type III channels known as PIT-1 and PIT-2.25 As a result of active transportation to all metabolizing cells, the intracellular phosphorus content is far higher than that outside. Tissue hypoxia and energy starvation might have resulted in the slowing of intracellular pumping of phosphorus, leaving part of the mineral outside. For example, hypobaric hypoxia is associated with reduction of phosphorus content within the brain.26 Shortage of bioavailable phosphorus within a cell may have impeded ATP production as was recently shown in case of chondrocytes and may have closed circulus vitiosus of detrimental events.27 Furthermore, in more profound hypoxia or because of toxic drug effect, cell disintegration with release of intracellular content into the blood may occur. This effect is observed in tumour lysis syndrome where hyperphosphatemia associated with hyperuricaemia and inflammation is a typical laboratory finding.4 It is not known if mild forms of this syndrome may occur in HF, although similarities of biochemical profiles between tumour lysis and acute HF are striking.
In mammalian cells, part of phosphorus is stored as linear polymers of several to hundreds of phosphate units known as polyphosphates.28 The synthesis of these molecules was shown to be energy dependent and linked to membrane transport and cell integrity.29 Reduction of energy provision may have limited the synthesis of these molecules, thus leaving more unpolymerized phosphorus in the blood.
Hyponatraemia is frequently present in more advanced stages of HF. Recently, hyponatraemia was found to be associated with hypoparathyroidism.30 Relative insufficiency of parathyroid function may be responsible for reduced phosphaturia and phosphorus retention. In our cohort, we noticed negative correlation between serum sodium and phosphorus. Additionally, sodium concentration was an independent predictor of serum phosphorus.
The absence of anabolic component of weight change in patients in whom we observed higher serum phosphorus speaks in favour of cellular energy starvation state as a potential common denominator.
Regardless of the mechanism(s) responsible for elevation of phosphorus in more catabolic states of HF, its presence in circulation may have significant consequences. Animal and human studies show causative involvement of excessive serum phosphates in endothelial dysfunction,31 smooth muscle cell apoptosis,32 and vascular calcifications,33 and all of these are implicated in vascular remodelling, arterial stiffness, and clinical events. Independent of toxic effects of excessive serum phosphorus on cardiovascular structures, phosphorus is known to stimulate lipolysis, a finding that opens a new area for potential metabolic consequences of elevated phosphorus in HF.34
Taking all these in mind, we believe that it is prudent to study phosphorus as a likely and important player in HF pathophysiology.
Conclusions
Our study identified metabolic status as an important and independent determinant of serum phosphorus in HF. We showed an association between catabolism in HF and elevation of serum phosphorus above thresholds known to increase the risk of mortality in various populations. The potential role of higher serum phosphorus in HF pathophysiology warrants further studies.
Strength and limitations
The study extends our knowledge on non-renal determinants of serum phosphorus in HF, pointing out to long-term metabolic status change as a potential important modulator.
The study has also limitations. The cross-sectional study design precludes any causation analysis. The most important limitation is that we cannot rule out some fluid retention as a contributor to maximal body weight. Also, clinical judgement of freedom from fluid overload might not have been sensitive enough to establish true oedema-free weight at minimum in HF and at index date. As a consequence, the determination of anabolic and catabolic components of weight change might have been subjected to significant bias. Finally, we did not differentiate between catabolism-driven and intentional weight loss in our patients. This factor might have been an additional source of bias. Interpretation is also impeded by the lack of data on serum parathyroid hormone, phosphatonines, and vitamin D.
Acknowledgments
The authors certify that they comply with the ethical guidelines for authorship and publishing of the Journal of Cachexia, Sarcopenia and Muscle (von Haehling S, Morley JE, Coats AJS and Anker SD. Ethical guidelines for authorship and publishing in the Journal of Cachexia, Sarcopenia and Muscle. J Cachexia Sarcopenia Muscle. 2010;1:7–8).
The research leading to these results has received funding from the European Union Seventh Framework Programme (FP7/2007–2013) under grant agreement Number 241558 (SICA-HF).
Conflict of interest
None declared.
References
- Kornberg A, Rao NN, Ault-Riché D. Inorganic polyphosphate: a molecule of many functions. Annu Rev Biochem. 1999;68:89–125. doi: 10.1146/annurev.biochem.68.1.89. [DOI] [PubMed] [Google Scholar]
- Kemp GJ, Meyerspeer M, Moser E. Absolute quantification of phosphorus metabolite concentrations in human muscle in vivo by 31P MRS: a quantitative review. NMR Biomed. 2007;20:555–65. doi: 10.1002/nbm.1192. [DOI] [PubMed] [Google Scholar]
- Morth JP, Pedersen BP, Buch-Pedersen MJ, Andersen JP, Vilsen B, Palmgren MG, et al. A structural overview of the plasma membrane Na+,K+-ATPase and H+-ATPase ion pumps. Nat Rev Mol Cell Biol. 2011;12:60–70. doi: 10.1038/nrm3031. [DOI] [PubMed] [Google Scholar]
- Howard SC, Jones DP, Pui C-H. The tumor lysis syndrome. New Eng J Med. 2011;364:1844–54. doi: 10.1056/NEJMra0904569. [DOI] [PMC free article] [PubMed] [Google Scholar]
- Loncar G, Fülster S, von Haehling S, Popovic V. Metabolism and the heart: an overview of muscle, fat, and bone metabolism in heart failure. Int J Cardiol. 2013;162:77–85. doi: 10.1016/j.ijcard.2011.09.079. [DOI] [PubMed] [Google Scholar]
- Pocock SJ, McMurray JJV, Dobson J, Yusuf S, Granger CB, Michelson EL, et al. Weight loss and mortality risk in patients with chronic heart failure in the candesartan in heart failure: assessment of reduction in mortality and morbidity (CHARM) programme. Eur Heart J. 2008;29:2641–50. doi: 10.1093/eurheartj/ehn420. [DOI] [PubMed] [Google Scholar]
- Anker SD, Negassa A, Coats AJS, Afzal R, Poole-Wilson PA, Cohn JN, et al. Prognostic importance of weight loss in chronic heart failure and the effect of treatment with angiotensin-converting-enzyme inhibitors: an observational study. The Lancet. 2003;361:1077–83. doi: 10.1016/S0140-6736(03)12892-9. [DOI] [PubMed] [Google Scholar]
- Boxall BWJ, Clark AL. Beta-blockers and weight change in patients with chronic heart failure. J Card Fail. 2012;18:233–7. doi: 10.1016/j.cardfail.2011.10.016. [DOI] [PubMed] [Google Scholar]
- Tonelli M, Sacks F, Pfeffer M, Gao Z, Curhan G. Cholesterol And Recurrent Events (CARE) Trial Investigators. Relation between serum phosphate level and cardiovascular event rate in people with coronary disease. Circulation. 2005;112:2627–33. doi: 10.1161/CIRCULATIONAHA.105.553198. [DOI] [PubMed] [Google Scholar]
- McGovern AP, de Lusignan S, van Vlymen J, Liyanage H, Tomson CR, Gallagher H, et al. Serum phosphate as a risk factor for cardiovascular events in people with and without chronic kidney disease: a large community based cohort study. PLoS One. 2013;8:e74996. doi: 10.1371/journal.pone.0074996. [DOI] [PMC free article] [PubMed] [Google Scholar]
- McMurray JJV, Adamopoulos S, Anker SD, Auricchio A, Böhm M, Dickstein K, et al. ESC guidelines for the diagnosis and treatment of acute and chronic heart failure 2012: the task force for the diagnosis and treatment of acute and chronic heart failure 2012 of the European Society of Cardiology. Developed in collaboration with the Heart Failure Association (HFA) of the ESC. Eur Heart J. 2012;33:1787–847. doi: 10.1093/eurheartj/ehs104. . ESC Committee for Practice Guidelines (CPG), Document Reviewers. [DOI] [PubMed] [Google Scholar]
- von Haehling S, Lainscak M, Doehner W, Ponikowski P, Rosano G, Jordan J, et al. Diabetes mellitus, cachexia and obesity in heart failure: rationale and design of the studies investigating co-morbidities aggravating heart failure (SICA-HF) J Cachexia Sarcopenia Muscle. 2010;1:187–94. doi: 10.1007/s13539-010-0013-3. [DOI] [PMC free article] [PubMed] [Google Scholar]
- Larsson TE, Olauson H, Hagström E, Ingelsson E, Ärnlöv J, Lind L, et al. Conjoint effects of serum calcium and phosphate on risk of total, cardiovascular, and noncardiovascular mortality in the community. Arterioscler Thromb Vasc Biol. 2010;30:333–9. doi: 10.1161/ATVBAHA.109.196675. [DOI] [PubMed] [Google Scholar]
- Abramowitz M, Muntner P, Coco M, Southern W, Lotwin I, Hostetter TH, et al. Serum alkaline phosphatase and phosphate and risk of mortality and hospitalization. Clin J Am Soc Nephrol. 2010;5:1064–71. doi: 10.2215/CJN.08621209. [DOI] [PMC free article] [PubMed] [Google Scholar]
- Plischke M, Neuhold S, Adlbrecht C, Bielesz B, Shayganfar S, Bieglmayer C, et al. Inorganic phosphate and FGF-23 predict outcome in stable systolic heart failure. Eur J Clin Invest. 2012;42:649–56. doi: 10.1111/j.1365-2362.2011.02631.x. [DOI] [PubMed] [Google Scholar]
- Wannamethee SG, Sattar N, Papcosta O, Lennon L, Whincup PH. Alkaline phosphatase, serum phosphate, and incident cardiovascular disease and total mortality in older men. Arterioscler Thromb Vasc Biol. 2013;33:1070–6. doi: 10.1161/ATVBAHA.112.300826. [DOI] [PubMed] [Google Scholar]
- Aronson D, Kapeliovich M, Hammerman H, Dragu R. The relation between serum phosphorus levels and clinical outcomes after acute myocardial infarction. PLoS One. 2013;8:e58348. doi: 10.1371/journal.pone.0058348. [DOI] [PMC free article] [PubMed] [Google Scholar]
- Dominguez JR, Kestenbaum B, Chonchol M, Block G, Laughlin GA, Lewis CE, et al. Relationships between serum and urine phosphorus with all-cause and cardiovascular mortality: the Osteoporotic Fractures in Men (MROS) study. Am J Kidney Dis. 2013;61:555–63. doi: 10.1053/j.ajkd.2012.11.033. [DOI] [PMC free article] [PubMed] [Google Scholar]
- Ess M, Heitmair-Wietzorrek K, Frick M, Umlauf N, Ulmer H, Poelzl G. Serum phosphate and long-term outcome among patients with stable heart failure. J Card Fail. 2013;19:25–30. doi: 10.1016/j.cardfail.2012.11.008. [DOI] [PubMed] [Google Scholar]
- Ian HdB, Tessa CR, Bryan K. Serum phosphorus concentrations in the Third National Health and Nutrition Examination Survey (NHANES III) American Journal of Kidney Diseases: the official journal of the National Kidney Foundation. 2009;53:399–407. doi: 10.1053/j.ajkd.2008.07.036. [DOI] [PMC free article] [PubMed] [Google Scholar]
- Cy Hsu, Chertow GM. Elevations of serum phosphorus and potassium in mild to moderate chronic renal insufficiency. Nephrol Dial Transplant. 2002;17:1419–25. doi: 10.1093/ndt/17.8.1419. [DOI] [PubMed] [Google Scholar]
- Jankowska EA, Jakubaszko J, Cwynar A, Majda J, Ponikowska B, Kustrzycka-Kratochwil D, et al. Bone mineral status and bone loss over time in men with chronic systolic heart failure and their clinical and hormonal determinants. Eur J Heart Fail. 2009;11:28–38. doi: 10.1093/eurjhf/hfn004. [DOI] [PubMed] [Google Scholar]
- Terrovitis J, Zotos P, Kaldara E, Diakos N, Tseliou E, Vakrou S, et al. Bone mass loss in chronic heart failure is associated with secondary hyperparathyroidism and has prognostic significance. Eur J Heart Fail. 2012;14:326–32. doi: 10.1093/eurjhf/hfs002. [DOI] [PubMed] [Google Scholar]
- Pureza V, Florea V. Mechanisms for cachexia in heart failure. Curr Heart Fail Rep. 2013;10:307–14. doi: 10.1007/s11897-013-0153-9. [DOI] [PubMed] [Google Scholar]
- Ravera S, Virkki LV, Murer H, Forster IC. Deciphering PiT transport kinetics and substrate specificity using electrophysiology and flux measurements. Am J Physiol – Cell Physiology. 2007;293:C606–C20. doi: 10.1152/ajpcell.00064.2007. [DOI] [PubMed] [Google Scholar]
- Shi X-F, Carlson PJ, Kim T-S, Sung Y-H, Hellem TL, Fiedler KK, et al. Effect of altitude on brain intracellular pH and inorganic phosphate levels. Psychiat Res: Neuroim. 2014;222:149–56. doi: 10.1016/j.pscychresns.2014.04.002. [DOI] [PMC free article] [PubMed] [Google Scholar]
- Sugita A, Kawai S, Hayashibara T, Amano A, Ooshima T, Michigami T, et al. Cellular ATP synthesis mediated by type III sodium-dependent phosphate transporter Pit-1 is critical to chondrogenesis. J Bio Chem. 2011;286:3094–103. doi: 10.1074/jbc.M110.148403. [DOI] [PMC free article] [PubMed] [Google Scholar]
- Pavlov E, Aschar-Sobbi R, Campanella M, Turner RJ, Gómez-García MR, Abramov AY. Inorganic polyphosphate and energy metabolism in mammalian cells. J Bio Chem. 2010;285:9420–8. doi: 10.1074/jbc.M109.013011. [DOI] [PMC free article] [PubMed] [Google Scholar]
- Kumble KD, Kornberg A. Inorganic polyphosphate in mammalian cells and tissues. J Bio Chem. 1995;270:5818–22. doi: 10.1074/jbc.270.11.5818. [DOI] [PubMed] [Google Scholar]
- Nigwekar SU, Wenger J, Thadhani R, Bhan I. Hyponatremia, mineral metabolism, and mortality in incident maintenance hemodialysis patients: a cohort study. Am J Kidney Dis. 2013;62:755–62. doi: 10.1053/j.ajkd.2013.02.367. [DOI] [PMC free article] [PubMed] [Google Scholar]
- Shuto E, Taketani Y, Tanaka R, Harada N, Isshiki M, Sato M, et al. Dietary phosphorus acutely impairs endothelial function. J Am Soc Nephrol. 2009;20:1504–12. doi: 10.1681/ASN.2008101106. [DOI] [PMC free article] [PubMed] [Google Scholar]
- Son B-K, Kozaki K, Iijima K, Eto M, Kojima T, Ota H, et al. Statins protect human aortic smooth muscle cells from inorganic phosphate-induced calcification by restoring Gas6-Axl survival pathway. Circ Res. 2006;98:1024–31. doi: 10.1161/01.RES.0000218859.90970.8d. [DOI] [PubMed] [Google Scholar]
- Giachelli CM. Vascular calcification: in vitro evidence for the role of inorganic phosphate. J Am Soc Nephrol. 2003;14:S300–4. doi: 10.1097/01.asn.0000081663.52165.66. [DOI] [PubMed] [Google Scholar]
- Lee NSD. HH Hadley M. Stimulation of lipolysis by phosphate in vitro and in vivo. J Nutr. 1982;112:211–5. doi: 10.1093/jn/112.2.211. [DOI] [PubMed] [Google Scholar]