

Abstract
The two members of the group I metabotropic glutamate receptor family, mGluR1 and mGluR5, both couple to Gq to mediate rises in intracellular calcium. The alternatively spliced C termini (CT) of mGluRs 1 & 5 are known to be critical for regulating receptor activity and to terminate in motifs suggestive of potential interactions with PDZ domains. We therefore screened the CTs of both mGluR1a and mGluR5 against a PDZ domain proteomic array. Out of 96 PDZ domains examined, the domain that bound most strongly to mGluR5-CT was the second PDZ domain of the Na+/H+ exchanger regulatory factor 2 (NHERF-2). This interaction was confirmed by reverse overlay, and a single point mutation to the mGluR5-CT was found to completely disrupt the interaction. Full-length mGluR5 robustly associated with full-length NHERF-2 in cells, as assessed by co-immunoprecipitation and confocal microscopy experiments. In contrast, mGluR1a was found to bind NHERF-2 in vitro with a weaker affinity than mGluR5, and furthermore mGluR1a did not detectably associate with NHERF-2 in a cellular context. Immunohistochemical experiments revealed that NHERF-2 and mGluR5 exhibit overlapping patterns of expression in mouse brain, being found most abundantly in astrocytic processes and postsynaptic neuronal elements. In functional experiments, the interaction of NHERF-2 with mGluR5 in cells was found to prolong mGluR5-mediated calcium mobilization and to also potentiate mGluR5-mediated cell death, whereas co-expression of mGluR1a with NHERF-2 had no evident effects on mGluR1a functional activity. These observations reveal that NHERF-2 can selectively modulate mGluR5 signaling, which may contribute to cell-specific regulation of mGluR5 activity.
Many of the physiological effects of L-glutamate as a neurotransmitter are mediated via stimulation of metabotropic glutamate receptors (mGluRs),2 which are considered to be important therapeutic targets in the potential treatment of a number of different diseases (1–3). The mGluRs are G protein-coupled receptors that regulate the physiology of neurons and glia through activation of various secondary messenger systems (4). Eight subtypes of mGluRs have been identified and classified into three groups (I, II, III) based on sequence homology, signaling pathways and pharmacological selectivity. The various mGluR subtypes are known to display differential regional and cellular distributions throughout the mammalian brain (4).
Activation of group I mGluRs (mGluR1 and mGluR5) leads to signal transduction primarily through coupling to Gq and phospholipase C, which then hydrolyzes phosphatidylinositol 4,5-bisphosphate (PIP2) to form the second messenger inositol 1,4,5-phosphate (IP3). IP3 binding to its receptor in the membrane of the endoplasmic reticulum causes release of free Ca2+ in the cytosol, which generates a signaling cascade. Group I mGluRs can also couple to other signaling pathways in a cell type-specific manner (5). Despite many similarities in their signaling pathways, mGluR1 and mGluR5 expressed in the same neuronal populations sometimes exert quite distinct physiological effects (6). These two receptors possess 60% sequence identity and differ mainly in their long intracellular C termini (CT). Functional differences between mGluR1 and mGluR5 might be explained by specific interactions of their CTs with cytoplasmic binding partners. For example, mGluR1 and mGluR5 splice variants, which differ only in their CT regions, display different constitutive activities: in contrast to the short forms (mGluR1b, -1c, and -1d), the long forms of group I mGluRs (mGluR1a, -5a, and -5b) display significant constitutive activity in the absence of agonist (7). This constitutive activity can be reduced by interaction of the CTs with members of the Homer family of proteins (8). Homer proteins have also been shown to play a role in the targeting and trafficking of group I mGluRs (9).
A role in the regulation of the trafficking of group I mGluRs has also been proposed for several proteins possessing PDZ (PSD-95/Discs large/ZO-1 homology) domains. PDZ domains are modular protein interaction domains that bind to short CT peptides in a sequence-specific manner. Based on the sequences of their preferred binding motifs, PDZ domains are divided into three broad classes (10). The long forms of group I mGluRs possess motifs appropriate for interaction with Class I PDZ domains. PDZ proteins are often involved in the assembly of supramolecular complexes that perform localized signaling functions at particular subcellular locations (11). Formation of such molecular complexes might conceivably contribute to the importance of the mGluR1 and mGluR5 C termini in regulating receptor activity. To date, two PDZ proteins, tamalin/GRASP and Shank3, have been reported to interact with group I mGluRs, but these proteins do not distinguish between mGluR1 and mGluR5, and moreover no effects of these interactions on receptor signaling have been definitively established (12, 13). Using a proteomic approach screening 96 known or putative Class I PDZ domains, we identified a novel interaction between mGluR5 and the Na+/H+ exchanger regulatory factor 2 (NHERF-2). In contrast to the robust association observed with mGluR5, NHERF-2 was found to bind only weakly to mGluR1 in vitro and did not detectably associate with mGluR1 in cells. The NHERF-2 interaction with mGluR5 was found to prolong mGluR5-mediated calcium signaling and enhance mGluR5-induced cell death, revealing functionally important consequences for this interaction.
MATERIALS AND METHODS
Expression and Purification of Fusion Proteins
Wild type (WT) and mutant GST-tagged mGluR-CT constructs were created by PCR using mutant sequence oligonucleotides (mGluR1a: 5′ oligo, 5′ -AGACACGAATTCGTCCTCTGCACCCCTCCAAATGTA-3′, 3′ oligo, 5′ -AGACACCT-CGAGCTACAGGGTGGAAGAGCTTTGCTT-3′; mGluR5: 5′ oligo for all constructs, 5′-GAATTCGCCCTCTGCATCCC-ATCCTCTCCC-3′, 3′ oligo for SSSL (WT), 5′ -AGACACCT-CGAGTCACAACGATGAAGAACTCTGCGT-3′, 3′ oligo for SSSA, 5′ -AGACACCTCGAGTCACGCCGATGAAGAACT-CTGCGT-3′, 3′ oligo for SSAL, 5′ -AGACACCTCGAGTCA-CAACGCTGAAGAACTCTGCGT-3′, 3′ oligo for SASL, 5′ -AGACACCTCGAGTCACAACGACGCAGAACTCTGCGT-3′, and 3′ oligo for ASSL, 5′ -AGACACCTCGAGTCACAACG-ATGACGCACTCTGCGT-3′) and inserting the PCR products digested with EcoR1 and XhoI into the pGEX-4T1 vector (Amersham Biosciences). All constructs were confirmed by ABI sequencing.
His6- and S-tagged fusion proteins were obtained by bacterial expression of constructs in the pET-30A vector (Novagen, Madison, WI), while GST-tagged fusion proteins were created via bacterial expression of constructs in the vector pGEX-4T1 (Amersham Biosciences). His-tagged fusion proteins were purified using ProBond nickel resin (Invitrogen, Carlsbad, CA) and GST-tagged fusion proteins were purified with glutathione-agarose beads (Sigma). Fusion proteins were eluted from the resin according to the manufacturer’s instructions and the protein concentrations were determined using the Bio-Rad Protein assay.
Screening of the PDZ Domain Proteomic Array
To identify novel PDZ domains interacting with group I mGluRs, we screened the type I PDZ domain array as previously described (14, 15) with C termini GST fusion proteins of mGluR1a and mGluR5. Briefly, the purified His- and S-tagged PDZ domain fusion proteins were spotted at 1 μg per bin onto Nytran SuperCharge 96-grid nylon membranes (Schleicher & Schuell BioScience, Keene, NH). The membranes were allowed to dry overnight and then blocked in “blot buffer” (2% nonfat dry milk, 0.1% Tween-20, 50 mM NaCl, 10 mM Hepes, pH 7.4) for 1 h at room temperature. The mGluR1a or mGluR5-CT fusion proteins, corresponding to the last 25 amino acids of the receptors (100 nM in blot buffer), were then overlaid onto the membranes containing the array of PDZ domains. Side-by-side control experiments were always performed overlaying GST alone to assess the nonspecific background binding. After incubation with the GST fusion proteins for 1 h, the membranes were washed five times with 10 ml of blot buffer, and then incubated with an horseradish peroxidase-coupled anti-GST monoclonal antibody (Amersham Biosciences). After a 1-h incubation, the membranes were washed five times with blot buffer, and the binding of the GST fusion proteins was visualized via enzyme-linked chemiluminescence using an ECL kit (Amersham Biosciences).
Cell Culture and Transfection
HEK-293 cells were maintained in Dulbecco’s modified Eagle’s medium (DMEM, Invitrogen) supplemented with 10% fetal bovine serum (Atlanta Biologicals, Atlanta, GA) and 1% penicillin/streptomycin (PenStrep) in a 37 °C/5% CO2 incubator. C6 glioma cells were maintained DMEM supplemented with 10% non-heat-inactivated fetal bovine serum and 1% PenStrep. Cells were split every 3–4 days. For HEK-293 cell transfections, cells were split onto 100-mm plates, grown to 80–90% confluency and transfected with the appropriate cDNA using Lipofectamine according to the manufacturer’s instructions (Invitrogen). C6 cells were nucleofected following the manufacturer’s recommendations (Amaxa, Gaithersburg, MD). For each transfection, 2 μg of plasmid cDNA for each construct was used. The cDNAs used were rat Flag-mGluR1a in pcDNA1 (kindly provided by Stephen Ferguson, University of Western Ontario), rat mGluR5a (kindly provided by Jean-Philippe Pin, Institut de Genomique Fonctionnelle), Flag-mGluR5a, L1171A mutant mGluR5a, Flag-L1171A, and Myc-Homer3 (kindly provided by Paul Worley, Johns Hopkins) in pRK5, human FLAG-NHERF-2 and HA-NHERF2 in pBK, human GFP-NHERF-2 in pGFP, empty pBK and pRK5 vectors. L1171A constructs were designed and created by using the QuikChange Site-directed mutagenesis kit (Stratagene, La Jolla, CA) instructions with the following primers: 5′ oligo, CAGAGTTCTTCATCGGCGTGAGCCACTGG-AAA-3′ and 3′ oligo, 5′-TTTCCAGTGGCTCACGCCGATGAAGAACTCTG-3′ and verified by ABI sequencing.
Blot Overlay Assays, Immunoprecipitation, and Western Blotting
Blot overlay assays, immunoprecipitation experiments, and Western blotting were performed as previously described (16). For overlay experiments, 1 μg of purified protein was separated by SDS-PAGE, blotted onto nitrocellulose, and overlaid with His-NHERF-2. Affinity estimates were generated in saturation binding assays utilizing increasing concentrations of overlaid NHERF-2 and quantification of binding at each concentration by densitometric scanning of immunoreactive bands. The amount of protein loading in all experiments was assessed by Coomassie staining. Immunoprecipitation experiments were performed without cross-linking and using anti-FLAG M2 affinity gel (Sigma) or anti-HA.11 affinity matrix (Covance, Princeton, NJ) for studies on transfected cells. For immunoprecipitation experiments utilizing mouse brain tissue, 1 μg of anti-NHERF-2 antibody (17) or rabbit normal IgG (Santa Cruz Biotechnology) was used per sample in conjunction with protein A/G-agarose (Calbiochem). Mouse brain tissue was solubilized with a buffer containing 20 mM Hepes, pH 7.4, 100 mM NaCl, 0.5% Triton X-100, and 0.2% sodium deoxycholate. To detect endogenous and/or transfected mGluR1a, mGluR5, Myc-Homer3, and NHERF-2 on Western blots, the antibodies used were polyclonal rabbit anti-mGluR1a (1:2,500, Chemicon, Temecula, CA), polyclonal rabbit anti-mGluR5 (1:4,000, Upstate Biotechnology, Waltham, MA), monoclonal anti-Myc (1:500, Santa Cruz Biotechnology), and anti-NHERF-2 (1:7,000) (17).
Immunocytochemistry and Microscopy
Confocal Microscopy
Transfected COS-7 cells were grown at about 50% confluency onto culture slides (BD Biosciences, Bedford, MA). After fixation with 4% paraformaldehyde, cells were washed with D-PBS/Ca2+ (Invitrogen), blocked with 2% bovine serum albumin (Fisher Scientific, Hampton, NH), and permeablized for 30 min with 0.3% Triton X-100 (TX, Fisher Scientific, Hampton, NH). Then, the cells were incubated for 1 h with primary antibodies (mouse M2 anti-FLAG (1:400, Sigma) and rabbit anti-NHERF-2 (1:3,500)) in 0.3%TX/2% bovine serum albumin/D-PBS/Ca2+. Following washes with 0.3%TX/2% bovine serum albumin/D-PBS/Ca2+, the cells were incubated with donkey rhodamine anti-mouse and FITC anti-rabbit (1:250, Jackson ImmunoResearch, West Grove, PA). As controls, primary antibodies were omitted in parallel incubations. After washes with D-PBS/Ca2+, the cells were dehydrated with 70% ethanol, and mounted with Vectashield mounting medium (Vector Laboratories, Burlingame, CA) and coverslips. Microscopy slides were sealed with nail polish and stored in the dark at 4 °C until examination with a Zeiss LSM410 confocal microscope (Carl Zeiss MicroImaging, Inc., Thornwood, NY) with 515–540 nm and 575–640 nm bandpass emission filters for FITC and rhodamine, respectively. The micrographs were taken with a ×63 objective.
Electron Microscopy
To visualize immunostaining for mGluR5 and NHERF-2 in native brain tissue, C57BL/6 mice were sacrificed by perfusion with a solution containing 4% paraformaldehyde and 0.1% glutaraldehyde. Brain sections were then prepared and processed for pre-embedding immunoperoxidase labeling as previously described (18). Briefly, 60-μm thick sections were incubated with rabbit anti-mGluR5 (1:2,000) or rabbit anti-NHERF-2 (1:7,000) followed by biotinylated anti-rabbit (1:200, Vector Laboratories Burlingame, CA), rinsed and then incubated with avidin-biotin-peroxidase complex (1:200, Vector Laboratories). The antibody complex was visualized following incubation with 3,3′-diaminobenzidine tetrahydrochloride (DAB; Sigma) and hydrogen peroxide. The sections were then processed for electron microscopy by osmification, dehydration and embedding into epoxy resin. Samples of cerebral cortex were taken, cut into 60-nm ultrathin sections, collected on copper grids, counterstained and examined with a Zeiss EM-10C electron microscope (Carl Zeiss MicroImaging Inc.) The micrographs were acquired with a CCD camera (DualView 300W; Gatan, Inc., Pleasanton, CA) controlled by DigitalMicrograph software (version 3.8.1; Gatan, Inc.). Micrographs were adjusted only for brightness and contrast, with the image resolution kept constant, with Photoshop software (version 7.0; Adobe Systems, Inc., San Jose, CA) to optimize the quality of the images.
Lactate Dehydrogenase (LDH) Release Assay
Cell death following HEK-293 cell transfection was measured using a CytoTox96 Non-reactive Cytotoxicity Assay (Promega). Briefly, HEK-293 cells were plated and grown onto 12-well plates until 80–90% confluency was reached. Four wells were transfected with the same cDNA:lipid mix of Lipofectamine reagent in DMEM in the presence or absence of the antagonist 2-methyl-6-(phenylethynyl)-pyridine (MPEP, Tocris Cookson, Ballwin, MO). After 4 h, DMEM with 10% fetal bovine serum and PenStrep was added to the transfected cells. Forty-four hours later, samples of media were collected from the first three wells, and after briefly washing the cells with D-PBS, the cells were harvested with 1× SDS-PAGE sample buffer to verify protein expression by Western blotting. The cells in the last well were lysed by a freeze-thaw cycle, and a sample from the media was collected to assess maximum LDH activity. Samples were centrifuged at 4 °C at 14,000 rpm for 5 min, and 50- μl aliquots in triplicate were transferred to a 96-well plate. Triplicate aliquots of culture media were also plated to correct for phenol red and endogenous LDH activity in the serum used. Then, the aliquots of samples were incubated with reconstituted substrate mix (INT, a tetrazolium salt) for 30 min at room temperature in the dark. The reaction was stopped by adding 50 μl of 1 M acetic acid, and the red formazan product because of the conversion of the substrate by LDH enzyme was quantified by measuring absorbance at 490 nm. After subtraction of the background values of the culture media, the percentage of total LDH release was calculated as 100× (mean experimental A490/mean maximum A490) for each triplicate of individual well samples. Paired measurements from at least three independent experiments were analyzed with an one-way ANOVA followed by post-hoc Bonferroni tests.
[3H]Inositol Phosphate Production
Transfected HEK-293 cells in 12-well plates were serum-starved overnight in DMEM containing 4 μCi/ml [3H]inositol (American Radiolabeled Chemicals). Cells were placed in media supplemented with 10 mM LiCl in the presence or absence of antagonist for 30 min at 37 °C/5% CO2 and the reactions were stopped by adding ice-cold formic acid (20 mM). Samples were incubated at 4 °C for 1 h. After addition of 0.7 M NH4OH and solubilization, [3H]inositol phosphates were isolated by Dowex ion exchange chromatography. Eluted samples were added to 10 ml of scintillation liquid (ScintiSafe, Fisher Scientific) and analyzed by liquid scintillation spectrometry with an LS6500 scintillation counter (Beckman Coulter, Fullerton, CA).
Calcium Imaging
The Ca2+-sensitive fluorophore fura-2 (Molecular Probes, Eugene, OR) was used for ratiometric Ca2+ imaging in HEK-293 and C6 glioma cells. All fluorescence measurements were made from subconfluent areas of the dishes so that individual cells could be readily identified. Following transfection in 100-mm plates, cells were split onto poly-D-lysine-coated coverslips immersed in 1 ml of media in 24-well plates and grown for 1–2 days. Prior to imaging, coverslips were incubated at room temperature for 30–60 min in extracellular recording solution (ECS) composed of: 150 mM NaCl, 10 mM Hepes, 3 mM KCl, 2 mM CaCl2, 2 mM MgCl2, 5.5 mM glucose, pH 7.4, and 325 mOsm. ECS was supplemented with pluronic acid (0.001%) and fura-2 AM (2 μM). Subsequently, coverslips were thoroughly rinsed with extracellular solution lacking fura-2 AM and mounted onto the microscope stage for imaging. Intensity images of 510-nm emission wavelengths were taken at 340- and 380-nm excitation wavelengths, and the two resulting images were taken from individual cells for ratio calculations. Axon Imaging Workbench version 2.2.1 (Axon Instruments, Union City, CA) was used for acquisition of intensity images and conversion to ratios. Bath applications of the group I mGluR agonist (S)-3,5-dihydroxyphenylglycine (DHPG, Tocris Cookson, Ballwin, MO) were performed for 20 s.
RESULTS
Screening of a PDZ Domain Proteomic Array with mGluR1-CT and mGluR5-CT
The last 25 amino acids of mGluR1a and mGluR5 were prepared as GST fusion proteins. The mGluR1a and mGluR5 C termini possess similar PDZ binding motifs that differ only by the residue at the 1 position. Metabotropic GluR1a ends with SSTL, whereas mGluR5 terminates with the motif SSSL. The binding of mGluR1a-CT and mGluR5-CT to a proteomic array of 96 known or putative class I PDZ domains was assessed in overlay experiments (Fig. 1). In contrast to GST alone (Fig. 1A), the CTs of the group I mGluRs interacted with several of the PDZ domains on the array. Both mGluR1a-CT (Fig. 1B) and mGluR5-CT (Fig. 1C) bound most robustly to the second PDZ domain of NHERF-2 (bin B6). The binding of mGluR5-CT to NHERF-2 PDZ2 was consistently stronger than the binding of mGluR1a-CT. The mGluR5-CT also bound well to NHERF-1 PDZ1 (bind B3) but did not detectably bind to any other PDZ domains on the array. In contrast, mGluR1-CT bound detectably to NHERF-1 PDZ2 (bin B4), NHERF-2 PDZ1 (bin B5), the single PDZ domain of CAL (bin B10), and the first PDZ domain of MAGI-3 PDZ1 (bin A10).
FIGURE 1. Group I mGluR-CTs bind selectively to PDZ domains.
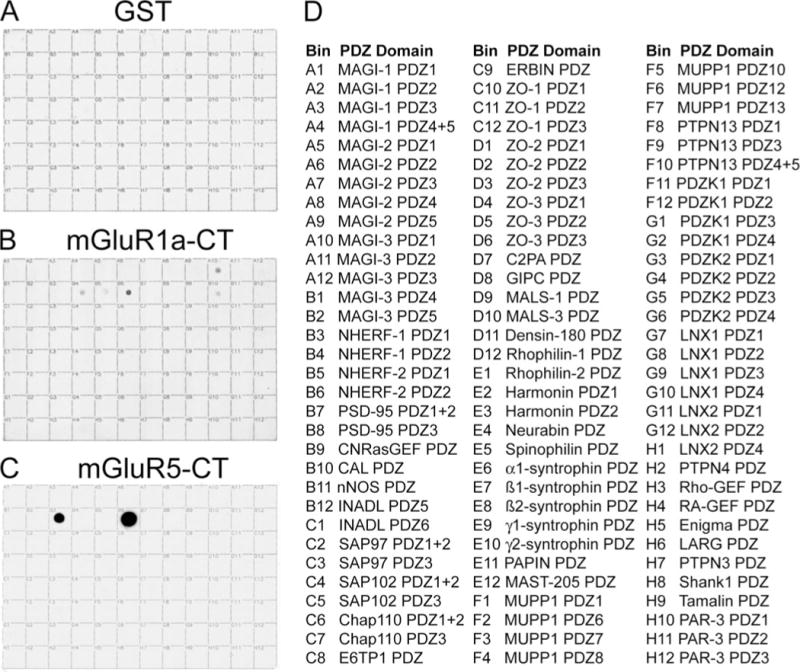
A proteomic array containing 96 putative class 1 PDZ domains (listed in D) was overlaid with 100 nM control GST (A) or GST fusion proteins corresponding to the last 25 amino acids of mGluR1a (B) or mGluR5 (C). In contrast to control GST, GST-mGluR1a-CT and GST-mGluR5-CT specifically bound with different intensities to various PDZ domains on the array. The data shown here are representative of 4–6 independent experiments for each fusion protein.
NHERF-2 Possesses Higher Affinity for mGluR5-CT than mGluR1a-CT
To confirm the direct interaction of NHERF-2 with group I mGluRs, we overlaid equal amounts of GST fusion proteins of mGluR1a-CT and mGluR5-CT tails with full-length His-tagged NHERF-2 (Fig. 2A) as well as with the individual NHERF-2 PDZ domains (not shown). In all cases, much stronger binding was observed to mGluR5, suggesting a higher affinity of NHERF-2 for this receptor. This difference in affinity was further investigated by overlaying increasing concentrations of NHERF-2 PDZ2 fusion protein onto the group I mGluR-CT fusion proteins and performing saturation binding analyses. The estimated affinity constant (KD) for mGluR5-CT was 349 nM, while the estimated affinity of mGluR1a-CT was more than 4-fold lower (1530 nM; Fig. 2B).
FIGURE 2. In vitro interaction of group I mGluRs with NHERF-2 shows a higher affinity for mGluR5-CT.
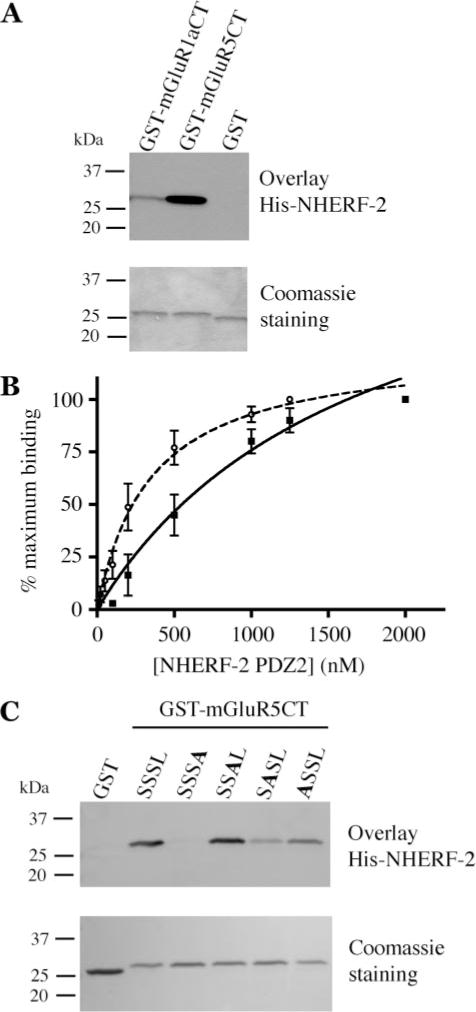
A, interaction of group I mGluR-CTs with full-length NHERF-2 was confirmed via blot overlay using 100 nM His-tagged NHERF-2. Equal protein loading was verified by Coomassie staining (lower panel). Substantially stronger binding was observed to mGluR5-CT than mGluR1a-CT. B, estimation of the affinity constants for NHERF-2 PDZ2 binding to mGluR1a-CT (solid squares, solid line; KD = 1530 nM) versus mGluR5-CT (open circles, dashed line; KD = 349 nM) confirmed that NHERF-2 PDZ2 binds to mGluR5-CT with much higher affinity. Points and error bars represent means + S.E. (n = 3). C, point-mutated versions of mGluR5-CT with the last four amino acids (SSSL) sequentially mutated to alanine were expressed as GST fusion proteins. These fusion proteins were loaded equally (1 μg) onto SDS/PAGE gels (lower panel), transferred to nitrocellulose, and overlaid with 100 nM full-length His-NHERF-2 fusion protein (upper panel). The NHERF-2/mGluR5-CT interaction was completely abolished by a single mutation to the last amino acid. These data are representative of three independent experiments.
Mutations to the SSSL Motif of mGluR5-CT Disrupt the mGluR/NHERF-2 Interaction
To elucidate the structural determinants of the interaction between mGluR5 and NHERF-2, we generated a series of mutant mGluR5-CT fusion proteins with sequential alanine substitutions of the various residues of the SSSL motif. Overlaid His-tagged NHERF-2 fusion protein associated strongly with the WT mGluR5-CT (Fig. 2C). However, this association was completely abolished by mutation of the terminal leucine residue to alanine. Mutation of mGluR5-CT at the -2 and -3 positions also resulted in significantly reduced binding of NHERF-2. Interestingly, replacement of the serine at the −1 position had little effect on the binding of NHERF-2 to the mGluR5-CT, suggesting that the difference between mGluR1 and mGluR5 at this position does not account for the difference in NHERF-2 binding observed between the two receptors. It is likely that residues outside of the last four amino acids of the receptors play a role in determining the affinity of NHERF-2 binding. However, the data shown in this panel clearly reveal the importance of the SSSL motif for mGluR5 association with NHERF-2, with the terminal leucine residue being an especially critical determinant of the interaction.
Full-length mGluR5a, but Not mGluR1a, Associates with NHERF-2 in Cells
To determine if NHERF-2 selectively interacts with mGluR5 in a cellular context, we performed co-immunoprecipitation experiments with the two full-length proteins in transfected HEK-293 cells. Metabotropic GluR5a was strongly co-immunoprecipitated with HA- or FLAG-NHERF-2 (Fig. 3A). The higher molecular mass mGluR5a species (>300 kDa), which presumably correspond to receptor homodimers unresolved by SDS-PAGE, were preferentially co-immunoprecipitated with NHERF-2 relative to mGluR5 monomers (~160 kDa). In accord with the fusion protein studies, a mutant version of mGluR5a with the terminal leucine residue changed to alanine (L1171A) did not co-immunoprecipitate with FLAG-NHERF-2, showing the specificity of the interaction (Fig. 3A). Furthermore, HA-NHERF-2 did not co-immunoprecipitate FLAG-mGluR1a (Fig. 3B). The reverse experiment, immunoprecipitation of FLAG-mGluR1a and blotting for NHERF-2, was also unsuccessful (not shown), confirming the low affinity of NHERF-2/mGluR1a interaction and the lack of cellular association between these two proteins. Additional co-immunoprecipitation studies were performed using whole brain lysates. NHERF-2 was immunoprecipitated from solubilized mouse brain, and Western blots of the immunoprecipitates revealed the presence of mGluR5 but not mGluR1 (Fig. 3C). These findings provide evidence that endogenous NHERF-2 interacts with mGluR5 in native brain tissue.
FIGURE 3. Cellular interaction of NHERF-2 with mGluR5 but not mGluR1a.
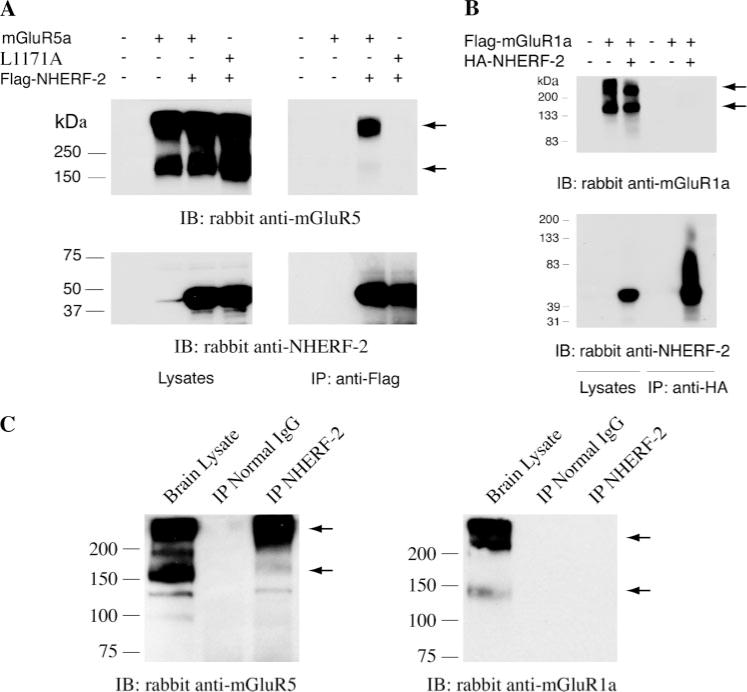
A, homodimers of mGluR5a co-immunoprecipitated (upper right panel) with FLAG-tagged NHERF-2 (lower right panel) from transfected HEK-293 cells (left panels). This co-immunoprecipitation was disrupted by point mutation of the last amino acid of mGluR5a (L1171A) (upper right panel). The amount loaded for the lysates is one-tenth of the amount used for immunoprecipitation in all experiments, and the data shown are representative of three independent experiments. B, immunoprecipitation of HA-tagged NHERF-2 (lower panel) did not result in co-immunoprecipitation of FLAG-tagged mGluR1a from transfected HEK-293 cells despite strong expression of the receptor as shown by the immunoblotting of the cell lysates (upper panel). C, immunoprecipitation of NHERF-2 from solubilized mouse brain resulted in significant co-immunoprecipitation of mGluR5 (left panel) but not mGluR1 (right panel). Immunoprecipitation with rabbit normal IgG did not result in any detectable pull-down of either mGluR1 or mGluR5, revealing the specificity of the mGluR5 co-immunoprecipitation with the anti-NHERF-2 antibody. The positions of mGluR1- and mGluR5-immunoreactive bands are indicated in all panels of this figure by the arrowheads. IP, immunoprecipitation; IB, immunoblotting.
Further evidence for a cellular mGluR5/NHERF-2 complex came from double immunofluorescence studies revealing colocalization of FLAG-mGluR5a with endogenous NHERF-2 in COS-7 cells (Fig. 4, A–C). The endogenous NHERF-2 in these cells is typically distributed evenly between the plasma membrane and cytosol, but transfection of the cells with mGluR5a resulted in preferential targeting of NHERF-2 to the plasma membrane, where it exhibited excellent co-localization with mGluR5a (Fig. 4C). These data, taken together with the co-immunoprecipitation data, provide strong evidence that mGluR5 and NHERF-2 associate in cells.
FIGURE 4. mGluR5 and NHERF-2 co-localize in COS-7 cells and exhibit similar patterns of expression in brain tissue.
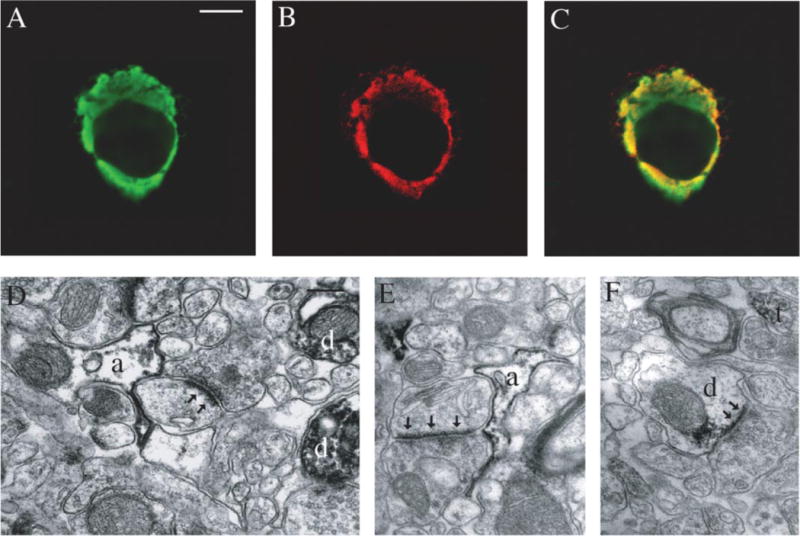
Immunofluorescence staining of endogenous NHERF-2 (A) in COS-7 cells exhibited an overlapping localization with transfected FLAG-tagged mGluR5a (B) as shown by a merging of the two images (C). D, mGluR5 immunoperoxidase labeling, visualized by the black amorphous deposit, was found in postsynaptic neuronal elements such as dendrites (d), as well as in astrocytic processes (a) in mouse cerebral cortex. An example of an mGluR5-positive astrocytic process surrounding an asymmetric synapse (arrows) is illustrated in this electron micrograph. E, NHERF-2 immunostaining was mainly found in astrocytic processes (a). Similar to mGluR5-immunostaining, NHERF-2-positive astrocytic processes could be found surrounding asymmetric synapses (arrowheads). F, occasional neuronal immunolabeling for NHERF-2 could also be found in the mouse cerebral cortex as shown by these examples of a dendrite (d) receiving an asymmetric synapse (arrowheads) and an axon terminal (t). Scale bars, A (valid for B and C): 10 μm and D (valid for E and F): 0.2 μm.
NHERF-2 Is Found in Similar Cellular Compartments as mGluR5 in the Brain
The interaction of mGluR5 with NHERF-2 could only be considered physiologically relevant if the two proteins were expressed together in native brain tissue. Because of technical limitations inherent in the fact that the anti-mGluR5 and anti-NHERF-2 antibodies used in our studies are from the same species (rabbit), direct co-localization of the receptor with NHERF-2 in single brain sections was not possible. Thus, we investigated the subcellular localization of mGluR5 and NHERF-2 proteins in mouse cerebral cortex to compare their pattern of cellular expression. Immunolabeling for mGluR5 was found mainly in postsynaptic neuronal elements such as spines and dendrites, but was also found in astrocytic processes (Fig. 4D). NHERF-2 immunostaining was mainly found in astrocytic processes (Fig. 4E), but was also encountered in pre- and post-synaptic neuronal elements (Fig. 4F). Interestingly, mGluR5 and NHERF-2 immunoreactivity could both often be observed in astrocytic processes surrounding putative glutamatergic synapses, identified by their asymmetric synapses (arrows in Fig. 4, D and E). Postsynaptic NHERF-2 immunoreactivity was also closely associated with asymmetric synapses (Fig. 4F). Thus, both mGluR5 and NHERF-2 are expressed in the same types of neuronal and astrocytic processes, often in proximity to glutamatergic synapses.
Interaction between mGluR5 and NHERF-2 Exacerbates mGluR5-mediated Cell Death
Following transfection of cells for the immunoprecipitation studies described above, we noted that co-transfection of NHERF-2 with mGluR5a, but not mGluR1a, resulted in the death of a significant fraction of the HEK-293 cells in each sample. To investigate this phenomenon more quantitatively, we measured the release of lactate dehydrogenase (LDH) that follows cell death (Fig. 5A). To control for toxicity because of the amount of DNA transfected, the same amount of DNA was used for all conditions by co-transfecting the corresponding empty vectors. In the absence of co-transfected NHERF-2 (Fig. 5A, black bars), transfection of mGluR5a significantly increased the amount of cell death compared with transfection of mGluR1a or untransfected cells. Transfection of the cells with the mutant mGluR5 (L1171A), which cannot interact with NHERF-2, resulted in significantly less cell death than transfection with WT mGluR5a, suggesting that the ability of mGluR5 to interact with the endogenous NHERF-2 in the HEK-293 cells contributed to the toxicity of the transfected mGluR5. Consistent with this idea, co-transfection of the WT mGluR5a with NHERF-2 was found to significantly increase cell death relative to transfection of mGluR5a alone (Fig. 5A, striped bars). In contrast, co-transfection of NHERF-2 with the L1171A mGluR5a mutant or mGluR1a did not increase cell death relative to transfection with L1171A or mGluR1a alone. Moreover, transfection with NHERF-2 alone did not increase cell death. These observations suggest that the interaction between mGluR5a and NHERF-2 increases cell death in transfected HEK-293 cells.
FIGURE 5. Co-expression of mGluR5 and NHERF-2 induces cell death in HEK-293 cells.
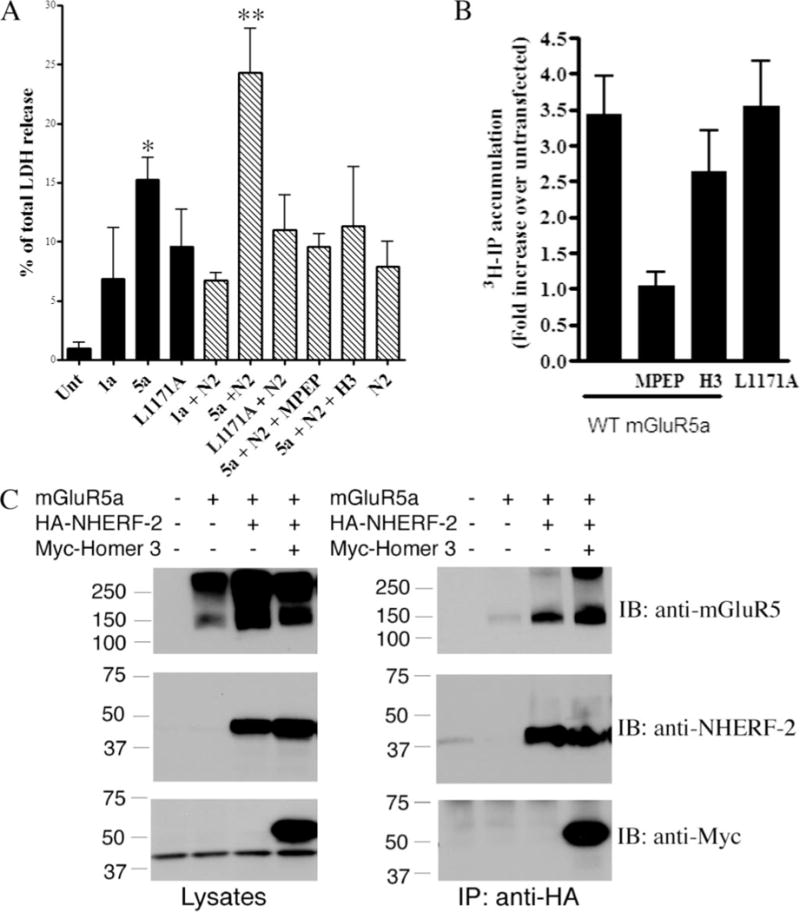
A, transfection-induced cell death was assessed by LDH release assay. In the presence of endogenous NHERF-2(black bars), overexpression of WTFLAG-tagged mGluR5a(5a) increased cell death relative to untransfected (unt) or FLAG-mGluR1a (1a) transfected cells. This cell death was significantly (* indicates p < 0.05, Bonferroni post-hoc test) reduced by disruption of the mGluR5/NHERF-2 interaction by the mGluR5 point mutation L1171A (L1171A). Overexpression of HA-NHERF-2 (N2, striped bars) increased significantly (** indicates p < 0.01, Bonferroni post-hoc test) cell death only when co-expressed with WTFLAG-tagged mGluR5a. This increase in cell death was reversed by blocking the constitutive activity of the receptor with10 μM of the mGluR5-specific inverse agonist MPEP, as well as by co-expression of Homer3 (H3). To control for toxicity because of the amount of DNA transfected, corresponding empty vector were transfected with the receptors or NHERF-2. The expression levels of mGluR1a and mGluR5 were comparable in these studies, asassessed by Western blotting. B, constitutive activity of mGluR5a measured by hydrolysis of phosphatidylinositol. Inositol phosphate (IP) accumulations were expressed as fold increase of [3H]IP formation in untransfected cells. Incubation with 10 μM of the inverse agonist MPEP completely abolished the constitutive activity of mGluR5a, whereas co-expression of Homer3 only partially inhibited the [3H]IP formation. In contrast, disruption of mGluR5a/NHERF-2 interaction by the point mutation L1171A did not change the accumulation of [3H]IP. C, NHERF-2, mGluR5a and Homer3 form a multiprotein complex. Immunoprecipitation of HA-NHERF-2 in the presence or absence of Myc-tagged Homer3 co-immunoprecipitated monomers and dimers of mGluR5a, as well as Myc-Homer3 (right panels). Lysate immunoblots (left panels) represent one-tenth of the amount used for immunoprecipitation. IP, immunoprecipitation; IB, immunoblotting.
To examine whether constitutive activity of the overexpressed mGluR5a was involved in the observed cell death, we blocked the constitutive activity of the receptor via two distinct mechanisms: treatment with the mGluR5-specific inverse agonist MPEP (19) and co-transfection of Homer3 (8). Both the inverse agonist and the overexpression of Homer3 significantly reduced cell death in mGluR5a/NHERF-2-transfected HEK-293 cells (Fig. 5A). The reduction in the constitutive activity of mGluR5a by MPEP and Homer3 was verified in experiments examining IP3 formation in the various sets of cells (Fig. 5B). MPEP treatment resulted in a much more complete block of mGluR5 constitutive activity than did Homer3 co-transfection. In contrast, disruption of the interaction of mGluR5a with NHERF-2 via the point mutation L1171A did not detectably lower the constitutive activity of mGluR5 (Fig. 5B, last bar). Finally, we explored the hypothesis that Homer3 co-transfection might protect against mGluR5-mediated toxicity by disrupting the interaction between NHERF-2 and mGluR5a. However, as shown in Fig. 5C, co-transfection with Homer3 did not reduce co-immunoprecipitation of mGluR5a with NHERF-2. In fact, Homer3 formed a ternary complex with the two other binding partners as shown by the co-immunoprecipitation of Homer3 with NHERF-2 in the presence of mGluR5a. Together, these data suggest that NHERF-2 potentiates mGluR5-mediated cell death by enhancing the constitutive signaling activity of mGluR5. Because no effect of NHERF-2 was observed on mGluR5-stimulated IP3 accumulation, though, we turned to a different downstream readout of mGluR5 activity and investigated the effect of NHERF-2 on intracellular Ca2+ signaling induced by mGluR5 activation.
NHERF-2 Selectively Prolongs Agonist-induced Ca2+ Signaling by mGluR5
To test if the NHERF-2 interaction with mGluR5a changes the kinetics of mGluR5-mediated Ca2+ signaling, we performed single cell ratiometric measurements of [Ca2+]i with fura-2 in HEK-293 cells transfected with WT mGluR5a or the mutant L1171A receptor, which does not interact with the cells’ endogenous NHERF-2. Following application of the group I mGluR agonist DHPG (100 μM for 20 s), transfected cells responded with transient increases in intracellular Ca2+ levels (Fig. 6A). Calcium oscillations were observed following the activation of both receptors (data not shown), but only the first peak was quantified in order to simplify the analysis. Strikingly, the agonist-induced Ca2+ signaling of WT mGluR5a was significantly prolonged relative to the duration of Ca2+ responses induced by the L1171A mutant (Fig. 6B). The half-life constants of the response decay of the first [Ca2+]i peak were 23.2 and 8.9 s, respectively, for WT mGluR5a and the L1171A mutant (Fig. 6C).
FIGURE 6. Disruption of the mGluR5/NHERF-2 interaction shortens the time course of mGluR5-mediated Ca2+ transients.
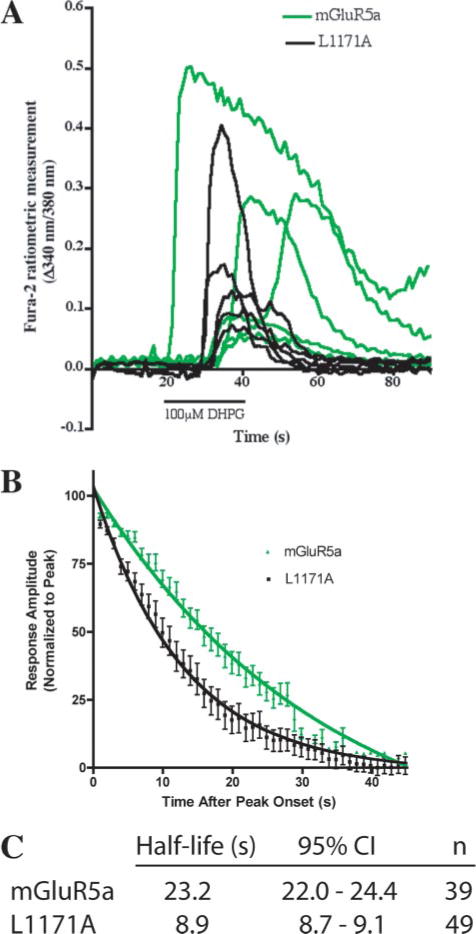
A, representative traces of responsive HEK-293 cells transfected with WT mGluR5a (green) or L1171A (black) showed variable latency and amplitude of the Ca2+ response following application (20 s) of 100 μM DHPG. B, mean + S.E. amplitudes of the initial Ca2+ peak responses of cells transfected with WT (green) or L1171A (black) mGluR5a were plotted as a function of time elapsed since the onset of peak amplitude. Response amplitudes were normalized to the peak amplitude of each response. The lines represent the best single exponential fit approximated for the decay phase of each data set and are defined by the equations y = 138.2e−0.0299x (WT mGluR5a) and y = 104.9e−0.0778x (L1171A). C, half-life (τ) values and associated 95% confidence intervals are represented for the decay of the first Ca2+ peak of responsive HEK-293 cells transfected with WT and L1171A mGluR5a.
Mutation of the terminal amino acid of mGluR5a could in theory disrupt protein-protein interactions other than the NHERF-2 interaction. Thus, we examined whether the observed difference in Ca2+ signaling was specifically caused by the interaction with NHERF-2 by co-expressing WT mGluR5a with GFP-NHERF-2 in C6 glioma cells, which do not express detectable levels of NHERF-2 (14). Despite the fact that group I mGluRs have been reported to be expressed at low levels in C6 cells (20, 21), untransfected or GFP-NHERF-2 transfected cells in our experiments lacked any detectable response to application of the group I agonist DHPG (data not shown). In contrast, mGluR5a-transfected cells responded to agonist application (Fig. 7, A and B). Cells expressing mGluR5a alone versus mGluR5a/GFP-NHERF-2 were identified by nonratiometric imaging of GFP fluorescence (Fig. 7A, left panel). Co-expression of GFP-NHERF-2 was found to prolong mGluR5a-mediated Ca2+ signaling at all agonist concentrations tested (Fig. 7B and Table 1).
FIGURE 7. GFP-NHERF-2 prolongs the duration of Ca2+ responses mediated by mGluR5a, but not mGluR1a, in C6 glioma cells.
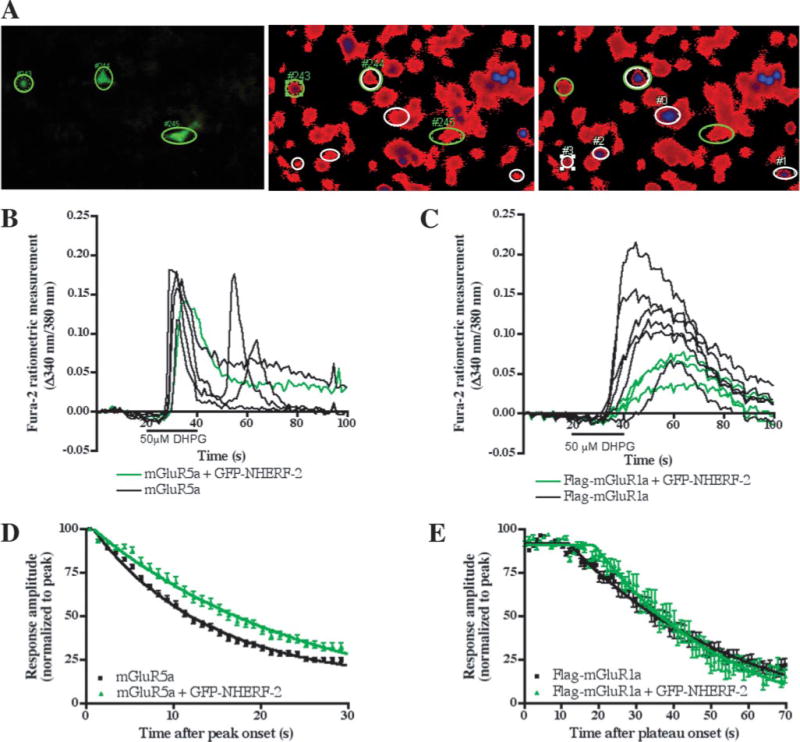
A, field of mGluR5a/GFP-NHERF-2-transfected cells illustrating expression of GFP-NHERF-2 (left panel) and fura-2 imaging before (middle panel) and after (right panel) application of 50 μM DHPG. GFP-NHERF-2-positive cells and DHPG-responsive cells are respectively indicated by green and white ovals. B, mGluR5a-mediated Ca2+ responses of the cells represented in panel A. Only one of the three GFP-NHERF-2-expressing cells responded to DHPG application (double oval in A, right panel and green trace). Two of the four non-GFP-NHERF-2 cells (black traces) generated Ca2+ oscillations. C, examples of mGluR1a-mediated Ca2+ responses in the presence (green) or absence (black) of GFP-NHERF-2. The Ca2+ transients were broader with a plateau and no Ca2+ oscillations were observed. D and E, mean ± S.E. amplitudes of the initial Ca2+ peak responses induced by 50 μM DHPG in cells transfected with mGluR5a (D, black), FLAG-tagged mGluR1a (E, black), or mGluR/GFP-NHERF-2 (D–E, green) were plotted as a function of time elapsed since the onset of peak amplitude. Response amplitudes were normalized to the peak amplitude of each response. The lines represent the best single exponential fit (mGluR5a) or plateau followed by single exponential fit (FLAG-mGluR1a) approximated for the decay phase of each data set and are defined by the equations y = 93.80e−0.07422x (mGluR5a), y = 108.00e−0.03980x (mGluR5a + GFP-NHERF-2), y = −14.41 + 106.56e−0.02139(x − 11.78) (FLAG-mGluR1a) and y = 15.33 + 106.18e−0.02730(x−18.84) (FLAG-mGluR1a + GFP-NHERF-2). The half-life values are reported in Table 1.
TABLE 1. Group I mGluR-induced Ca2+ signal decay constants (half life) in the presence or absence of GFP-NHERF-2 in C6 glioma cells.
Single cell fura-2 imaging was performed with transfected C6 cells after application of the group I agonist DHPG at the indicated concentrations. Changes in 340 nm/380 nm ratio were normalized to the initial peak of the Ca2+ response of individual cells and expressed in function of the time after the peak onset. Half-life constants (0.69/K) were derived from the fitting of mean + S.E. with single exponential fit (y = span × e−Kx).
| DHPG | mGluR5a
|
mGluR5a + GFP-NHERF-2
|
||||
|---|---|---|---|---|---|---|
| Half-life | 95% CIa | nb | Half-life | 95% CI | n | |
| μM | s | s | s | s | ||
| 2 | 7.61 | 7.49–7.74 | 9 | 15.71 | 14.20–17.22 | 9 |
| 10 | 6.90 | 6.84–6.96 | 83 | 11.29 | 11.01–11.51 | 28 |
| 50 | 8.84 | 8.75–8.89 | 104 | 17.41 | 16.61–18.10 | 29 |
| 100 | 8.24 | 8.15–8.34 | 82 | 11.08 | 10.90–11.27 | 40 |
| DHPG | mGluR5a
|
mGluR5a + GFP-NHERF-2
|
||||
|---|---|---|---|---|---|---|
| Half-life | 95% CI | n | Half-life | 95% CI | n | |
| μM | s | s | s | s | ||
| 50 | 32.26 | 31.24–33.35 | 33 | 25.27 | 27.54–23.36 | 13 |
CI, confidence interval.
n, number of cells.
In addition to the studies on mGluR5a signaling in the C6 glioma cells, we also performed similar experiments on C6 cells transfected with mGluR1a, which as shown earlier does not interact with NHERF-2 in cells. C6 cells transfected with mGluR1a- responded to agonist application in both the presence and absence of co-transfected GFP-NHERF-2 (Fig. 7C). As previously described (22), DHPG activation of mGluR1a evoked only a single transient increase in [Ca2+]i, in contrast to the mGluR5-induced oscillations that we frequently observed. Moreover, no effect of GFP-NHERF-2 co-transfection was observed on the kinetics of mGluR1a-mediated Ca2+ responses (Fig. 7E and Table 1), in striking contrast to the strong effect of NHERF-2 observed on mGluR5-mediated Ca2+ signaling (Fig. 7D). These findings reveal that the mGluR5/NHERF-2 interaction prolongs the duration of calcium mobilization in both HEK-293 cells and C6 glioma cells, and that this effect is selective for mGluR5 since the duration of mGluR1a-induced Ca2+ signaling was unaffected by the presence of NHERF-2.
DISCUSSION
NHERF-2 Selectively Interacts with mGluR5
We identified NHERF-2 as a cellular binding partner for mGluR5 and found that NHERF-2 association with mGluR5 prolongs intracellular calcium mobilization by mGluR5 and also promotes mGluR5-mediated toxicity. Our proteomic array analyses revealed the potential for an interaction between mGluR1a and NHERF-2, but subsequent quantitative studies demonstrated that this interaction was of much lower affinity than the mGluR5/NHERF-2 interaction. Moreover, we found no evidence at all that mGluR1a and NHERF-2 could associate in cells. The selective interaction of NHERF-2 with mGluR5 is interesting in light of the many known physiological differences between mGluR1 and mGluR5 (6). Because the two group I mGluRs bind to the same endogenous ligand and couple predominantly to the same G protein (Gq), the differences in the physiological actions of the two receptors most likely reflect differences in cellular binding partners that either mediate disparate signaling pathways or modulate receptor coupling to G proteins. NHERF-2 represents such a binding partner, since it interacts selectively with mGluR5 and regulates mGluR5 activity.
Interactions of group I mGluRs with two PDZ domain-containing proteins, tamalin and Shank3, have been previously reported (12, 13). In our screens with the PDZ domain array, however, no interactions of the group I mGluR-CTs were detected with either tamalin or Shank1, which shares ~80% homology with Shank3 (23). It is possible that Shank3 binds much better to the group I mGluR-CTs than does Shank1, thereby explaining why we did not detect an interaction with the Shank1 PDZ domain in our screens. Regarding the lack of observed interaction with the tamalin PDZ domain, it is possible that our tamalin PDZ domain fusion protein may be misfolded, or that its affinity for the mGluR-CTs may not be high enough to detect under the stringent washing conditions employed in our screens. In any case, it is likely that mGluR1 and mGluR5 can each interact with a handful of PDZ scaffolds that have distinct effects on receptor function and can therefore contribute to cell-specific regulation of receptor activity. The previous studies of tamalin and Shank3 interactions with group I mGluRs focused mainly on effects on receptor trafficking and/or clustering, whereas the findings reported here reveal a striking effect of NHERF-2 on mGluR5-mediated calcium signaling.
NHERF-2 Is a Scaffold That Regulates the Gq/Ca2+ Signaling Pathway
NHERF-2 (which is also known as E3KARP, SIP-1, and TKA-1) is a scaffold protein that contains two PDZ domains and one ERM-binding domain (24). ERM (ezrin, radixin, moesin) binding domains link NHERF-2 and the related scaffold NHERF-1 to the actin cytoskeleton by interacting with the ERM family of actin-binding proteins (25). Thus, via these multiple domains, NHERF-2 can link its interacting partners to each other and to the actin cytoskeleton. In addition, NHERF proteins can homo- and heterodimerize to form larger molecular complexes (16, 26–28).
We found that NHERF-2 interacts with mGluR5, which is a Gq-coupled receptor. Interestingly, NHERF-2 has also been shown to interact with various components of the Gq signaling pathway, such as PLCβ1/3 (14, 29), PKCα (30) and the Ca2+ channel TRPC4 (31). Moreover, the closely related protein NHERF-1 (also known as EBP50) has been shown to directly interact with Gq (32). Formation of a supramolecular complex by NHERF-2 could potentially organize Gq-mediated signaling and thereby explain the prolongation of the mGluR5-mediated [Ca2+]i increase observed in our studies. By physically tethering the signaling components of the Gq pathway, NHERF-2 may alter the kinetics of the Ca2+ signal. Interestingly, the interaction of PLCβ3 with another PDZ protein, Shank2, has been recently reported to regulate Ca2+ signaling by group I mGluRs in hippocampal neurons (33). In that study, disruption of the Shank2/PLCβ3 interaction significantly reduced the evoked [Ca2+]i peak. Similarly, overexpression of Shank1b in hippocampal neurons was found in a separate study to enhance Ca2+-dependent signaling by group I mGluRs (34). However, it was not established in either of those studies (33, 34) if direct interaction of the Shank proteins with mGluRs was required for the observed regulation to occur, or alternatively if the Shank proteins exerted their effects mainly by interacting with Homer proteins, which in turn can modulate the activity of group I mGluRs. Indeed, it has been shown that disruption of the molecular complex between Homer proteins, mGluR1a and IP3 receptors in Purkinje cells has significant effects on the kinetics of mGluR-evoked Ca2+ responses without altering total Ca2+ mobilization (35). Thus, based on these findings as well as our data presented here, it is reasonable to speculate that calcium signaling by group I mGluRs may undergo extensive fine-tuning in different areas of the brain depending on the complement of NHERF, Shank and Homer proteins expressed in a particular region.
Localization of NHERF-2 and mGluR5 in the Central Nervous System
Given that group I mGluRs can interact with a number of distinct regulatory proteins in the central nervous system, it is interesting to ask if these molecular complexes occur in all cells or if it is rather the case that these various interactions occur in different cellular compartments and/or distinct cell populations. Members of the Homer and Shank families of proteins possess heterogeneous distributions in the brain and have been shown to be predominantly localized in proximity to the postsynaptic density (PSD) regions of putative glutamatergic synapses in postsynaptic neuronal elements (23, 36), where labeling for group I mGluRs can also be found (37). Similarly, tamalin is also co-expressed with mGluR1a in PSDs (13). Our immunohistochemical data, as shown here and in a previous report (18), revealed that NHERF-2 is mainly expressed in astrocytes. Both mGluR1a and mGluR5 have been reported to be expressed in astrocytes, but mGluR5 is much more frequently encountered (38). At present, there are no reports of Homer, Shank, or tamalin expression in astrocytes, suggesting that NHERF-2 might be specifically involved in astrocytic mGluR5 physiology.
Astrocytic mGluR5 expression is more abundant during development and up-regulated in injury and disease (39–47). Because we found that overexpression of mGluR5 and NHERF-2 induces cell death, it is conceivable that up-regulation of the receptor might be especially toxic in astrocytes because of interaction with astrocytic NHERF-2, which is capable of prolonging mGluR5-mediated Ca2+ responses. Conversely, the toxic effects of high mGluR5 expression may be reduced by the interaction of the receptor with Homer proteins, which have previously been shown to enhance cell survival by recruiting PI3 kinase enhancer (PIKE) (48). Thus, depending on the relative expression levels of its various binding partners in a given cell type, mGluR5 may differentially regulate cell death versus cell survival.
In conclusion, the scaffold protein NHERF-2 specifically interacts with mGluR5 and regulates the Ca2+ signaling of the receptor. Both mGluR5 and NHERF-2 are found in populations of astrocytes and neurons in the central nervous system, and their interaction may play a key role in the regulation of cellular responses to glutamate. Because mGluRs are targets of great interest in the treatment of a variety of different disorders (1–3), and since PDZ interactions are amenable to disruption by small molecules (49), the mGluR5/NHERF-2 interaction and other mGluR/PDZ associations are intriguing therapeutic targets in the future treatment of various CNS pathologies.
Acknowledgments
We thank Anna Goldschmidt, Antoine Almonte, and Jean-François Paré for their technical assistance and advice. Equipment used in the Ca2+ imaging experiments was purchased through National Alliance for Research on Schizophrenia and Depression (NARSAD) funds.
Footnotes
This work was supported in part by National Institutes of Health grants (to R. A. H., Y. S., S. F.T., and C. C. Y.), a W. M. Keck Foundation award (to R. A. H.), and an National Institutes of Health base grant to the Yerkes Primate Center.
The abbreviations used are: mGluR, metabotropic glutamate receptor; PDZ, PSD-95/Discs-large/ZO-1 homology; NHERF, Na-/H- exchanger regulatory factor; IP3, inositol 1,4,5-phosphate; LDH, lactate dehydrogenase; GST, glutathione S-transferase; GFP, green fluorescent protein; CT, C terminus; WT, wild-type; HA, hemagglutinin; HEK, human embryonic kidney; DMEM, Dulbecco’s modified Eagle’s medium; NHERF, Na-/H- exchanger regulatory factor 2.
References
- 1.Bear MF, Huber KM, Warren ST. Trends Neurosci. 2004;27:370–377. doi: 10.1016/j.tins.2004.04.009. [DOI] [PubMed] [Google Scholar]
- 2.Kew JN. Pharmacol Ther. 2004;104:233–244. doi: 10.1016/j.pharmthera.2004.08.010. [DOI] [PubMed] [Google Scholar]
- 3.Moghaddam B. Psychopharmacology (Berl) 2004;174:39–44. doi: 10.1007/s00213-004-1792-z. [DOI] [PubMed] [Google Scholar]
- 4.Conn PJ, Pin JP. Annu Rev Pharmacol Toxicol. 1997;37:205–237. doi: 10.1146/annurev.pharmtox.37.1.205. [DOI] [PubMed] [Google Scholar]
- 5.Hermans E, Challiss RA. Biochem J. 2001;359:465–484. doi: 10.1042/0264-6021:3590465. [DOI] [PMC free article] [PubMed] [Google Scholar]
- 6.Valenti O, Conn PJ, Marino MJ. J Cell Physiol. 2002;191:125–137. doi: 10.1002/jcp.10081. [DOI] [PubMed] [Google Scholar]
- 7.Joly C, Gomeza J, Brabet I, Curry K, Bockaert J, Pin JP. J Neurosci. 1995;15:3970–3981. doi: 10.1523/JNEUROSCI.15-05-03970.1995. [DOI] [PMC free article] [PubMed] [Google Scholar]
- 8.Ango F, Prezeau L, Muller T, Tu JC, Xiao B, Worley PF, Pin JP, Bockaert J, Fagni L. Nature. 2001;411:962–965. doi: 10.1038/35082096. [DOI] [PubMed] [Google Scholar]
- 9.Fagni L, Ango F, Perroy J, Bockaert J. Semin Cell Dev Biol. 2004;15:289–298. doi: 10.1016/j.semcdb.2003.12.018. [DOI] [PubMed] [Google Scholar]
- 10.Hung AY, Sheng M. J Biol Chem. 2002;277:5699–5702. doi: 10.1074/jbc.R100065200. [DOI] [PubMed] [Google Scholar]
- 11.Sheng M, Sala C. Annu Rev Neurosci. 2001;24:1–29. doi: 10.1146/annurev.neuro.24.1.1. [DOI] [PubMed] [Google Scholar]
- 12.Tu JC, Xiao B, Naisbitt S, Yuan JP, Petralia RS, Brakeman P, Doan A, Aakalu VK, Lanahan AA, Sheng M, Worley PF. Neuron. 1999;23:583–592. doi: 10.1016/s0896-6273(00)80810-7. [DOI] [PubMed] [Google Scholar]
- 13.Kitano J, Kimura K, Yamazaki Y, Soda T, Shigemoto R, Nakajima Y, Nakanishi S. J Neurosci. 2002;22:1280–1289. doi: 10.1523/JNEUROSCI.22-04-01280.2002. [DOI] [PMC free article] [PubMed] [Google Scholar]
- 14.Fam SR, Paquet M, Castleberry AM, Oller H, Lee CJ, Traynelis SF, Smith Y, Yun CC, Hall RA. Proc Natl Acad Sci U S A. 2005;102:8042–8047. doi: 10.1073/pnas.0408818102. [DOI] [PMC free article] [PubMed] [Google Scholar]
- 15.He J, Bellini M, Inuzuka H, Xu J, Xiong Y, Yang X, Castleberry AM, Hall RA. J Biol Chem. 2006;281:2820–2827. doi: 10.1074/jbc.M509503200. [DOI] [PubMed] [Google Scholar]
- 16.Lau AG, Hall RA. Biochemistry. 2001;40:8572–8580. doi: 10.1021/bi0103516. [DOI] [PubMed] [Google Scholar]
- 17.Yun CH, Lamprecht G, Forster DV, Sidor A. J Biol Chem. 1998;273:25856–25863. doi: 10.1074/jbc.273.40.25856. [DOI] [PubMed] [Google Scholar]
- 18.Paquet M, Kuwajima M, Yun CC, Smith Y, Hall RA. J Comp Neurol. 2006;494:752–762. doi: 10.1002/cne.20854. [DOI] [PMC free article] [PubMed] [Google Scholar]
- 19.Pagano A, Ruegg D, Litschig S, Stoehr N, Stierlin C, Heinrich M, Floersheim P, Prezeau L, Carroll F, Pin JP, Cambria A, Vranesic I, Flor PJ, Gasparini F, Kuhn R. J Biol Chem. 2000;275:33750–33758. doi: 10.1074/jbc.M006230200. [DOI] [PubMed] [Google Scholar]
- 20.Martin M, Albasanz JL, Fernandez M, Ros M. Biochim Biophys Acta. 1998;1393:186–192. doi: 10.1016/s0005-2760(98)00036-8. [DOI] [PubMed] [Google Scholar]
- 21.Luis Albasanz J, Fernandez M, Martin M. Brain Res Mol Brain Res. 2002;99:54–66. doi: 10.1016/s0169-328x(02)00103-1. [DOI] [PubMed] [Google Scholar]
- 22.Kawabata S, Tsutsumi R, Kohara A, Yamaguchi T, Nakanishi S, Okada M. Nature. 1996;383:89–92. doi: 10.1038/383089a0. [DOI] [PubMed] [Google Scholar]
- 23.Sheng M, Kim E. J Cell Sci. 2000;113:1851–1856. doi: 10.1242/jcs.113.11.1851. [DOI] [PubMed] [Google Scholar]
- 24.Yun CH, Oh S, Zizak M, Steplock D, Tsao S, Tse CM, Weinman EJ, Donowitz M. Proc Natl Acad Sci U S A. 1997;94:3010–3015. doi: 10.1073/pnas.94.7.3010. [DOI] [PMC free article] [PubMed] [Google Scholar]
- 25.Nguyen R, Reczek D, Bretscher A. J Biol Chem. 2001;276:7621–7629. doi: 10.1074/jbc.M006708200. [DOI] [PubMed] [Google Scholar]
- 26.Fouassier L, Yun CC, Fitz JG, Doctor RB. J Biol Chem. 2000;275:25039–25045. doi: 10.1074/jbc.C000092200. [DOI] [PubMed] [Google Scholar]
- 27.Maudsley S, Zamah AM, Rahman N, Blitzer JT, Luttrell LM, Lefkowitz RJ, Hall RA. Mol Cell Biol. 2000;20:8352–8363. doi: 10.1128/mcb.20.22.8352-8363.2000. [DOI] [PMC free article] [PubMed] [Google Scholar]
- 28.Shenolikar S, Minkoff CM, Steplock DA, Evangelista C, Liu M, Weinman EJ. FEBS Lett. 2001;489:233–236. doi: 10.1016/s0014-5793(01)02109-3. [DOI] [PubMed] [Google Scholar]
- 29.Hwang JI, Heo K, Shin KJ, Kim E, Yun C, Ryu SH, Shin HS, Suh PG. J Biol Chem. 2000;275:16632–16637. doi: 10.1074/jbc.M001410200. [DOI] [PubMed] [Google Scholar]
- 30.Lee-Kwon W, Kim JH, Choi JW, Kawano K, Cha B, Dartt DA, Zoukhri D, Donowitz M. Am J Physiol Cell Physiol. 2003;285:C1527–C1536. doi: 10.1152/ajpcell.00017.2003. [DOI] [PubMed] [Google Scholar]
- 31.Lee-Kwon W, Wade JB, Zhang Z, Pallone TL, Weinman EJ. Am J Physiol Cell Physiol. 2005;288:C942–C949. doi: 10.1152/ajpcell.00417.2004. [DOI] [PubMed] [Google Scholar]
- 32.Rochdi MD, Parent JL. J Biol Chem. 2003;278:17827–17837. doi: 10.1074/jbc.M210319200. [DOI] [PubMed] [Google Scholar]
- 33.Hwang JI, Kim HS, Lee JR, Kim E, Ryu SH, Suh PG. J Biol Chem. 2005;280:12467–12473. doi: 10.1074/jbc.M410740200. [DOI] [PubMed] [Google Scholar]
- 34.Sala C, Roussignol G, Meldolesi J, Fagni L. J Neurosci. 2005;25:4587–4592. doi: 10.1523/JNEUROSCI.4822-04.2005. [DOI] [PMC free article] [PubMed] [Google Scholar]
- 35.Tu JC, Xiao B, Yuan JP, Lanahan AA, Leoffert K, Li M, Linden DJ, Worley PF. Neuron. 1998;21:717–726. doi: 10.1016/s0896-6273(00)80589-9. [DOI] [PubMed] [Google Scholar]
- 36.Xiao B, Tu JC, Petralia RS, Yuan JP, Doan A, Breder CD, Ruggiero A, Lanahan AA, Wenthold RJ, Worley PF. Neuron. 1998;21:707–716. doi: 10.1016/s0896-6273(00)80588-7. [DOI] [PubMed] [Google Scholar]
- 37.Smith Y, Charara A, Paquet M, Kieval JZ, Pare JF, Hanson JE, Hubert GW, Kuwajima M, Levey AI. J Chem Neuroanat. 2001;22:13–42. doi: 10.1016/s0891-0618(01)00098-9. [DOI] [PubMed] [Google Scholar]
- 38.Schools GP, Kimelberg HK. J Neurosci Res. 1999;58:533–543. doi: 10.1002/(sici)1097-4547(19991115)58:4<533::aid-jnr6>3.0.co;2-g. [DOI] [PubMed] [Google Scholar]
- 39.Aronica E, van Vliet EA, Mayboroda OA, Troost D, da Silva FH, Gorter JA. Eur J Neurosci. 2000;12:2333–2344. doi: 10.1046/j.1460-9568.2000.00131.x. [DOI] [PubMed] [Google Scholar]
- 40.Cai Z, Schools GP, Kimelberg HK. Glia. 2000;29:70–80. doi: 10.1002/(sici)1098-1136(20000101)29:1<70::aid-glia7>3.0.co;2-v. [DOI] [PubMed] [Google Scholar]
- 41.Ulas J, Satou T, Ivins KJ, Kesslak JP, Cotman CW, Balazs R. Glia. 2000;30:352–361. [PubMed] [Google Scholar]
- 42.Aronica E, Catania MV, Geurts J, Yankaya B, Troost D. Neuroscience. 2001;105:509–520. doi: 10.1016/s0306-4522(01)00181-6. [DOI] [PubMed] [Google Scholar]
- 43.Ferraguti F, Corti C, Valerio E, Mion S, Xuereb J. Exp Brain Res. 2001;137:1–11. doi: 10.1007/s002210000633. [DOI] [PubMed] [Google Scholar]
- 44.Aronica E, Gorter JA, Jansen GH, van Veelen CW, van Rijen PC, Ramkema M, Troost D. Epilepsia. 2003;44:785–795. doi: 10.1046/j.1528-1157.2003.54802.x. [DOI] [PubMed] [Google Scholar]
- 45.Geurts JJ, Wolswijk G, Bo L, van der Valk P, Polman CH, Troost D, Aronica E. Brain. 2003;126:1755–1766. doi: 10.1093/brain/awg179. [DOI] [PubMed] [Google Scholar]
- 46.Hubert GW, Smith Y. J Comp Neurol. 2004;475:95–106. doi: 10.1002/cne.20163. [DOI] [PubMed] [Google Scholar]
- 47.Gwak YS, Hulsebosch CE. Exp Neurol. 2005;195:236–243. doi: 10.1016/j.expneurol.2005.05.012. [DOI] [PubMed] [Google Scholar]
- 48.Rong R, Ahn JY, Huang H, Nagata E, Kalman D, Kapp JA, Tu J, Worley PF, Snyder SH, Ye K. Nat Neurosci. 2003;6:1153–1161. doi: 10.1038/nn1134. [DOI] [PubMed] [Google Scholar]
- 49.Dev KK. Nat Rev Drug Discov. 2004;3:1047–1056. doi: 10.1038/nrd1578. [DOI] [PubMed] [Google Scholar]