Abstract
Mitofusin 2 (Mfn2), a mitochondrial protein, has been shown to have anti-proliferative properties when overexpressed. In this report we have shown that activation of resting human peripheral blood T cells caused downregulation of Mfn2 levels. This downregulation of Mfn2 was blocked by different inhibitors (mTOR inhibitor Rapamycin, PI3K inhibitor LY294002, and Akt inhibitor A443654), producing cells that were arrested in the G0/G1 stage of the cell cycle. Furthermore, the activation-induced downregulation of Mfn2 preceded the entry of the cells into the cell cycle, suggesting that Mfn2 downregulation is a prerequisite for activated T cells’ entry into the cell cycle. Accordingly, siRNA-mediated knockdown of Mfn2 resulted in increased T cell proliferation. Over-expression of constitutively active AKT resulted in the downregulation of Mfn2, which can be blocked by a proteasome inhibitor. Akt-mediated downregulation of Mfn2 was via the mTORC1 pathway since (i) this downregulation was blocked by rapamycin, and (ii) over-expression of wild type, but not kinase-dead mTOR, caused Mfn2 downregulation. Our data suggested that activation-induced reactive oxygen species (ROS) production plays an important role in downregulation of Mfn2. Collectively, our data suggest that the PI3K-AKT-mTOR pathway plays an important role in activation-induced downregulation of Mfn2 and subsequent proliferation of resting human T cells.
Introduction
Protein degradation regulates a number of cellular processes (1), including cell proliferation. Dysregulation of this process may lead to the development of hyperplasia-related diseases and cancers. Mitofusin2 is a protein that localizes to the mitochondrial outer membrane and has an essential role in mitochondrial fusion, thus regulating mitochondrial morphology and function in mammalian cells, yeast and flies (2, 3). Dysfunction of this gene is associated with a variety of pathological conditions including Charcot–Marie–Tooth (CMT) disease type 2A, atherosclerosis and hypertension (4-8). Our previous studies using an overexpression system mediated by adenoviral infection in vascular smooth muscle cells (VSMC) and various cancer cell lines demonstrated that Mfn2 plays a major role in controlling cell proliferation and induces apoptosis both in vitro and in vivo via the Ras-Raf-ERK1/2 and PI3K-Akt signaling pathways, respectively (9, 10). These data led us to hypothesize that destabilization of this protein may lead to hyperproliferation of cells. In accordance with this hypothesis, we have observed a significant rise in cell proliferation in mouse embryonic fibroblast (MEF) cells from Mfn2 knockout mice as compared to MEFs from wild type mice. This proliferative advantage was reversed upon reintroduction of the Mfn2 gene (11). In this report, we have shown that in human peripheral blood T cells, activation-induced downregulation of endogenous Mfn2 preceded the entry of the cells into the cell cycle. Blocking the downregulation of Mfn2 with pharmacological agents resulted in the failure of cells to enter the cell cycle and inhibition of proliferation. Here we explore the mechanism underlying the activation-induced downregulation of Mfn2 protein. Collectively, our observations suggested that the PI3K-AKT-mTOR pathway plays an important role in the activation-induced proteosomal degradation of Mfn2 protein.
Material and Methods
Cells and tissue cultures
Peripheral blood mononuclear cells (PBMC) were collected from healthy donors who provided written informed consent. The collection of blood from normal donors is part of a protocol (03-AG-N316) approved by the IRB of the National Institute on Aging. PBMC were isolated by Ficoll-Hypaque density gradient centrifugation. Total resting T cells were purified from PBMC with the Human T-cell Enrichment Column Kit (R&D Systems). Cells were cultured in RPMI 1640 supplemented with 10% fetal bovine serum (FBS, Gibco Life Technologies, Rockville, MD), 100 U/ml penicillin, 100 μg/ml streptomycin, and 2 mM glutamine. T cells activated with plastic bound anti-CD3 (200 ng/ml) plus anti-CD28 antibodies (1 μg/ml) were treated with or without different inhibitors for 48 hours. HEK 293A cells were cultured in Dulbecco’s modified Eagle’s medium (DMEM) containing 10% FBS, 100 U/ml penicillin, 100 μg/ml streptomycin, and 2 mM glutamine and passaged every 3 days.
Reagents and antibodies
Unless otherwise indicated, all chemicals were purchased from Sigma-Aldrich. The anti-Mfn2 (M-6444) polyclonal and monoclonal antibodies were purchased from Sigma-Aldrich (Saint Louis, MO) and Abcam (Cambridge, MA), respectively. Anti-mTOR antibody was from Santa Cruz Biotechnology (Santa Cruz, CA). A-443654 was from Abbott Laboratories (Abbott Park, Illinois), LY294002 was from Cell Signaling (Beverly, MA), rapamycin from Calbiochem (San Diego, CA), PI/RNase Staining Buffer was from BD Biosciences (San Diego, CA). The anti-Flag monoclonal antibody M2 was from Sigma-Aldrich. Anti-Mouse/Rat Ki-67 eFluor450 was purchased from eBioscience (San Diego, CA). MitoQ was a generous gift from Dr. Mike Murphy (MRC Mitochondrial Biology Unit, Wellcome Trust, Cambridge, UK).
Western blot and immunoprecipitation
Whole cell lysates were prepared as described previously (9). For Western blot analysis, 25 μg of cell lysates were analyzed on 4-12% NuPAGE gels (Invitrogen). The proteins were electro-transferred to PVDF membrane (Invitrogen) and detection of specific proteins was carried out with indicated antibodies and ECL-Plus Western Blotting Detection System (GE Healthcare, Piscataway, NJ).
siRNA Transfection
2×10⁶ T cells were transfected using the Nepa Gene Super Electroporator NEPA21 Type II (Bulldog Bio) in Optimem media (Life Technologies). 10 μg of either Negative Control All Stars siRNA or Flexitube Mfn2 siRNA (Qiagen) was used per transfection in 100μl of Optimem. 10 cuvettes were used per group, and these cells were pooled in 5 ml of complete RPMI and incubated overnight in a 5% CO2, 37°C incubator. After 24 hours, the cells were activated using anti-CD3/anti-CD28 antibodies (BD Biosciences) coated in a polystyrene flask and incubated for an additional 3 days before harvesting cells for either Ki-67 staining or Western blot analysis.
Cloning and constructs
Human Mfn21-757 was generated by PCR using the forward primer (primer1) containing BamHI site 5’-ATGACGGATCCTCCCTGCTCTTCTCT CGATGCAACTCTATCG-3’ and the reverse primer (primer2) containing XhoI site 5’-CCCCCCCTCGAGTCTGCTGGGCTG CAGGT ACTGGT-3’, Mfn21-450 was regenerated with the primer1 and the reverse primer with XhoI site5’-CCCCCCCTCGAGCATCTGG TAATCGTCCACC AGTACA -3’, Mfn2451-757 was generated with the forward primer containing BamHI site5’-GATGACGGATCCGACTTC CACCCTTCTCCAGTAGT CCT-3’ and paired with primer2. All the PCR products were first digested with BamHI and Xho1 and cloned into pCMV-3Tag-1A (Agilent Technologies, CA). pUSE, WT-Akt and CA-Akt plasmids were purchased from Upstate Biotechnology (Lake Placid, NY). The expression vectors for S6K1 and S6K2, and the respective vectors were generous gifts from Dr. John Blenis (Harvard Medical School, Boston, MA). The mTOR expression vectors were generous gifts from Dr. Jie Chen (University of Illinois at Urbana-Champaign, Urbana, IL).
Semi-quantitative RT-QPCR
Total cellular RNA was isolated using the RNeasy kit (Qiagen), and cDNA was generated using VILO cDNA synthesis kit (Invitrogen). Semi-quantitative real-time PCR was performed as previously described (12). The primer sequences for Mfn2 are: 5’-CTGCTAAGGAGGTG CTCAA-3’ (forward) and 5’-TCCTCACTTGAAAGCCTTCTGC-3’ (reverse). The sequences of primers for 18S rRNA internal control are:5’-GTAACCC GTTGAACCCCATT-3’ (forward) and 5’-CCATCCAATCGGTAGTAGCG-3’ (reverse).
Cell cycle analysis
2 × 10⁶ resting T cells were activated as described in “Cells and tissue cultures” in the presence or absence of inhibitors for different periods of time. Cells were harvested, resuspended in 300 μl 1X phosphate-buffered saline (PBS) and fixed in 70% ethanol. The fixed cells were washed again with PBS twice and treated with 500 μL of PI/RNase Staining Buffer in the dark for 1 h at room temperature. The samples were analyzed by flow cytometry using a fluorescence-activated cell sorter manufactured by BD Biosciences (San Jose, CA).
Measurement of ROS
Measurement of CD3/CD28-induced ROS was performed as described by the protocol provided by the manufacturer (Enzo Life Science, Farmingdale, NY). Briefly, activated cells were washed twice with cold PBS and incubated with the ROS detection reagent for 30 minutes at 37°C. The cells were washed twice with PBS and resuspended in FACS staining buffer (3% fetal bovine serum and 0.01% sodium azide in PBS). The amount of ROS was measured using the CANTO II flow cytometerand analyzed with the FACS DIVA software (BD Bioscience, San Jose, CA). Viable cells were gated and used in the analysis.
Results
Activation-induced downregulation of Mfn2 preceded the cells’ entry into the cell cycle
To determine the status of endogenous Mfn2 level during T cell activation, the resting human peripheral blood T cells were activated for 30 hr by plate-bound α-CD3 and α-CD28 antibodies. As shown in Figure 1A, Mfn2 expression was downregulated after 30 h of activation compared to the resting cells. Interestingly, the expression of Mfn1, a protein highly homologous to Mfn2 (13), was increased during activation. We have shown previously that the downregulation of Mfn2 is associated with an increase in cellular proliferation (11); hence, we examined whether the downregulation of Mfn2 preceded the cells’ entry into the cell cycle. Primary human T cells were activated for 24, 30 and 36 h and cell cycle analyses were carried out along with western blot analysis to check the level of Mfn2 expression. As shown in Figure 1B, a decrease in the Mfn2 level was observed following 24 h of activation and continued through 36 h. The cell cycle analyses indicated that after 24 h of activation, the cells remained in G0/G1 phase and began to enter the cell cycle after 30 h. By 36 h of activation a significant percentage of cells had entered into the cell cycle. The activation-induced decrease in Mfn2 level was blocked by rapamycin and resulted in the blockage of the cells’ entry into the cell cycle. This result suggested that a decrease in the expression of Mfn2 is a prerequisite for the entry of cells into the cell cycle. We also analyzed the level of Mfn2 protein in proliferating cells at different time points. Activated T cells can be expanded in culture for up to two weeks in the presence of low dose of IL-2 (10 units/ml). Cells then slow down their proliferation and stop growing completely around day 20. We analyzed the protein level of Mfn2 in cells collected from different stages of proliferation. As shown in Figure 1C, the early decrease in Mfn2 level (at days 5 and 6 in two independent donors) was reversed over time and levels returned to those of resting levels at day 16 and 17, coinciding with the time that cells slowed their rate of proliferation. To determine if the decrease in the level of Mfn2 expression is due to a decline in the mRNA levels, T cells were activated by plate-bound α-CD3 and α-CD28 antibodies for different time periods and the mRNA expression of Mfn2 was examined using real-time PCR. As shown in the Supplemental Figure 1, no significant difference in the expression of Mfn2 mRNA was observed in T cells activated for different periods of time.
FIGURE 1.
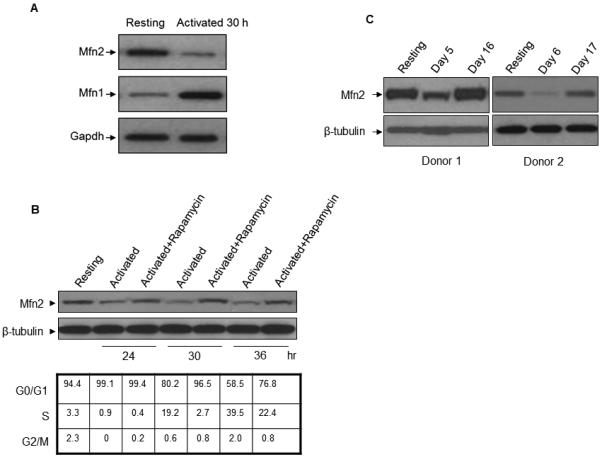
Activation-induced down regulation of Mfn2 preceded the cells’ entry into the cell cycle. (A) Primary human T-cells treated with or without α-CD3/α-CD28 antibodies for 30 hrs. Whole cell lysates were prepared, and an equal amount of lysates (25 µg) were analyzed by western blot analysis. One representative experiment out of five is shown here. (B) Cell cycle distribution and expression of Mfn2 in primary human T cells treated with α-CD3 and α-CD28 antibodies alone or in combination with rapamycin (20 ng/ml) for 24, 30, and 36 h. 25µg of whole cell lysates were analyzed by western blot analysis. One out of three independent experiments is shown here. (C) Early activation-induced down regulation of Mfn2 was reversed after prolonged proliferation. Primary human T cells were activated with or without αCD3 and αCD28 antibodies for 48 hrs. Cells were then cultured for either 5 or 6 days, or for extended periods (16 or 17 days) in the presence of IL-2. Whole cell lysates were prepared, and an equal amount of lysates (25 µg) were analyzed by western blot analysis.
To test whether or not the blockage in downregulation of the Mfn2 level after rapamycin treatment was a general consequence of inhibition of cell cycle progression, the peripheral blood T cells were activated for 48 h by plate-bound α-CD3 and α-CD28 antibodies in the presence or absence of different pharmacological inhibitors: rapamycin, an mTOR inhibitor; LY294002, a PI3 kinase inhibitor (14); and A443654, an Akt inhibitor. As shown in Figure 2A, Mfn2 expression was downregulated after 48 h of activation compared to the resting cells. Interestingly all these inhibitors not only blocked the cells at the G0/G1 phase but also successfully blocked the downregulation of Mfn2 protein. The blockage of the activated cells at the G0/G1 phase of the cell cycle by rapamycin was also verified by the BrdU incorporation assay. As shown in the Supplemental Figure 2, rapamycin pretreatment blocked the activation-induced BrdU incorporation. To further evaluate whether blocking cell cycle progression played a role in regulating Mfn2 levels, we used agents that interfere with cell cycle progression in different phases of the cell cycle. We noted that the S-phase and G2/M phase blockers aphidicolin and nocodazole, respectively, failed to block the downregulation of Mfn2, whereas they successfully blocked the cell cycle at S- and G2/M phases, respectively (Figure 2B). If Mfn2 is a blocker to the cell cycle entry, knockdown of Mfn2 should increase cell proliferation. To investigate this, primary T cells were transfected with either Mfn2 specific siRNA or non-specific siRNA and the degree of proliferation was measured by Ki-67 staining, since the status of Ki-67 antigen strictly correlates with the proliferative status of the cells (15). As shown in Figure 2C, downregulation of Mfn2 resulted in higher T-cell proliferation. Knock down of Mfn2 in primary human T cells did not cause any cell death as shown in the Supplemental Figure 3A. The effect of Mfn2 knock down on T-cell proliferation was also verified by Cell Proliferation Dye (CPD) dilution experiment. As shown in the Supplemental Figure 3B, knock down of Mfn2 resulted in the faster proliferation of T cells. These results taken together suggested that a decrease in the expression of Mfn2 is a prerequisite for the cell’s entry into the cell cycle; however, once the cells pass the G1 checkpoint, cell cycle blockers acting at later stages (S and G2/M) have no effect on Mfn2 levels.
FIGURE 2.
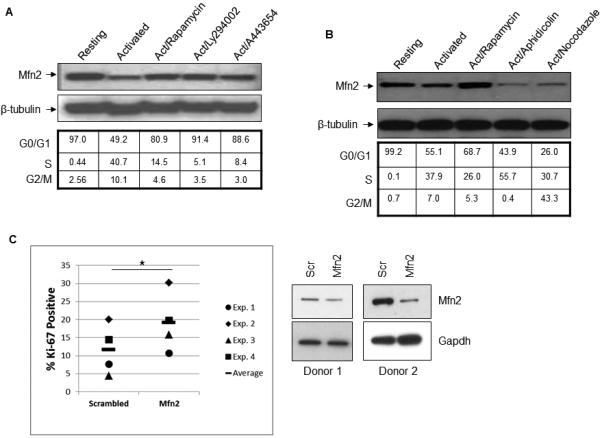
Activation-induced Mfn2 downregulation is a prerequisite for activated T cells’ entry into the cell cycle. (A) Cell cycle distribution and expression of Mfn2 in resting primary human T cells, and T cells treated with α-CD3 and α-CD28 antibodies alone or in combination with indicated inhibitors: rapamycin (20 ng/ml), LY294002 (25 mM), and A443654 (0.5 μM) for 48 hours. One representative experiment out of three experiments is shown here. (B) Cells were treated α-CD3/α-CD28 alone or in combination with rapamycin (20 ng/ml), aphidicolin (1 µM), and nocodazole (25 ng/ml) for 48 hours. 25µg of protein from the whole cell lysates were analyzed by western blot analysis in (A) and (B). One representative experiment out of two experiments is shown here. (C) Primary human T cells were transfected with either scrambled siRNA (Scrambled) or Mfn2-specific siRNA (Mfn2) by electroporation. After 24 hour, cells were activated by αCD3 and αCD28 for 72 hours, stained with anti-Ki-67 antibody and analyzed by flow cytometry gated on live cell populations. Left panel shows the Ki-67 staining of siRNA experiments from four independent donors, and the right panel shows the effect of siRNA on Mfn2 levels in two independent donors. * p<0.05, two-tailed Student’s t-test.
Involvement of Akt in downregulation of Mfn2 protein
Since the inhibitors for PI3K, Akt, and mTOR successfully blocked the downregulation of Mfn2 and all these inhibitors are known to have inhibitory effects on the PI3K-Akt-mTOR pathway (14, 16-18), we hypothesized a possible role of the PI3K-Akt-mTOR pathway in the downregulation of Mfn2 protein. In order to investigate the role of Akt in the downregulation of Mfn2 protein, HEK293A cells were co-transfected with an Mfn2 plasmid together with either vector alone (pUSE), wild type Akt (WT-Akt), or constitutively active Akt (CA-Akt). As shown in Figure 3A, significant decreases in the levels of both endogenous and exogenous Mfn2 were observed in the cells transfected with CA-Akt plasmid compared to the cells being transfected with either vector alone or WT-AKT, indicating a possible role of Akt in the downregulation of Mfn2 protein.
FIGURE 3.
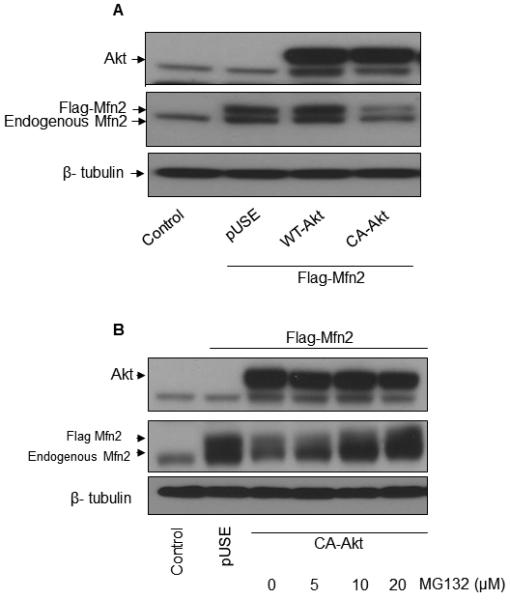
AKT is involved in the downregulation of Mfn2 expression in a proteasome-sensitive manner. (A) HEK293A cells were co-transfected with Flag-tagged Mfn2 and the indicated Akt plasmids. After 24 hours, cell lysates were prepared, and equal amounts of whole cell lysates (25 µg) were analyzed by western blot analysis. One representative experiment out of two experiments is shown here. (B) HEK293A cells were co-transfected with Flag-tagged Mfn2 and CA-Akt for 16 hrs and then treated with indicated concentrations of MG132 for an additional 8 hours. 25 µg of protein from the whole cell lysates were analyzed by western blot analysis. One representative experiment out of two experiments is shown here.
In order to investigate the possibility of the involvement of proteasomes in the Akt-mediated degradation of Mfn2, HEK293A cells were co-transfected with an Mfn2 plasmid together with either vector alone or CA-Akt plasmid. After 16 hr of transfection, cells were treated with increasing doses of the proteasome inhibitor, MG132, for 8h. As shown in Figure 3B, MG132 successfully blocked the Akt-mediated degradation of Mfn2 in a dose-dependent manner indicating the involvement of proteasomes in the Akt-mediated degradation of Mfn2 protein. We also investigated whether proteasomes were involved in the activation-induced downregulation of Mfn2 in primary human T cells. As shown in the Supplemental Figure 4, MG132 successfully blocked the activation-induced downregulation of Mfn2 in a dose-dependent manner, whereas MG132 did not have an effect on Mfn1 levels, indicating the involvement of the proteasome in the downregulation of Mfn2.
C-terminal fragment (amino acid 451-757) of Mfn2 protein is sensitive to Akt-mediated degradation
Next we attempted to determine the region of Mfn2 that is sensitive to Akt mediated degradation. As shown in Figure 4A, Mfn2 protein has an N-terminal p21ras signature motif, a GTP binding domain, two coiled-coil regions, and two transmembrane domains spanning the mitochondrial outer membrane (2, 4, 10). In order to determine which domain in Mfn2 is sensitive to Akt-mediated degradation, we constructed two truncated Flag-tagged constructs of Mfn2: an N-terminal construct (amino acids 1-450) that includes the p21ras signature motif, the GTP binding domain and one coiled-coil region, and a C-terminal construct (amino acids 451-757) that includes two transmembrane domains and one coiled-coil region. The HEK293A cells were co-transfected with either empty vector plasmid, N-terminal fragment or C-terminal fragment plasmid together with the CA-Akt plasmid. Full-length Mfn2 plasmid and CA-Akt plasmids were also co-transfected in HEK293A cells and used as a positive control. As shown in Figure 4B, the N-terminal fragment of Mfn2 protein was found to be resistant to Akt-mediated degradation whereas both the C-terminal fragment and the full length Mfn2 protein were degraded upon CA-Akt overexpression. These results taken together indicated that the C-terminal region of Mfn2 protein is sensitive to Akt-mediated degradation.
FIGURE 4.
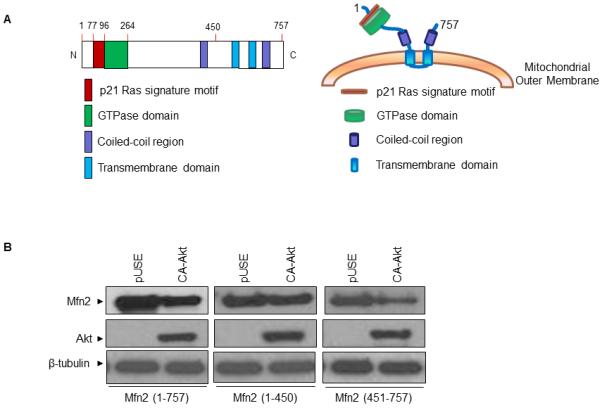
Sensitivity of different Mfn2 fragments towards CA-Akt-mediated degradation. (A) Schematic representation of Mfn2 protein showing different domains. (B) HEK293A cells were co-transfected with different Flag-tagged Mfn2 fragments, N-terminal (aa 1- 450) or C-terminal (aa 451-757), and either with vector alone (pUSE) or CA-Akt plasmid. After 24 hours, whole cell lysates were prepared, and 25 µg of lysates were analyzed by western blot analysis. One representative experiment out of two experiments is shown here.
Rapamycin blocked the Akt-mediated degradation of Mfn2
We were unable to demonstrate that Akt directly phosphorylates Mfn2 (data not shown). Since our earlier results showed a significant inhibition of activation-induced downregulation of Mfn2 by rapamycin, we hypothesized that Akt may be involved in the activation of mTOR through the mTORC1 pathway resulting in the phosphorylation and degradation of Mfn2. In order to investigate this possibility, HEK293A cells were transfected with Flag-tagged Mfn2 along with either empty vector or CA-Akt in the presence or absence of two concentrations of rapamycin. After 36 hours, whole cell lysates were prepared and analyzed by western blot analysis. As shown in Figure 5A, rapamycin blocked the degradation of Mfn2 in a dose-dependent manner, indicating the possible involvement of the mTORC1 pathway in Akt-induced degradation of Mfn2. In order to confirm the involvement of mTOR in the degradation of Mfn2, Mfn2 was overexpressed together with either a wild type (WT-mTOR) or a kinase-dead mTOR (KD-mTOR) plasmid. As shown in Figure 5B, cells transfected with a WT-mTOR plasmid showed a significant decrease in the Mfn2 level as compared to the cells transfected with either a KD-mTOR or the empty vector control. Furthermore, mTOR-mediated degradation of Mfn2 protein was blocked by rapamycin in a dose-dependent manner (Figure 5C).
FIGURE 5.
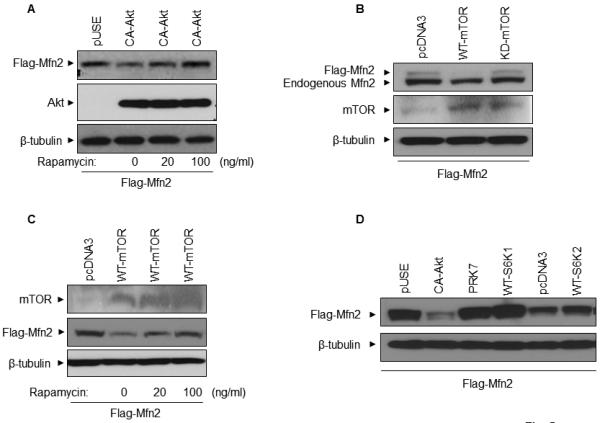
mTOR, but not p70S6K1 or p70S6K2, is involved in the degradation of Mfn2 protein. (A) HEK293A cells were co-transfected either empty vector (pUSE) or CA-Akt plasmids together with flag-tagged Mfn2 plasmid, with or without pretreatment with 20ng/ml and 100ng/ml of rapamycin. (B) HEK293A cells were co-transfected with empty vector (pCDNA3), WT-mTOR plasmid, or KD-mTOR plasmids together with flag-tagged Mfn2 plasmid. (C) HEK293A cells were co-transfected with either empty vector (pCDNA3), WT-mTOR plasmids together with flag-tagged Mfn2 plasmid, with or without pretreatment of 20ng/ml and 100ng/ml of rapamycin. (D) HEK293A cells were co-transfected with either empty vector plasmids (pUSE, PRK7, or pcDNA3), WT-S6K1 plasmid or WT-S6K2 plasmid together with Flag-tagged Mfn2 plasmid. After 24 hours, whole cell lysates were prepared and 25 µg of protein from the whole cell lysates were analyzed by western blot analysis in (A), (B), (C) and (D). One representative experiment out of two experiments for each panel is shown here.
Since ribosomal S6 kinases 1 (S6K1) and 2 (S6K2) are well-known downstream mTOR effector molecules (19, 20), it is possible that our observed mTOR-mediated degradation of Mfn2 occurred via either S6K1 or S6K2. To test that possibility, we co-transfected HEK293A cells with Mfn2 plasmid together with either empty vector plasmid, WT-S6K1, or WT-S6K2 plasmid. As shown in Figure 5D, both S6K1 and S6K2 failed to degrade Mfn2, thus ruling out the possible role of S6 kinases in the degradation of Mfn2 protein. Next, we wanted to determine whether mTOR is able to phosphorylate Mfn2 directly in an in vitro kinase assay. We were unable to demonstrate the direct involvement of mTOR in the phosphorylation of Mfn2 (data not shown). Collectively, our results indicated a possible involvement of mTOR, but not downstream effector molecules S6K1/2, in a pathway responsible for the degradation of Mfn2 protein.
Activation-induced mitochondrial ROS was involved in Mfn2 degradation
It has been shown recently that activated T-cell-induced reactive oxygen species (ROS) play an important role in T-cell activation (21). To investigate whether ROS is involved in the activation-induced degradation of Mfn2, we first determined the status of ROS production after T-cell activation in the presence or absence of rapamycin or MitoQ, a mitochondrial electron transport chain complex III inhibitor. As shown in Fig. 6A, activation-induced ROS production was sensitive to both rapamycin and MitoQ. Interestingly, both rapamycin and MitoQ blocked activation-induced Mfn2 degradation (Fig. 6B), indicating the involvement of mitochondrial ROS in the Mfn2 degradation process. Since mitochondrial ROS has been shown to be involved in T-cell activation, we wanted to verify that the blockage in Mfn2 degradation by MitoQ was not due to the blockage in T-cell activation. As shown in Fig. 6B (middle panel), activation-induced phosphorylation of ribosomal protein S6 was not affected by MitoQ, whereas S6 phosphorylation was affected by rapamycin as expected. Collectively, our data suggested that activation-induced Mfn2 degradation involved ROS-mediated activation of some kinase(s) followed by Mfn2 phosphorylation and the subsequent degradation via proteasome.
FIGURE 6.
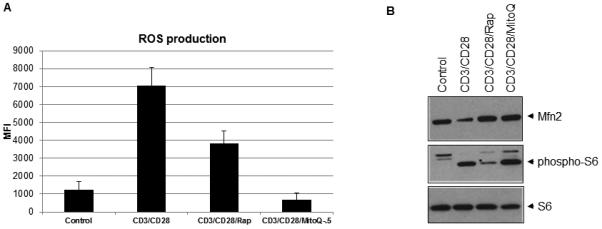
Activation-induced ROS is involved in the downregulation of Mfn2. (A) Human peripheral blood T cells were activated by α-CD3/α-CD28 antibodies in the presence or absence of either rapamycin (20 ng/ml) or MitoQ (0.5 µM) for 48 hours. ROS was measured as described in the Experimental Procedures. (B) T cells were treated as in (A), and whole cell lysates were analyzed by western blot analysis. For panel A, average result from three independent experiments is shown. For panel B, one representative experiment out of two experiments is shown here.
Discussion
We have shown previously that balloon denudation induces medial vascular smooth muscle cell (VSMC) proliferation and downregulation of Mfn2 expression in these cells (9), suggesting that Mfn2 expression is inversely related to the proliferative status of cells. Also, we have shown recently that the overexpression of Mfn2 caused inhibition of cellular proliferation (11). To investigate the functional linkage between Mfn2 and growth regulation, in the present study, we have demonstrated that the activation-induced downregulation of Mfn2 in human peripheral blood T cells preceded the cells’ entry into the cell cycle, and the blockage of this Mfn2 degradation by several pharmacological inhibitors resulted in preventing the cells’ entry into the cell cycle. Interestingly, late stage cell cycle blockers (aphidicolin for S phase, and nocodazole for G2/M) did not affect the Mfn2 degradation. Moreover, knockdown of Mfn2 by siRNA resulted in increased T-cell proliferation. Collectively, these data suggested: (i) the activation-induced Mfn2 degradation is a prerequisite for resting peripheral blood T cells’ entry into the cell cycle, and (ii) the activation-induced downregulation of Mfn2 cannot be reversed once cells enter into the cell cycle. The activation-induced upregulation of Mfn1 levels (Fig. 1A) is an interesting finding, but this phenomenon is not associated with the Mfn2-mediated blockage of T cell proliferation for the following reasons: first, siRNA knockdown of Mfn2 does not affect the activation-induced upregulation of Mfn1 levels (data not shown), while this knockdown increases T cell proliferation; and second, rapamycin pretreatment blocks the activation-induced Mfn2 downregulation and blocks T cell proliferation (Fig. 1B), while rapamycin pretreatment does not affect the activation-induced upregulation of Mfn1 (data not shown). We are currently investigating the role of Mfn1 in T cell activation.
The pharmacological inhibitors used in our studies to block Mfn2 degradation are the blockers of the PI3K-Akt-mTOR pathway (14, 16-18), and as it is shown in Figure 3, the overexpression of the myristoylated form of Akt (CA-Akt) in HEK293A cells mimicked the activation-induced degradation of Mfn2 in primary human T cells. These data suggested that either mTORC1 or mTORC2 was involved in Mfn2 degradation. Based on the following observations, we concluded that the mTORC1, but not the mTORC2, pathway is involved in the activation-induced Mfn2 degradation: first, we were unable to demonstrate that Mfn2 was a direct substrate of Akt in an in vitro kinase assay; second, CA-Akt-mediated degradation of Mfn2 was blocked by rapamycin; and third, over-expression of wild type mTOR, but not kinase-dead mTOR, resulted in Mfn2 degradation.
It has been reported that stress-induced phosphorylation of Mfn2 by JNK resulted in the proteasomal degradation of Mfn2 (22). The phosphorylation site identified in this study was Serine 27. With regards to the mechanism of degradation, our study differs from this study in the following ways: first, the stress-induced degradation of Mfn2 is faster as compared to the activation-induced degradation (6 hours versus 24 hours); and second, whereas the N-terminal portion of Mfn2 (Serine 27) was responsible for degradation under stress conditions, the C-terminal fragment of Mfn2 (amino acids 451-757) was sensitive to the activation-induced degradation. The slow kinetics of Mfn2 degradation in human peripheral blood T cells is in agreement with the slower, orderly progression of T cells through the cell cycle. Each phase of the cell cycle requires timely expression of cyclins and cyclin-dependent kinases (CDKs), which form active holoenzymes to carry out phosphorylation of the relevant substrates, such as the retinoblastoma (Rb) gene product (23, 24). Hyperphosphorylation of Rb affects its interaction with the E2F family transcription factors, resulting in the expression of S-phase genes (25-27). The status of active CDKs is also dependent on the specific CDK inhibitors, e.g., p27kip1 (23). An important role of the co-stimulation via the CD28 co-receptor during T-cell activation is to down regulate p27kip1 by proteasomal degradation (28). It has been shown that mitogen activated protein kinase (MAPK) plays an important role in proteasome-mediated degradation of p27kip1(29, 30). Interestingly, we have shown recently that Mfn2 exerts its antiproliferative effects by acting as a Ras effector molecule, resulting in the inhibition of the Ras-Raf-ERK signaling pathway (11). Thus, here we confirm the prediction that the activation-induced Mfn2 degradation is a pre-requisite for the T cells’ entry into the cell cycle.
Supplementary Material
Acknowledgements
We would like to thank the NIA Apheresis Unit and the Clinical Core Laboratory for providing us with human blood from normal donors, and the Flow cytometry Facility at NIA for their help in cell cycle analyses.
This research was supported (in part) by the Intramural Research Program of the NIH, National Institute on Aging.
Footnotes
Disclosures: The authors declare no commercial and financial interests.
References
- 1.Coux O, Tanaka K, Goldberg AL. Structure and functions of the 20S and 26S proteasomes. Annual review of biochemistry. 1996;65:801–847. doi: 10.1146/annurev.bi.65.070196.004101. [DOI] [PubMed] [Google Scholar]
- 2.de Brito OM, Scorrano L. Mitofusin 2 tethers endoplasmic reticulum to mitochondria. Nature. 2008;456:605–610. doi: 10.1038/nature07534. [DOI] [PubMed] [Google Scholar]
- 3.de Brito OM, Scorrano L. Mitofusin-2 regulates mitochondrial and endoplasmic reticulum morphology and tethering: the role of Ras. Mitochondrion. 2009;9:222–226. doi: 10.1016/j.mito.2009.02.005. [DOI] [PubMed] [Google Scholar]
- 4.Zuchner S, Mersiyanova IV, Muglia M, Bissar-Tadmouri N, Rochelle J, Dadali EL, Zappia M, Nelis E, Patitucci A, Senderek J, Parman Y, Evgrafov O, Jonghe PD, Takahashi Y, Tsuji S, Pericak-Vance MA, Quattrone A, Battaloglu E, Polyakov AV, Timmerman V, Schroder JM, Vance JM. Mutations in the mitochondrial GTPase mitofusin 2 cause Charcot-Marie-Tooth neuropathy type 2A. Nat Genet. 2004;36:449–451. doi: 10.1038/ng1341. [DOI] [PubMed] [Google Scholar]
- 5.Misko AL, Sasaki Y, Tuck E, Milbrandt J, Baloh RH. Mitofusin2 mutations disrupt axonal mitochondrial positioning and promote axon degeneration. J Neurosci. 2012;32:4145–4155. doi: 10.1523/JNEUROSCI.6338-11.2012. [DOI] [PMC free article] [PubMed] [Google Scholar]
- 6.Hernandez-Alvarez MI, Thabit H, Burns N, Shah S, Brema I, Hatunic M, Finucane F, Liesa M, Chiellini C, Naon D, Zorzano A, Nolan JJ. Subjects with early-onset type 2 diabetes show defective activation of the skeletal muscle PGC-1{alpha}/Mitofusin-2 regulatory pathway in response to physical activity. Diabetes Care. 2010;33:645–651. doi: 10.2337/dc09-1305. [DOI] [PMC free article] [PubMed] [Google Scholar]
- 7.Pich S, Bach D, Briones P, Liesa M, Camps M, Testar X, Palacin M, Zorzano A. The Charcot-Marie-Tooth type 2A gene product, Mfn2, up-regulates fuel oxidation through expression of OXPHOS system. Hum Mol Genet. 2005;14:1405–1415. doi: 10.1093/hmg/ddi149. [DOI] [PubMed] [Google Scholar]
- 8.Bach D, Pich S, Soriano FX, Vega N, Baumgartner B, Oriola J, Daugaard JR, Lloberas J, Camps M, Zierath JR, Rabasa-Lhoret R, Wallberg-Henriksson H, Laville M, Palacin M, Vidal H, Rivera F, Brand M, Zorzano A. Mitofusin-2 determines mitochondrial network architecture and mitochondrial metabolism. A novel regulatory mechanism altered in obesity. J Biol Chem. 2003;278:17190–17197. doi: 10.1074/jbc.M212754200. [DOI] [PubMed] [Google Scholar]
- 9.Chen KH, Guo X, Ma D, Guo Y, Li Q, Yang D, Li P, Qiu X, Wen S, Xiao RP, Tang J. Dysregulation of HSG triggers vascular proliferative disorders. Nat Cell Biol. 2004;6:872–883. doi: 10.1038/ncb1161. [DOI] [PubMed] [Google Scholar]
- 10.Guo X, Chen KH, Guo Y, Liao H, Tang J, Xiao RP. Mitofusin 2 triggers vascular smooth muscle cell apoptosis via mitochondrial death pathway. Circ Res. 2007;101:1113–1122. doi: 10.1161/CIRCRESAHA.107.157644. [DOI] [PubMed] [Google Scholar]
- 11.Chen KH, Dasgupta A, Ding J, Indig FE, Ghosh P, Longo DL. Role of mitofusin 2 (Mfn2) in controlling cellular proliferation. FASEB J. 2014;28:382–394. doi: 10.1096/fj.13-230037. [DOI] [PMC free article] [PubMed] [Google Scholar]
- 12.Sasaki CY, Barberi TJ, Ghosh P, Longo DL. Phosphorylation of RelA/p65 on serine 536 defines an I{kappa}B{alpha}-independent NF-{kappa}B pathway. J Biol Chem. 2005;280:34538–34547. doi: 10.1074/jbc.M504943200. [DOI] [PubMed] [Google Scholar]
- 13.Rojo M, Legros F, Chateau D, Lombes A. Membrane topology and mitochondrial targeting of mitofusins, ubiquitous mammalian homologs of the transmembrane GTPase Fzo. J Cell Sci. 2002;115:1663–1674. doi: 10.1242/jcs.115.8.1663. [DOI] [PubMed] [Google Scholar]
- 14.Ikezoe T, Nishioka C, Bandobashi K, Yang Y, Kuwayama Y, Adachi Y, Takeuchi T, Koeffler HP, Taguchi H. Longitudinal inhibition of PI3K/Akt/mTOR signaling by LY294002 and rapamycin induces growth arrest of adult T-cell leukemia cells. Leuk Res. 2007;31:673–682. doi: 10.1016/j.leukres.2006.08.001. [DOI] [PubMed] [Google Scholar]
- 15.Scholzen T, Gerdes J. The Ki-67 protein: from the known and the unknown. Journal of cellular physiology. 2000;182:311–322. doi: 10.1002/(SICI)1097-4652(200003)182:3<311::AID-JCP1>3.0.CO;2-9. [DOI] [PubMed] [Google Scholar]
- 16.Cai N, Dai SD, Liu NN, Liu LM, Zhao N, Chen L. PI3K/AKT/mTOR signaling pathway inhibitors in proliferation of retinal pigment epithelial cells. International journal of ophthalmology. 2012;5:675–680. doi: 10.3980/j.issn.2222-3959.2012.06.05. [DOI] [PMC free article] [PubMed] [Google Scholar]
- 17.Kurmasheva RT, Harwood FC, Houghton PJ. Differential regulation of vascular endothelial growth factor by Akt and mammalian target of rapamycin inhibitors in cell lines derived from childhood solid tumors. Mol Cancer Ther. 2007;6:1620–1628. doi: 10.1158/1535-7163.MCT-06-0646. [DOI] [PubMed] [Google Scholar]
- 18.Ketroussi F, Giuliani M, Bahri R, Azzarone B, Charpentier B, Durrbach A. Lymphocyte cell-cycle inhibition by HLA-G is mediated by phosphatase SHP-2 and acts on the mTOR pathway. PloS one. 2011;6:e22776. doi: 10.1371/journal.pone.0022776. [DOI] [PMC free article] [PubMed] [Google Scholar]
- 19.Ma XM, Blenis J. Molecular mechanisms of mTOR-mediated translational control. Nat Rev Mol Cell Biol. 2009;10:307–318. doi: 10.1038/nrm2672. [DOI] [PubMed] [Google Scholar]
- 20.Lee-Fruman KK, Kuo CJ, Lippincott J, Terada N, Blenis J. Characterization of S6K2, a novel kinase homologous to S6K1. Oncogene. 1999;18:5108–5114. doi: 10.1038/sj.onc.1202894. [DOI] [PubMed] [Google Scholar]
- 21.Sena LA, Li S, Jairaman A, Prakriya M, Ezponda T, Hildeman DA, Wang CR, Schumacker PT, Licht JD, Perlman H, Bryce PJ, Chandel NS. Mitochondria are required for antigen-specific T cell activation through reactive oxygen species signaling. Immunity. 2013;38:225–236. doi: 10.1016/j.immuni.2012.10.020. [DOI] [PMC free article] [PubMed] [Google Scholar]
- 22.Leboucher GP, Tsai YC, Yang M, Shaw KC, Zhou M, Veenstra TD, Glickman MH, Weissman AM. Stress-induced phosphorylation and proteasomal degradation of mitofusin 2 facilitates mitochondrial fragmentation and apoptosis. Mol Cell. 2012;47:547–557. doi: 10.1016/j.molcel.2012.05.041. [DOI] [PMC free article] [PubMed] [Google Scholar]
- 23.Sherr CJ. G1 phase progression: Cycling on cue. Cell. 1994;79:551–555. doi: 10.1016/0092-8674(94)90540-1. [DOI] [PubMed] [Google Scholar]
- 24.Hatakeyama M, Brill JA, Fink GR, Weinberg RA. Collaboration of G1 cyclins in the functional inactivation of the retinoblastoma protein. Genes Dev. 1994;8:1759–1771. doi: 10.1101/gad.8.15.1759. [DOI] [PubMed] [Google Scholar]
- 25.Chellappan SP, Hiebert S, Mudryj M, Horowitz JM, Nevins JR. The E2F transcription factor is a cellular target for the RB protein. Cell. 1991;65:1053–1061. doi: 10.1016/0092-8674(91)90557-f. [DOI] [PubMed] [Google Scholar]
- 26.Weintraub SJ, Prater CA, Dean DC. Retinoblastoma protein switches the E2F site from positive to negative element. Nature. 1992;358:259–261. doi: 10.1038/358259a0. [DOI] [PubMed] [Google Scholar]
- 27.Dynlacht BD, Flores O, Lees JA, Harlow E. Differential regulation of E2F transactivation by cyclin/cdk2 complexes. Genes Dev. 1994;8:1772–1786. doi: 10.1101/gad.8.15.1772. [DOI] [PubMed] [Google Scholar]
- 28.Appleman LJ, Berezovskaya A, Grass I, Boussiotis VA. CD28 costimulation mediates T cell expansion via IL-2-independent and IL-2-dependent regulation of cell cycle progression. J Immunol. 2000;164:144–151. doi: 10.4049/jimmunol.164.1.144. [DOI] [PubMed] [Google Scholar]
- 29.Vitagliano D, Carlomagno F, Motti ML, Viglietto G, Nikiforov YE, Nikiforova MN, Hershman JM, Ryan AJ, Fusco A, Melillo RM, Santoro M. Regulation of p27Kip1 protein levels contributes to mitogenic effects of the RET/PTC kinase in thyroid carcinoma cells. Cancer Res. 2004;64:3823–3829. doi: 10.1158/0008-5472.CAN-03-3918. [DOI] [PubMed] [Google Scholar]
- 30.Osaki LH, Gama P. MAPK signaling pathway regulates p27 phosphorylation at threonin 187 as part of the mechanism triggered by early-weaning to induce cell proliferation in rat gastric mucosa. PloS one. 2013;8:e66651. doi: 10.1371/journal.pone.0066651. [DOI] [PMC free article] [PubMed] [Google Scholar]
Associated Data
This section collects any data citations, data availability statements, or supplementary materials included in this article.


