

Abstract
Induction of fetal hemoglobin (HbF) is considered a promising strategy in the treatment of β-thalassemia, in which production of adult hemoglobin (HbA) is impaired by mutations affecting the β-globin gene. Recent results indicate that B-cell lymphoma/leukemia 11A (BCL11A) is a major repressor of γ-globin gene expression. Therefore, disrupting the binding of the BCL11A transcriptional repressor complex to the γ-globin gene promoter provides a novel approach for inducing expression of the γ-globin genes. To develop a cellular screening system for the identification of BCL11A inhibitors, we produced K562 cell clones with integrated copies of a BCL11A-XL expressing vector. We characterized 12 K562 clones expressing different levels of BCL11A-XL and found that a clear inverse relationship does exist between the levels of BCL11A-XL and the extent of hemoglobinization induced by a panel of HbF inducers. Using mithramycin as an inducer, we found that this molecule was the only HbF inducer efficient in rescuing the ability to differentiate along the erythroid program, even in K562 cell clones expressing high levels of BCL11A-XL, suggesting that BCL11A-XL activity is counteracted by mithramycin.
Graphical abstract
Highlights
-
•
K562 clones were described with integrated copies of a BCL11A-XL expressing vector.
-
•
B-Cell lymphoma/leukemia 11A-XL (BCL11A-XL) levels inversely correlate with the extent of hemoglobin induction.
-
•
Mithramycin induces γ-globin genes even in K562 clones expressing high levels of BCL11A-XL.
-
•
K562(BCL11A-XL) clones might be useful in identifying fetal hemoglobin inducers acting on BCL11A.
The β-thalassemias are relevant hereditary hematologic diseases caused by nearly 300 mutations of the β-globin gene 1, 2, leading to low or no production of adult β-globin and an excess of α-globin in erythroid cells. This causes ineffective erythropoiesis and low or no production of adult hemoglobin (HbA) [3]. Background information on β-thalassemia is available in excellent reviews outlining the genetics [4], physiopathology [5], and therapeutics [6] of this disease. Together with sickle cell anemia (SCA), thalassemia syndromes are the most important problems in developing countries, in which the lack of genetic counseling and prenatal diagnosis has contributed to the maintenance of a very high frequency of these genetic diseases in the population [7]. The total annual incidence of symptomatic individuals with β-thalassemia is estimated at 1 in 100,000 throughout the world [3]. Presently, no definitive treatment for β-thalassemia and SCA is available. Clinical management of β-thalassemia patients includes lifelong blood transfusions associated with chelation therapy to remove the excess transfused iron [8] and, in some cases, bone marrow transplantation [9]. However, considering the limitations and side effects of the currently available therapeutic approaches and management of the β-thalassemia patients, novel alternative options for therapy are needed [7]. We have recently reviewed the available literature concerning the development of DNA-based therapeutic strategies for β-thalassemia 7, 10, 11, 12.
Induction of fetal hemoglobin (HbF) is considered a promising strategy for treatment of β-thalassemia 7, 12, 13, 14. This is supported by the fact that hydroxyurea, a powerful inducer of differentiation and HbF, is able to ameliorate the clinical parameters of β-thalassemia and SCA patients and, for this reason, has been used in several experimental trials and patient clinical management [12]. However, because of the expected side effects of HU, novel HbF inducers are of great interest in studies aimed at developing novel therapeutic options for β-thalassemia 15, 16, 17, 18.
Several recent publications have concurrently reported that the γ-globin gene expression is under strong negative transcriptional control 19, 20, 21, 22, 23, 24, 25. For instance, BCL11A 21, 22, 23, KLF-1 22, 23, MYB [24], and Oct-1 [25] have been suggested as important direct or indirect repressors of γ-globin gene transcription. Apart from the theoretical importance, this conclusion indicates the potential therapeutic use of targeting these transcription factors 26, 27. In fact, the obvious hypothesis is that pharmacologic inhibitors of these transcription repressors might contribute in activating γ-globin genes and promoting HbF production.
The zinc finger transcription factor B-cell lymphoma/leukemia 11A (BCL11A) was recently found to be the major repressor of HbF expression in genomewide association studies (GWAS), leading to identification of a new HbF-associated locus on chromosome 2, located within the gene BCL11A [27]. The BCL11A isoform predominant in adult erythroid progenitor cells is BCL11A-XL 21, 22. It has been in fact reported that transgenic deactivation of BCL11A induces HbF and corrects a humanized sickle-hemoglobin mouse model [28]; BCL11A knockdown leads to significant HbF induction in human cells 29, 30, similar to knockdown of its positive regulator KLF1 [26]. To move from general concept to therapeutic application, controlled and stable shRNA-mediated HbF induction has achieved an efficiency of potential clinical relevance 31, 32.
This field of research is of top interest, as several approaches can lead to pharmacologically mediated inhibition of the expression of γ-globin gene repressors, resulting in γ-globin gene activation. Among these strategies, we underline, in addition to the already mentioned delivery of shRNAs, direct targeting of the transcription factors by aptamers or decoy molecules, as well as inhibition of the mRNA-coding γ-globin gene repressors with antisense molecules, peptide nucleic acids (PNAs), and microRNAs [12].
The objective of the work described here was to develop an in vitro experimental model system expressing transcription repressors at different levels and verify whether this approach might be useful in identifying HbF inducers acting on these γ-globin gene regulators. We took advantage of the fact that the human erythroleukemia K562 cells express very low levels of BCL11A-XL and, therefore, were expected to be an appealing in vitro system for producing clones expressing this gene at different levels. For this reason, we focused, among the different γ-globin gene repressors, on BCL11A-XL using, among the different available erythroid cell lines, K562 cells. This cell line, on the other hand, is well known and characterized by its suitability in studies aimed at the identification of compounds inducing erythroid differentiation. In addition, this cell line has been extensively used for the screening and characterization of inducers of embryonic and fetal globin genes 33, 34, 35, 36, 37, because it does not normally express the adult β-globin genes [26] and does not produce relevant levels of HbA even if treated with erythroid differentiation inducers. As inducers to be screened, we employed hydroxyurea (as it is the reference HbF inducer, in consideration of its extensive use in therapy of β-thalassemia and sickle cell anemia) and mithramycin (one of the best HbF inducers studied for many years in our laboratory and having a different mechanism of action).
Methods
The full version of the Methods section is provided as a supplement (see Supplementary Methods, online only, available at www.exphem.org).
Materials
Mithramycin (MTH, Catalog No. M6891), resveratrol (RSV, Catalog No. R5010), rapamycin (RAPA, Catalog No. R0395), hydroxyurea (HU, Catalog No. H8627), butyric acid (BA, Catalog No. B5887), and dimethyl sulfoxide (DMSO, Catalog No. D2650) were from Sigma-Aldrich (St. Louis, MO). 1-Octylthymine (1-OctylT) was a gift from Roberto Corradini (Department of Chemistry, University of Parma, Parma, Italy).
Cell lines, primary cells, and culture conditions
Human erythroleukemia K562 cells 33, 34, 35, 36, 37 and murine Friend leukemia cells (FLCs) 38, 39 were cultured as described 33, 39. Cell growth was studied using a Z2 Coulter Counter (Beckman Coulter, Fullerton, CA). Human primary erythroid precursor cells (ErPCs) were isolated and cultures performed as described 17, 18, 34, 35, 36. After 7 days of cell culture phase II, cells were treated for additional 5 days with MTH. All cellular treatments with Hb inducers were carried out by adding the compounds at the beginning of culture setup without further additions and changes of the medium. Hemoglobin-containing cells were detected by specific reaction with a benzidine/hydrogen peroxide solution (0.2% in 5 mol/L glacial acetic acid and 10% H2O2) [35].
Production of K562(BLC11A-XL) clones
For production of K562 cell clones with integrated copies of a BCL11A-XL-expressing vector, we transfected K562 cells with the pCDNA3.1-BCL11A-XL vector and then cloned and selected positive cells by limiting dilutions in the presence of geneticin.
FACS analysis
The erythroid differentiation status of K562 cells and K562(BCL11A-XL) clone 12 was investigated by studying transferrin Receptor (trfR) and glycophorin A (GYPA) expression by fluorescence-activated cell sorting (FACS) analysis using anti-human CD71 fluorescein isothiocyanate (FITC)-conjugated antibody (Miltenyi Biotec GmbH, Germany) and anti-human CD235a (glycophorin A) phycoerythrin (PE)-conjugated antibody (Miltenyi Biotec) [36].
Reverse transcription and quantitative real-time PCR
For gene expression analysis, 300 ng of total RNA (for isolation, see Supplementary Methods, online only, available at www.exphem.org) were reverse transcribed using random hexamers. Real-time quantitative polymerase chain reaction (RT-qPCR) experiments were carried out using the 5′-nuclease assay. Gene-specific primers and fluorescence-labeled probes, reported in Supplementary Table E1, Supplementary Table E2 (online only, available at www.exphem.org), were purchased from Applied Biosystems (Applied Biosystems, Monza, Italy) and Integrated DNA Technologies (IDT, Coralville, IA).
Western blotting
Twelve micrograms of protein cytoplasmic extracts were prepared as described under Supplementary Methods (online only, available at www.exphem.org), denatured for 5 min at 98°C in 1× sodium dodecyl sulfate (SDS) sample buffer (62.5 mM Tris–HCl pH 6.8, 2% SDS, 50 mM dithiotreithol [DTT], 0.01% bromphenol blue, 10% glycerol), and loaded on SDS–polyacrylamide gel in Tris–glycine buffer (25 mM Tris, 192 mM glycine, 0.1% SDS). Western blotting was conducted as described [37] using the BCL11A primary rabbit monoclonal antibody (1:1,000, Catalog No. A300-382A, Bethyl, Montgomery, TX). The primary antibody against p70S6K (Catalog No. 2708, Cell Signaling, Leiden, Netherlands) was used as normalization control.
Ethics statement
The use of human material was approved by the ethics committee of the Ferrara District, Document No. 06/2013, approved on 20 June 2013. All peripheral blood samples were obtained after receiving written informed consent from patients or their legal representatives.
Statistical analysis
All data were normally distributed and expressed as means ± SD. Coefficients of determination (R2) and p-values were obtained using the GraphPad Prism Software (San Diego, CA). Statistical significance was assumed at *p < 0.05 and **p < 0.01.
Results
Development and characterization of K562(BCL11A-XL) clones
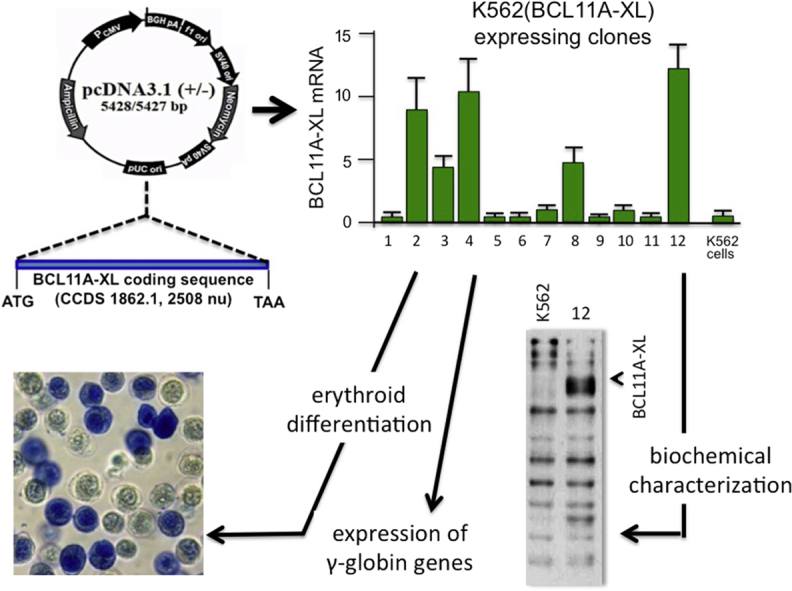
To design an experimental system suitable for screening BCL11A inhibitors (see Fig. 1A for a flowchart indicating the steps in production and characterization of K562 clones), we produced K562 cell clones with integrated copies of a BCL11A-XL-expressing vector. We characterized 12 K562 clones expressing different levels of BCL11A-XL, as illustrated in Figure 1B, which indicates that most of the different K562(BCL11A-XL) clones obtained express BCL11A-XL mRNA sequences, albeit at very different levels. As known, K562 cells express very low levels of BCL11A-XL [26]. Interestingly, the K562 cell clones producing BCL11A-XL can be grouped into different classes: those expressing BCL11A mRNA at high levels [K562(BCL11A-XL) clones 2, 4, 12], intermediate levels [K562(BCL11A-XL) clones 3, 8] and low levels [K562(BCL11A-XL) clones 1, 5, 6, 7, 9, 10, 11]. The different BCL11A-XL mRNA levels correspond to different levels of BCL11A protein, as illustrated by the Western blot analysis in Figure 1C, which also includes a representative Western blot of proteins produced by K562(BCL11A-XL) clone 12. The conclusion drawn from this first set of data is that we have generated a panel of K562(BCL11A-XL) clones expressing, unlike the original K562 cells, variable levels of K562(BCL11A-XL) mRNA and protein. The finding that the expression of BCL11A-XL differs among the clones allows studies on the possible relationship between BCL11A-XL and hemoglobinization induced by HbF inducers acting by different mechanisms of action.
Figure 1.

Production and characterization of K562(BCL11A-XL) cells. (A) Scheme describing the strategy. K562 cells were transfected with the pCDNA3.1-BCL11A-XL vector containing BLC11A-XL cDNA under the control of the cytomegalovirus promoter. (B, C) Quantitative analysis of BCL11A-XL expression in 12 K562(BCL11A-XL) clones, determined by real-time quantitative polymerase chain reaction (B) and Western blotting (C). The data represent the average ± SD of three independent analyses. Fold expression is relative to K562(BCL11A-XL) clone 10. A representative result of Western blotting is shown on the left in (C) and was performed using protein extracts isolated from K562 and K562(BCL11A-XL) clone 12, as indicated. The BCL11A-XL protein is arrowed. As an internal control, the Western blotting filters were stripped, and binding reaction was performed using an antibody recognizing p70.
Ability of K562(BCL11A-XL) clones to undergo induced erythroid differentiation
To determine possible relationships between BCL11A-XL levels and erythroid differentiation stimulated by HbF inducers, we employed two inducers of erythroid differentiation, hydroxyurea (HU) [40] and mithramycin (MTH) 35, 36, 37, chosen because they have very different mechanisms of action. In fact, HU inhibits cellular ribonucleotide reductase (critical for DNA synthesis in dividing late erythroid progenitor cells), whereas MTH is a strong DNA-binding compound (selective for GC-rich regions, including important regulatory sequences present in the γ-globin gene promoter). Hemoglobin accumulation was studied with benzidine staining [35], which indicated that when the clones were treated for 4 days with 175 μmol/L HU, only very few of them were able to undergo erythroid induction (Fig. 2A, left). On the contrary, 20 nmol/L MTH appears to induce hemoglobinization (i) in a larger number of K562(BCL11A-XL) clones and (ii) to a greater extent, in terms of percentage of benzidine-positive cells (Fig. 2A, right). This was further confirmed after analysis of the increase in the proportion of benzidine-positive cells in K562(BCL11A-XL) clone 12, exhibiting the highest levels of BCL11A-XL expression (Fig. 1B) and production (see Western blotting analysis illustrated in Fig. 1C). As illustrated in Figure 2B, the increase in the proportion of Hb-producing K562(BCL11A-XL) clone 12 cells is shifted when MTH is used, whereas induction does not occur in the presence of HU. To determine whether the lack of an increase in the proportion of benzidine-positive cells is associated with an inhibitory effect on other erythroid differentiation parameters, the expression of transferrin receptor (trfR) and glycophorin A (GYPA) was determined by FACS analysis in K562 cells and K562(BCL11A-XL) clone 12 cells treated with HU and MTH for 4 days. As illustrated in Figure 2C, the lack of an increase in benzidine-positive cells is not accompanied by a block of the inducer-mediated increase in trfR and GYPA expression. Although this was expected in MTH-treated K562(BCL11A-XL) clone 12 cells (in agreement with the analyses illustrated in Fig. 2B), this was not obvious in the same cells treated with HU. Moreover, it should be noted that the extent of trfR and GYPA expression in HU- and MTH-induced K562(BCL11A-XL) clone 12 cells approaches the values obtained in erythroid-induced K562 cells. When the fluorescence intensity reflecting trfR and GYPA expression in HU- and MTH-induced K562 and K562(BCL11A-XL) clone 12 cells was compared with that measured in untreated cells in three independent experiments, the differences were found to be reproducible and highly significant (p < 0.01).
Figure 2.

Ability of K562(BCL11A-XL) clones to undergo differentiation. (A) K562(BCL11A-XL) cell clones were treated for 4 days in the absence or presence of 175 μmol/L HU and 20 nmol/L MTH, and the percentage of benzidine-positive (Hb-containing) cells was determined. (B) Kinetics of hemoglobinization of K562 (○, ▵) and K562(BCL11A-XL) clone 12 (•, ▴) treated with 175 μmol/L HU (○, •) and 20 nmol/L MTH (▵, ▴). (C) Fluorescence-activated cell sorting analysis revealed the expression of trfR and GYPA by K562 cells and by K562(BCL11A-XL) clone 12 treated with 175 μmol/L HU and 20 nmol/L MTH for 4 days, as indicated.
The overall conclusion of the experiments is that K562(BCL11A-XL) clones are induced to increased Hb production with low efficiency with HU, even if treated with high concentrations of the inducer and even if they express low levels of BCL11A-XL. On the contrary, most of the clones expressing BCL11A-XL and resistant to HU hemoglobin induction are able to increase Hb content with 20 nmol/L MTH, suggesting that this inducer might rescue the BCL11A-XL-mediated decrease in expression of globin genes (see, e.g., the data relative to clone 12 illustrated in Fig. 2B). We can conclude that the program of induced erythroid differentiation is not blocked in BCL11A-XL-expressing clones cultured with HU or MTH, as trfR and GYPA are not expressed during HU and MTH treatment, even when using as a model system the K562(BCL11A-XL) clone 12, expressing the highest level of BCL11A-XL (Fig. 2C).
BCL11A-XL production in K562(BCL11A-XL) clones: Possible correlation between BCL11A-XL, expression of globin genes, and hemoglobin production
To acquire information supporting possible relationships between BCL11A-XL levels, hemoglobin induction, and globin gene expression, the experiments illustrated in Figure 3A–D were performed using 20 nmol/L MTH. Figure 3A and B illustrates that an inverse trend does exist between the proportion of benzidine-positive cells and BCL11A-XL mRNA expression, when cells are treated with MTH for 4 (Fig. 3A) and 5 (Fig. 3B) days. In agreement, Figure 3 presents data supporting a possible inverse relationship between ε-globin (Fig. 3C) and γ-globin (Fig. 3D) mRNA production and BCL11A-XL mRNA expression. The expression of β-globin genes was not considered because K562 cells express very low levels of this gene [26]. These results confirm that the small increase in hemoglobin production in MTH-treated K562(BCL11A-XL) clones expressing high levels of BCL11A-XL (Fig. 3A, B) is associated with low levels of accumulation of ε-globin (Fig. 3C) and γ-globin (Fig. 3D) mRNAs. In particular, it should be underlined that treatment with 20 nmol/L MTH is able to induce a great increase in γ-globin mRNA, even in K562 clones expressing intermediate/high levels of BCL11A-XL. Altogether, these results suggest that BCL11A-XL activity is counteracted by MTH. This is further sustained by the experiments illustrated in Figure 3E and F, which were performed by treating K562 and K562(BCL11A-XL) clone 12 cells with increasing concentrations of MTH, as indicated. As is clearly appreciable, high MTH concentrations were able to induce increases in the proportions of both benzidine-positive cells (Fig. 3E) and γ-globin mRNA production (Fig. 3F), in a dose-dependent manner (p < 0.05 when cells treated with 25 and 30 nmol/L MTH were compared with untreated cells in three independent experiments). In conclusion, the MTH-mediated increase in γ-globin mRNA might occur even in the presence of high BCL11A-XL expression, particularly when high MTH concentrations are employed. We therefore selected K562(BCL11A-XL) clone 12, which produces the highest level of BCL11A-XL, and determined the effects on these cells of MTH treatment, using high concentrations of the drug (30 nmol/L) to force the erythroid induction pathway.
Figure 3.

Ability of K562(BCL11A-XL) clones to increase HbF production and globin gene expression. (A–D) K562(BCL11A-XL) cell clones were treated for 4 days in the absence or presence of 20 nmol/L MTH, and the relative expression of BCL11A-XL mRNA (fold with respect to wild-type cells) was compared with the percentage of benzidine-positive cells: (A) cells treated for 4 days with MTH; (B) cells treated for 5 days with MTH; (C) fold increase in expression of ε-globin mRNA; (D) fold increase in expression of γ-globin mRNA. (E) Effects of increasing concentrations of MTH on the percentage of benzidine-positive cells in K562 (○) and K562(BCL11A-XL) clone 12 (•) cell cultures treated for 6 days. (F) Expression of γ-globin mRNA after treatment of K562 (white boxes) and K562(BCL11A-XL) clone 12 (black boxes) cells with 20 and 30 nmol/L MTH for 4 days, as indicated. Fold increase was determined with respect to untreated cells using RPL13A and 18S as reference sequences. The results represent averages ± SD (n = 3). *p < 0.05. **p < 0.01.
Mithramycin reverses BCL11A-XL-mediated inhibition of γ-globin mRNA production and hemoglobin induction in K562(BCL11A-XL) clone 12
To verify the effects of different erythroid inducers on K562 cells expressing high levels of BCL11A-XL, K562 and K562(BCL11A-XL) clone 12 cells were treated with hydroxyurea [40], resveratrol [17], butyric acid [15], 1-octylthymine [41], rapamycin [18], and mithramycin 35, 36, 37 (Fig. 4). The data obtained indicate that all the inducers employed, as reported in previous studies by our and other groups 17, 18, 33, 35, 38, 39, 40, 41, increased Hb production in K562 cells (Fig. 4A). In sharp contrast, among this selected group of HbF inducers, the only inducer able to stimulate an increased proportion of Hb-producing cells was mithramycin, when K562(BCL11A-XL) clone 12 was employed (Fig. 4B). The conclusion drawn from this set of experiments is that BCL11A-XL-expressing clones are suitable to select K562 inducers possibly interfering with BCL11A, thereby inducing γ-globin mRNA expression and increases in Hb production.
Figure 4.

Increase in proportion of hemoglobin-containing, benzidine-positive cells in K562 and K562(BCL11A-XL) clone 12 cells treated with different fetal hemoglobin inducers. K562 (A) and K562(BCL11A-XL) clone 12 cells (B) were cultured in the presence of 30 nmol/L MTH (▴), 175 μmol/L HU (▵), 1.5 mmol/L BA (○), 25 μmol/L 1-OctylT (■), 150 nmol/L RAPA (□), and 30 μmol/L RSV (•), and the proportion of benzidine-positive cells was determined. Data represent averages ± SD of four independent experiments. The differences between inducer-treated and untreated K562 cells were highly significant (p < 0.01) for all inducers, when data relative to 6 and 7 days of induction were considered. On the contrary, only K562(BCL11A-XL) clone 12 cells treated with MTH exhibited significant differences (p < 0.05) with respect to untreated cells.
To conclusively verify whether mithramycin induces full activation of the erythroid pattern in the K562(BCL11A-XL) clone 12, cells were treated for 4 days in the absence or presence of 30 nmol/L MTH, and the expression of γ-globin gene was analyzed, together with the expression of other erythroid-associated genes such as those coding trfR, GYPA, NFE2L3, ALAS-2, DNMT (EBP49), and SCL4A1 (band 3). The results obtained indicate that the MTH-mediated induction in K562(BCL11A-XL) clone 12 is, as in the original K562 cell line, limited not only to the expression of γ-globin genes, but also to all the other erythroid genes analyzed, albeit at different levels (Fig. 5B, C).
Figure 5.

Effects of 30 nmol/L MTH treatment on erythroid differentiation markers. K562 (white boxes) and clone 12 (black boxes) cells were treated in the absence or presence of 30 nmol/L MTH. (A) Effects on the increase in the proportion of benzidine-positive cells (%) evaluated after 4 and 5 days of cell culture. (B, C) After RNA extraction, expression of the following mRNAs was analyzed in 4-day MTH-treated cells: γ-globin, trfR, DNMT (EBP49), NFE2L3 (B); and SCL4A1 (band-3), ALAS-2, GYPA (C). Data represent averages ± SD of four independent experiments.
Effects of MTH treatment on BCL11A-XL and globin gene expression in other erythroid cellular systems: Murine FLCs and human primary ErPCs from β–thalassemia patients
One of the hypotheses derived from the experiments described in this article is that mithramycin might have a direct effect on BCL11A-XL activity. We therefore wanted to further verify whether increases in globin gene expression might be associated with downregulation of BCL11A-XL in other cellular erythroid model systems, such as murine FLCs 38, 39 and human primary ErPCs isolated from β–thalassemia patients 34, 35, 36. FLCs were cultured for 4 days with 400 nmol/L MTH or 2% DMSO, and the proportion of benzidine-positive cells was determined together with the levels of α-globin, adult βmajor-globin, embryofetal βh1-globin, and BCL11A mRNAs. The results obtained (Fig. 6A) illustrate a decrease in BCL11A mRNA expression in both MTH- and DMSO-treated FLCs, in association with an increase in the proportion of benzidine-positive cells and content of α-globin, adult βmajor-globin, and embryo-fetal βh1-globin mRNAs (in all cases p < 0.01). In addition to the FLC system, erythroid precursor cells from β-thalassemia patients might be a very informative experimental model, because MTH is a strong inducer of HbF in these cells, as originally reported by our group [35]. Figure 6B illustrates that when ErPCs from three β+- and four β0-thalassemia patients were isolated and cultured for 5 days with 30 nmol/L MTH, a sharp decrease in BCL11A-XL and increase in γ-globin mRNA were observed (in both cases p < 0.01). Figure 6C depicts the relationship between MTH concentration and BCL11A-XL or γ-globin mRNA content in ErPCs from a β039/β039 thalassemia patient. This experiment clearly underlines that the increase in γ-globin mRNA does not occur until downregulation of BCL11A-XL is induced by mithramycin. Similar results were obtained with ErPCs isolated from β+-thalassemia patients (Finotti et al., manuscript in preparation).
Figure 6.

Effects of MTH treatment on BCL11A-XL and globin gene expression in murine FLCs and ErPCs from β–thalassemia patients. (A) FLCs were treated for 4 days with 2% DMSO or 400 nmol/L MTH. The proportion of benzidine-positive cells (left), content of globin mRNAs (middle), and content of Bcl11a (right) were evaluated. (B) ErPCs from three β+- and four β0-thalassemia patients were isolated and cultured for 5 days with 30 nmol/L MTH. BCL11A-XL and γ-globin mRNAs were analyzed by RT-qPCR. (C) Relationship between MTH concentration and content of BCL11A-XL and γ-globin mRNAs in ErPCs from a β039/β039 thalassemia patient. ErPCs were cultured for 5 days with increasing concentrations of MTH, RNA was isolated, and RT-qPCR performed. The data (A) represent averages ± SD of three independent cultures.
Discussion
Induction of fetal hemoglobin (HbF) is considered a possible therapeutic strategy in the treatment of β-thalassemia 7, 13, 14, 15, 16, 17, 18, 27, where the production of HbA is impaired by mutations affecting the β-globin gene 1, 2, 3, 4. Therefore, screening systems for the identification of novel lead compounds for induction of HbF in erythroid cells are of great interest in the field of applied hematology 42, 43, 44.
Recent results suggest that BCL11A-XL is a major repressor of γ-globin gene expression 21, 22, 23, 29. Therefore, interference with the binding of the BCL11A-XL transcriptional complex to the γ-globin gene promoter provides a novel approach to induce expression of the γ-globin genes 30, 31, 32. To develop a cellular screening system for BCL11A-XL inhibitors, we produced K562 cell clones with integrated copies of a BCL11A-XL-expressing vector, taking advantage of the fact that very low levels of endogenous BCL11A-XL are present in K562 cells [26].
We characterized 12 K562 clones expressing different levels of BCL11A-XL (Fig. 1) and found that a clear association does exist between the levels of BCL11A-XL and the extent of hemoglobin production obtained by treatment with MTH (Fig. 3). In addition, we found that this molecule was the only one, among a short list of Hb inducers (Fig. 4), able to rescue the ability to differentiate along the erythroid program, even when K562 cell clones expressing high levels of BCL11A-XL were used, suggesting that the BCL11A-XL inhibitory activity of the γ-globin gene expression is counteracted by MTH.
Interestingly, a site recognized by MTH is present in the γ-globin gene promoter and corresponds to a region specific for the binding of the BCL11A complex (Finotti et al., manuscript in preparation). Additional experiments performed using electrophoretic mobility shift assay (EMSA) as experimental strategy indicated that MTH interferes with the molecular interactions between γ-globin gene promoter and DNA-binding proteins, strongly suggesting that the activity of MTH on γ-globin gene transcription might be, at least in part, ascribed to a direct inhibitory effect on the binding of molecular protein complexes to the BCL11A binding site of the γ-globin gene promoter (Finotti et al., manuscript in preparation).
To sustain the concept that the increase in expression of γ-globin genes is inversely associated with BCL11A-XL content, murine FLCs 38, 39 and ErPCs isolated from β-thalassemia patients were employed, induced by MTH, and analyzed for content of globin and BCL11A-XL mRNAs. Fully in agreement with the conclusions derived from the data on K562(BCL11A-XL) clones, downregulation of BCL11A-XL was observed in FLCs and ErPCs following a MTH-induced increase in globin mRNAs production (βmajor- and βh1-globin mRNAs in FLCs, γ-globin mRNA in ErPCs).
Conclusions
We have suggested a possible application of K562 cell clones stably transfected with constructs expressing the BCL11A-XL gene in the identification of inducers able to stimulate HbF production via downregulation of the γ-globin gene repressor BCL11A-XL. A possible limitation of the proposed model system is that the use of modifiers acting on the promoter of the endogenous BCL11A gene or on other regulatory pathways of the endogenous BCL11A mRNA might require suitable internal controls and additional experimental strategies. On the other hand, the advantages of this system, unlike primary ErPCs, are: (i) availability of clones expressing different well-characterized levels of BCL11A-XL; (ii) possibility of obtaining large amounts of these cells for molecular studies; (iii) possible use for screening (results available within 1 week); and (iv) absence of genetic variability affecting γ-globin gene expression. In addition, our strategy, at least in theory, might be followed to produce K562 cell clones expressing different levels of other transcription repressors of the γ-globin gene, such as Myb 24, 29, Oct-1 [25], KLF-1 23, 26, and LYAR [19].
Acknowledgments
This work was supported by UE FP7 THALAMOSS Project (Thalassaemia Modular Stratification System for personalized therapy of β-thalassemia, Grant 306201-FP7-Health-2012-INNOVATION-1), by Telethon (Contract GGP10124), and by AIRC (Grant IG13575). This research was also supported by Fondazione Cariparo (Cassa di Risparmio di Padova e Rovigo, RG-2012/2015), CIB (Consorzio Interuniversitario Biotecnologie), and Associazione Veneta per la Lotta alla Talassemia (AVLT) Rovigo.
Footnotes
Supplementary data related to this article can be found online at http://dx.doi.org/10.1016/j.exphem.2015.08.011.
Supplementary methods
Cell lines and culture conditions
Human erythromyeloblastoid leukemia K562 cells 33, 34, 35, 36, 37, K562(BCL11A-XL) clones, and murine Friend leukemia cells (FLCs) 38, 39 were cultured in a humidified atmosphere of 5% CO2/air in RPMI-1640 medium (Gibco Life Technologies, Monza, Italy) supplemented with 10% (v/v) fetal bovine serum (FBS, Biowest, Nuaillé, France), 100 U/mL penicillin, and 100 μg/mL streptomycin. Treatment of cells with erythroid differentiation inducers was carried out by adding the appropriate drug concentrations at the beginning of the cultures [(K562 and K562(BCL11A-XL) clone cells were seeded at 30,000/mL; FLCs were seeded at 70,000/mL)]. The medium was not changed during the induction period. Hemoglobin-containing cells were detected by specific reaction with a benzidine/hydrogen peroxide solution containing 0.2% benzidine HCl (Sigma Genosys) in 5 mol/L glacial acetic acid, pre-activated with a 10% (v/v) solution of 30% H2O2 [35].
In vitro culture of erythroid progenitors from β-thalassemia patients
The two-phase liquid culture procedure was employed as previously described 17, 18, 34, 35, 36. Mononuclear cells were isolated from peripheral blood samples of β-thalassemia patients by Ficoll–Hypaque density gradient centrifugation. After isolation, the mononuclear cell layer was washed three times by adding 1× phosphate-buffered saline (PBS) solution and seeded in α-minimal essential medium (α-MEM, Sigma Genosys) supplemented with 10% FBS (Celbio, Milan, Italy), 1 μg/mL cyclosporine A (Sandoz, Basel, Switzerland), and 10% conditioned medium from the 5637 bladder carcinoma cell line culture. The cultures were incubated at 37°C, under an atmosphere of 5% CO2. After 7 days in this phase I culture (at 37°C, under an atmosphere of 5% CO2 in air, with extra humidity), nonadherent cells were harvested from the flask, washed in 1× PBS, and then cultured in phase II medium, composed of α-MEM (Sigma Genosys), 30% FBS (Celbio), 1% de-ionized bovine serum albumin (BSA, Sigma Genosys), 10−5 mol/L β-mercaptoethanol (Sigma Genosys), 2 mmol/L L-glutamine (Sigma Genosys), 10−6 mol/L dexamethasone (Sigma Genosys), 1 U/mL human recombinant erythropoietin (EPO) (Tebu-bio, Magenta, Milan, Italy), and stem cell factor (SCF, BioSource International, Camarillo, CA) at the final concentration of 10 ng/mL. Erythroid precursor cell differentiation was assessed by benzidine staining 17, 18, 34, 35, 36.
FACS analyses
The erythroid differentiation status of K562 cells and K562(BCL11A-XL) clone 12 was investigated by studying transferrin receptor (trfR) and glycophorin A (GYPA) expression by fluorescence-activated cell sorting (FACS) analysis using anti-human CD71 fluorescein isothiocyanate (FITC)-conjugated antibody (Miltenyi Biotec, Germany) and anti-human CD235a (glycophorin A) phycoerythrin (PE)-conjugated antibody (Miltenyi Biotec) [36]. According to the manufacturer's protocol, 10 μL of antibodies were added to freshly isolated cells in 100 μL 1× PBS and 1% FBS, and cells were incubated on ice for 30 min. Cells were washed twice in 1× PBS and 1% FBS and analyzed using the BD FACScan system (Becton, Dickinson, Italy).
RNA extraction
Cells were isolated by centrifugation at 500 g for 10 min at 4°C, washed in PBS, and lysed in Tri-Reagent (Sigma-Aldrich), according to the manufacturer's instructions. The isolated RNA was washed once with cold 75% ethanol, dried, and dissolved in DNAse/RNAse-free water before use.
Reverse transcription and RT-qPCR
For gene expression analysis, 300 ng of total RNA was reverse transcribed to cDNA using the Taq-Man Reverse Transcription PCR Kit and random hexamers (Applied Biosystems) in a 50 μL reaction. Real-time quantitative polymerase chain reaction (RT-qPCR) experiments were carried out using the 5′-nuclease assay with the primers and probes indicated in Supplementary Table E1, Supplementary Table E2. The cDNA (1 μL) was amplified for 40 PCR cycles using the Taq Man Universal PCR Master Mix 2X (Applied Biosystems) in a CFX96 Touch Real-Time PCR Detection System (Bio-Rad). Relative expression was calculated using the comparative cycle threshold method, and the endogenous controls human 18S rRNA, human RPL13A, and murine GAPDH were used as normalizer genes. Duplicate negative controls (no template cDNA) were also run with every experimental plate to assess specificity and to rule out contamination. RT-qPCRs were performed in duplicate for both target and normalizer genes.
Protein extract preparation
Treated or untreated K562 cells and K562(BCL11A-XL) clones (2 × 10⁵ cells) were washed three times with cold PBS and centrifuged at 300 g for 10 min at 4°C. Then, cellular pellets were suspended in 50 μL cold water, frozen with dry ice for 5 min, and vortexed for 10 sec. This step was repeated four times in succession, samples were finally centrifuged at 14,000 g for 20 sec, and supernatant cytoplasmic fractions were collected and immediately frozen at −80°C.
Western blotting
Twelve micrograms of cytoplasmic extract were denatured for 5 min at 98°C in 1× SDS sample buffer (62.5 mmol/L Tris–HCl pH 6.8, 2% SDS, 50 mmol/L dithiotreithol [DTT], 0.01% bromphenol blue, 10% glycerol) and loaded on SDS–polyacrylamide gel (10 × 8 cm) in Tris–glycine buffer (25 mmol/L Tris, 192 mmol/L glycine, 0.1% SDS). A biotinylated protein ladder (size range: 9–200 kDa) (Cell Signaling, Euroclone, Pero, MI, Italy) was used as standard to determine molecular weight. The electrotransfer to 0.2-μm nitrocellulose membrane (Pierce, Euroclone) was performed overnight at 360 mA and 4°C in electrotransfer buffer (25 mmol/L Tris, 192 mmol/L glycine, 5% methanol). The membranes were prestained in Ponceau S solution (Sigma-Aldrich) to verify the transfer, washed with 25 ml TBS (10 mmol/L Tris–HCl pH 7.4, 150 mmol/L NaCl) for 10 min at room temperature, and incubated in 25 mL of blocking buffer for 2 hours at room temperature. The membranes were washed three times for 5 min each with 25 mL of TBS/T (TBS, 0.1% Tween-20) and incubated with BCL11A primary rabbit monoclonal antibody (1:1,000) (Catalog No. A300-382A, Bethyl, Montgomery, TX) in 15 mL primary antibody dilution buffer, under gentle agitation, overnight at 4°C. The day after, the membranes were washed three times for 5 min each with 20 mL of TBS/T and incubated in 15 mL of blocking buffer, under gentle agitation for 2 hours at room temperature, with an appropriate horseradish peroxidase-conjugated secondary antibody (1:2000) and a horseradish peroxidase-conjugated anti-biotin antibody (1:1,000) used to detect biotinylated protein marker. Finally, after three washes each with 20 mL of TBS/T for 5 min, the membranes were incubated with 10 mL LumiGLO (0.5 mL 20× LumiGLO, 0.5 mL 20× peroxide, and 9.0 mL Milli-Q water) (Cell Signaling) under gentle agitation for 5 min at room temperature and exposed to X-ray film (Pierce). As necessary, after the stripping procedure using the Restore Western Blot Stripping Buffer (Pierce), membranes were reprobed with primary and secondary antibodies. X-Ray films for chemiluminescence blots were analyzed with Gel Doc 2000 (Bio-Rad Laboratoires, Milan, Italy) using the Quantity One program to elaborate the intensity data of our specific target protein. The primary antibody against p70S6K (Catalog No. 2708, Cell Signaling) was used as normalization control.
Supplementary Table E1.
TaqMan assays obtained from Applied Biosystems and PrimeTime qPCR Assays obtained from Integrated DNA Technologies employed in RT-qPCR experiments (primer and probe sets)
| Gene name | Species | Company | Assay ID |
|---|---|---|---|
| B-Cell lymphoma/leukemia 11A (BCL11A)a | Human | Applied Biosystemsb | Hs00256254_m1 |
| BCL11Ac | Human | Applied Biosystems | Hs00250581_s1 |
| ζ-Globin | Human | Applied Biosystems | Hs00923579_m1 |
| Nuclear factor erythroid 2-like 3 (NFE2L3) | Human | Applied Biosystems | Hs00852569_g1 |
| δ-Aminolevulinate synthase 2 (ALAS-2) | Human | Applied Biosystems | Hs00163601_m1 |
| Dematin actin binding protein (DNMT [EBP49]) | Human | Applied Biosystems | Hs00157387_m1 |
| Solute carrier family 4 member 1 (SCL4A1 [band3]) | Human | Applied Biosystems | Hs00978603_m1 |
| 18S ribosomal RNA | Human | Applied Biosystems | 4310893E |
| Ribosomal protein L13a (RPL13A) | Human | Applied Biosystems | Hs03043885_g1 |
| Glyceraldehyde 3-phosphate dehydrogenase (GAPDH) | Mouse | IDTd | Mm.PT.39a.1 |
This assay was used for amplification of BCL11A transcripts in K562(BCL11A-XL) clones.
Applied Biosystems, Monza, Italy.
This assay was used for amplification of BCL11A transcripts in erythroid precursor cells from β-thalassemia patients.
Integrated DNA Technologies, Coralville, IA.
Supplementary Table E2.
Sequences of primer and probe sets for real-time quantitative polymerase chain reaction
| Gene name | Species | Primer forward | Primer reverse | Probe |
|---|---|---|---|---|
| γ-Globin | Human | 5′-TGG CAA GAA GGT GCT GAC TTC-3′ | 5′-TCA CTC AGC TGG GCA AAG G-3′ | 5′-FAM-TGG GAG ATG CCA TAA AGC ACC TGG-TAMRA-3′ |
| α-Globin | Human | 5′-CAC GCG CAC AAG CTT CG-3′ | 5′-AGG GTC ACC AGC AGG CAG T-3′ | 5′-FAM-TGG ACC CGG TCA ACT TCA AGC TCC T-TAMRA-3′ |
| Transferrin receptor (trfR) | Human | 5′-TCA GAG CGT CGG GAT ATC G-3′ | 5′-TGA ACT GCC ACA CAG AAG AAC A-3′ | 5′-FAM-TGG CGG CTC GGG ACG GA-TAMRA-3′ |
| GlycophorinA (GYPA) | Human | 5′-CGG TAT TCG CCG ACT GAT AAA-3′ | 5′-AAA GGC AGT CTG TGT CAG GT-3′ | 5′-FAM-AAA GCC CAT CTG ATG TAA AAC CTC TTC CCC T-TAMRA-3′ |
| α-Globin | Mouse | 5′-CTG ACC TCC AAG TAC CGT TAA G-3′ | 5′-GCT TCT TCC TACTCA GGCTTT AT-3′ | 5'-/56-FAM/TCT CTC CCT/ZEN/TGC ACC TGT ACC TCT/3IABkFQ/-3′ |
| β-Globin (major) | Mouse | 5′-GGA AAG GTG AAC TCC GAT GAA-3′ | 5′-TGA TAG CAG AGG CAG AGG ATAG-3′ | 5'-/56-FAM/CCT TGG ACC/ZEN/CAG CGG TAC TTT GAT/3IABkFQ/-3′ |
| βh1-Globin | Mouse | 5′- GGG AAG GCT CCT GAT TGT TTA-3′ | 5′- TCT TGC CAT GGG CTC TAATC-3′ | 5'-/56-FAM/TTG GAA ACC/ZEN/TCT CTT CTG CCCTGG/3IABkFQ/-3′ |
| BCl11a | Mouse | 5′- TTG TAA ACG TCC TTC CCC AC-3′ | 5′- TGT AGC AAT CTC ACT GTC CAC-3′ | 5'-/56-FAM/AGT AGC AAG/ZEN/CTC ACC AGG CAC AT/3IABkFQ/-3′ |
References
- 1.Giardine B., Borg J., Viennas E. Updates of the HbVar database of human hemoglobin variants and thalassemia mutations. Nucleic Acids Res. 2014;42:1063–1069. doi: 10.1093/nar/gkt911. [DOI] [PMC free article] [PubMed] [Google Scholar]
- 2.Old J.M. Screening and genetic diagnosis of haemoglobin disorders. Blood Rev. 2003;17:43–53. doi: 10.1016/s0268-960x(02)00061-9. [DOI] [PubMed] [Google Scholar]
- 3.Colah R., Gorakshakar A., Nadkarni A. Global burden, distribution and prevention of β-thalassemias and hemoglobin E disorders. Expert Rev Hematol. 2010;3:103–117. doi: 10.1586/ehm.09.74. [DOI] [PubMed] [Google Scholar]
- 4.Weatherall D.J. Phenotype–genotype relationships in monogenic disease: Lessons from the thalassaemias. Nat Rev Genet. 2001;2:245–255. doi: 10.1038/35066048. [DOI] [PubMed] [Google Scholar]
- 5.Weatherall D.J. Pathophysiology of thalassaemia. Baillieres Clin Haematol. 1998;11:127–146. doi: 10.1016/s0950-3536(98)80072-3. [DOI] [PubMed] [Google Scholar]
- 6.Quek L., Thein S.L. Molecular therapies in beta-thalassaemia. Br J Haematol. 2007;136:353–365. doi: 10.1111/j.1365-2141.2006.06408.x. [DOI] [PubMed] [Google Scholar]
- 7.Gambari R., Fibach E. Medicinal chemistry of fetal hemoglobin inducers for treatment of beta-thalassemia. Curr Med Chem. 2007;14:199–212. doi: 10.2174/092986707779313318. [DOI] [PubMed] [Google Scholar]
- 8.Goss C., Giardina P., Degtyaryova D. Red blood cell transfusions for thalassemia: Results of a survey assessing current practice and proposal of evidence-based guidelines. Transfusion. 2014;54:1773–1781. doi: 10.1111/trf.12571. [DOI] [PubMed] [Google Scholar]
- 9.Michlitsch J.G., Walters M.C. Recent advances in bone marrow transplantation in hemoglobinopathies. Curr Mol Med. 2008;8:675–689. doi: 10.2174/156652408786241393. [DOI] [PubMed] [Google Scholar]
- 10.Gambari R. Alternative options for DNA-based experimental therapy of β-thalassemia. Expert Opin Biol Ther. 2012;12:443–462. doi: 10.1517/14712598.2012.665047. [DOI] [PubMed] [Google Scholar]
- 11.Finotti A., Breda L., Lederer C.W. Recent trends in the gene therapy of β-thalassemia. J Blood Med. 2015;6:69–85. doi: 10.2147/JBM.S46256. [DOI] [PMC free article] [PubMed] [Google Scholar]
- 12.Finotti A., Gambari R. Recent trends for novel options in experimental biological therapy of β-thalassemia. Expert Opin Biol Ther. 2014;14:1443–1454. doi: 10.1517/14712598.2014.927434. [DOI] [PubMed] [Google Scholar]
- 13.Thein S.L. The emerging role of fetal hemoglobin induction in non-transfusion-dependent thalassemia. Blood Rev. 2012;26(Suppl 1):S35–S39. doi: 10.1016/S0268-960X(12)70011-5. [DOI] [PubMed] [Google Scholar]
- 14.El-Beshlawy A., Hamdy M., El Ghamrawy M. Fetal globin induction in beta-thalassemia. Hemoglobin. 2009;33(Suppl 1):S197–S203. doi: 10.3109/03630260903351882. [DOI] [PubMed] [Google Scholar]
- 15.Perrine S.P., Pace B.S., Faller D.V. Targeted fetal hemoglobin induction for treatment of beta hemoglobinopathies. Hematol Oncol Clin North Am. 2014;28:233–248. doi: 10.1016/j.hoc.2013.11.009. [DOI] [PubMed] [Google Scholar]
- 16.Atweh G., Fathallah H. Pharmacologic induction of fetal hemoglobin production. Hematol Oncol Clin North Am. 2010;24:1131–1144. doi: 10.1016/j.hoc.2010.08.001. [DOI] [PubMed] [Google Scholar]
- 17.Fibach E., Prus E., Bianchi N. Resveratrol: Antioxidant activity and induction of fetal hemoglobin in erythroid cells from normal donors and β-thalassemia patients. Int J Mol Med. 2012;29:974–982. doi: 10.3892/ijmm.2012.928. [DOI] [PubMed] [Google Scholar]
- 18.Fibach E., Bianchi N., Borgatti M. Effects of rapamycin on accumulation of alpha-, beta- and gamma-globin mRNAs in erythroid precursor cells from beta-thalassaemia patients. Eur J Haematol. 2006;77:437–441. doi: 10.1111/j.1600-0609.2006.00731.x. [DOI] [PubMed] [Google Scholar]
- 19.Ju J., Wang Y., Liu R. Human fetal globin gene expression is regulated by LYAR. Nucleic Acids Res. 2014;42:9740–9752. doi: 10.1093/nar/gku718. [DOI] [PMC free article] [PubMed] [Google Scholar]
- 20.Deng W., Rupon J.W., Krivega I. Reactivation of developmentally silenced globin genes by forced chromatin looping. Cell. 2014;158:849–860. doi: 10.1016/j.cell.2014.05.050. [DOI] [PMC free article] [PubMed] [Google Scholar]
- 21.Sankaran V.G., Menne T.F., Xu J. Human fetal hemoglobin expression is regulated by the developmental stage-specific repressor BCL11A. Science. 2008;322:1839–1842. doi: 10.1126/science.1165409. [DOI] [PubMed] [Google Scholar]
- 22.Sankaran V.G., Xu J., Ragoczy T. Developmental and species-divergent globin switching are driven by BCL11A. Nature. 2009;460:1093–1097. doi: 10.1038/nature08243. [DOI] [PMC free article] [PubMed] [Google Scholar]
- 23.Zhou D., Liu K., Sun C.W. KLF1 regulates BCL11A expression and gamma- to beta-globin gene switching. Nat Genet. 2010;42:742–744. doi: 10.1038/ng.637. [DOI] [PubMed] [Google Scholar]
- 24.Jiang J., Best S., Menzel S. cMYB is involved in the regulation of fetal hemoglobin production in adults. Blood. 2006;108:1077–1083. doi: 10.1182/blood-2006-01-008912. [DOI] [PubMed] [Google Scholar]
- 25.Xu X.S., Hong X., Wang G. Induction of endogenous gamma-globin gene expression with decoy oligonucleotide targeting Oct-1 transcription factor consensus sequence. J Hematol Oncol. 2009;2:15–26. doi: 10.1186/1756-8722-2-15. [DOI] [PMC free article] [PubMed] [Google Scholar]
- 26.Trakarnsanga K., Wilson M.C., Lau W. Induction of adult levels of β-globin in human erythroid cells that intrinsically express embryonic or fetal globin by transduction with KLF1 and BCL11A-XL. Haematologica. 2014;99:1677–1685. doi: 10.3324/haematol.2014.110155. [DOI] [PMC free article] [PubMed] [Google Scholar]
- 27.Thein S.L., Menzel S., Lathrop M. Control of fetal hemoglobin: new insights emerging from genomics and clinical implications. Hum Mol Genet. 2009;18(R2):R216–R223. doi: 10.1093/hmg/ddp401. [DOI] [PMC free article] [PubMed] [Google Scholar]
- 28.Xu J., Peng C., Sankaran V.G. Correction of sickle cell disease in adult mice by interference with fetal hemoglobin silencing. Science. 2011;334:993–996. doi: 10.1126/science.1211053. [DOI] [PMC free article] [PubMed] [Google Scholar]
- 29.Roosjen M., McColl B., Kao B. Transcriptional regulators Myb and BCL11A interplay with DNA methyltransferase 1 in developmental silencing of embryonic and fetal β-like globin genes. FASEB J. 2014;28:1610–1620. doi: 10.1096/fj.13-242669. [DOI] [PubMed] [Google Scholar]
- 30.Renella R., Perlov A., Harris C.E. Hematopoietic SIN lentiviral micro RNA-mediated silencing of BCL11A: Pre-clinical evidence for a sickle cell disease gene-therapy trial. ASH Annu Meet Abstr. 2012;120:753. [Google Scholar]
- 31.Guda S, Peng D, Bauer DE, et al. Optimization of lentivirus vector RNA polymerase IId microRNA embedded shRNAs for enhanced processing and efficient knockdown of Bcl11a for induction of fetal hemoglobin in erythroid cells. In: Proceedings, American Society for Gene and Cell Therapy 19th Annual Congress, May 23, 2014:532.
- 32.Guda S., Brendel C., Renella R. miRNA-embedded shRNAs for lineage-specific BCL11A knockdown and hemoglobin F induction. Mol Ther. 2015;23:1465–1474. doi: 10.1038/mt.2015.113. [DOI] [PMC free article] [PubMed] [Google Scholar]
- 33.Lozzio C.B., Lozzio B.B., Machado E.A. Effects of sodium butyrate on human chronic myelogenous leukaemia cell line K562. Nature. 1979;281:709–710. doi: 10.1038/281709b0. [DOI] [PubMed] [Google Scholar]
- 34.Lampronti I., Bianchi N., Borgatti M. Accumulation of gamma-globin mRNA in human erythroid cells treated with angelicin. Eur J Haematol. 2003;71:189–195. doi: 10.1034/j.1600-0609.2003.00113.x. [DOI] [PubMed] [Google Scholar]
- 35.Fibach E., Bianchi N., Borgatti M. Mithramycin induces fetal hemoglobin production in normal and thalassemic human erythroid precursor cells. Blood. 2003;102:1276–1281. doi: 10.1182/blood-2002-10-3096. [DOI] [PubMed] [Google Scholar]
- 36.Bianchi N., Finotti A., Ferracin M. Increase of microRNA-210, decrease of raptor gene expression and alteration of mammalian target of rapamycin regulated proteins following mithramycin treatment of human erythroid cells. PLoS One. 2015;10:e6121567. doi: 10.1371/journal.pone.0121567. [DOI] [PMC free article] [PubMed] [Google Scholar]
- 37.Finotti A., Bianchi N., Fabbri E. Erythroid induction of K562 cells treated with mithramycin is associated with inhibition of raptor gene transcription and mammalian target of rapamycin complex 1 (mTORC) functions. Pharmacol Res. 2015;91:57–68. doi: 10.1016/j.phrs.2014.11.005. [DOI] [PMC free article] [PubMed] [Google Scholar]
- 38.Zajac-Kaye M., Brown E., Friend C. Induction of differentiation in Friend erythroleukemia cells with dimethyl sulfoxide, hexamethylene bisacetamide and sodium butyrate is not accompanied by changes in proviral DNA or its expression. Virus Res. 1986;6:45–55. doi: 10.1016/0168-1702(86)90056-0. [DOI] [PubMed] [Google Scholar]
- 39.Gambari R., Marks P.A., Rifkind R.A. Murine erythroleukemia cell differentiation: Relationship of globin gene expression and of prolongation of G1 to inducer effects during G1/early S. Proc Natl Acad Sci U S A. 1979;76:4511–4515. doi: 10.1073/pnas.76.9.4511. [DOI] [PMC free article] [PubMed] [Google Scholar]
- 40.Banan M. Hydroxyurea treatment in β-thalassemia patients: to respond or not to respond? Ann Hematol. 2013;92:289–299. doi: 10.1007/s00277-012-1671-3. [DOI] [PubMed] [Google Scholar]
- 41.Brognara E., Lampronti I., Breveglieri G. C(5) modified uracil derivatives showing antiproliferative and erythroid differentiation inducing activities on human chronic myelogenous leukemia K562 cells. Eur J Pharmacol. 2011;672:30–37. doi: 10.1016/j.ejphar.2011.09.024. [DOI] [PMC free article] [PubMed] [Google Scholar]
- 42.Vadolas J., Wardan H., Orford M. Cellular genomic reporter assays for screening and evaluation of inducers of fetal hemoglobin. Hum Mol Genet. 2004;13:223–233. doi: 10.1093/hmg/ddh023. [DOI] [PubMed] [Google Scholar]
- 43.Skarpidi E., Vassilopoulos G., Li Q., Stamatoyannopoulos G. Novel in vitro assay for the detection of pharmacologic inducers of fetal hemoglobin. Blood. 2000;96:321–326. [PubMed] [Google Scholar]
- 44.Peterson K.R., Costa F.C., Fedosyuk H. A cell-based high-throughput screen for novel chemical inducers of fetal hemoglobin for treatment of hemoglobinopathies. PLoS One. 2014;9:e107006. doi: 10.1371/journal.pone.0107006. [DOI] [PMC free article] [PubMed] [Google Scholar]