Abstract
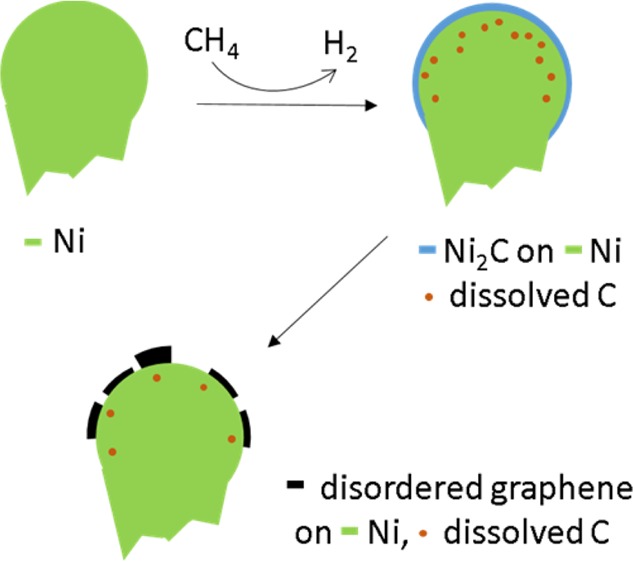
In order to simulate solid-oxide fuel cell (SOFC)-related coking mechanisms of Ni, methane-induced surface carbide and carbon growth was studied under close-to-real conditions by synchrotron-based near-ambient-pressure (NAP) X-ray photoelectron spectroscopy (XPS) in the temperature region between 250 and 600 °C. Two complementary polycrystalline Ni samples were used, namely, Ni foam—serving as a model structure for bulk Ni in cermet materials such as Ni/YSZ—and Ni foil. The growth mechanism of graphene/graphite species was found to be closely related to that previously described for ethylene-induced graphene growth on Ni(111). After a sufficiently long “incubation” period of the Ni foam in methane at 0.2 mbar and temperatures around 400 °C, cooling down to ∼250 °C, and keeping the sample at this temperature for 50–60 min, initial formation of a near-surface carbide phase was observed, which exhibited the same spectroscopic fingerprint as the C2H4 induced Ni2C phase on Ni(111). Only in the presence of this carbidic species, subsequent graphene/graphite nucleation and growth was observed. Vice versa, the absence of this species excluded further graphene/graphite formation. At temperatures above 400 °C, decomposition/bulk dissolution of the graphene/graphite phase was observed on the rather “open” surface of the Ni foam. In contrast, Ni foil showed—under otherwise identical conditions—predominant formation of unreactive amorphous carbon, which can only be removed at ≥500 °C by oxidative clean-off. Moreover, the complete suppression of carbide and subsequent graphene/graphite formation by Cu-alloying of the Ni foam and by addition of water to the methane atmosphere was verified.
1. Introduction
Carbon surface and interface chemistry represents one of the fastest evolving and expanding research areas, primarily due to the extraordinary physicochemical properties of its nanomodifications, especially of graphene and carbon nanotube materials.1 Equally important is the function of carbon in heterogeneous catalysis, where it can be used as tailor-made support with distinct morphological and surface-chemical properties.2 A particularly important topic regarding the role of carbon in catalysis is connected with metal–carbon interaction, which has been shown to influence the catalytic activity and selectivity of the catalytic entity, as shown, e.g., for vinyl acetate synthesis.3 This necessarily also includes studies on carbon adsorption, (bulk) migration, metal–carbon compound formation, and carbon dissolution in metals. It has, for example, been shown how dissolved carbon controls the initial stages of nanocarbon growth4 or how a complex surface–bulk diffusional equilibrium affects the structural and electronic properties of the near-surface regions of Pd metal and, in turn, the adsorption and dehydrogenation of ethene.5 Particularly well-studied is the interaction of different carbon species with various Ni surfaces in reforming processes. With respect to the carbon source, in most cases, this includes the use of methane, as methane dissociation is an important reaction step in the chemical industry. The steam-reforming process transforms methane to synthesis gas (CO and H2), which is of paramount importance for the further reaction to various chemical products. As this is usually performed over supported Ni catalysts, knowledge about the elementary reaction steps of methane dissociation, adsorption/deposition as different (near)-surface species, and finally the specific reactivities of the latter is imperative. Methane chemisorption has been studied on a number of metal surfaces and also different crystal facets of Ni, and data on the thermal and molecular beam deduced sticking coefficients are readily available.6,7 The most interesting feature, which has so far only been studied on well-defined Ni single-crystalline samples using ethylene or acetylene as a carbon source, refers to the preferential growth of carbidic and graphene C species after dissociative hydrocarbon adsorption.8 Usually performed at high temperatures (400–650 °C), the corresponding hydrocarbon species is decomposed and atomic carbon diffuses into the Ni surface. Upon reaching a carbon content of ∼0.45 ML, the Ni surface reconstructs and forms a surface carbide of composition Ni2C.9 The formation, stability, and reactivity of this phase are of particular importance for the subsequent formation of the recently well-studied graphene/graphite layers. The formation mechanism of the latter in the presence (or in expense) of the carbide, and the particular structural role of the carbide for graphene growth, is controversially discussed.10−12 Patera et al.11 discuss a temperature-dependent graphene growth mechanism in ethylene, switching from in-plane single layer (previously introduced by12) or two-layer carbide conversion below ∼500 °C to a direct conversion mechanism without intermediate carbide above 500 °C. Whereas at T < 500 °C only epitaxial unrotated graphene directly attached to bulk Ni(111) was observed after conversion, both rotated and unrotated graphene domains were observed above 500 °C. Alternatively, simultaneous presence of Ni2C and rotated graphene domains as a layered structure, resulting from toluene decomposition, has been reported, identifying Ni2C as a source of graphene grain rotation.13
The limited applicability of these studies to real (electrode) catalytic processes arises from the fact that they are exclusively performed on highly ordered, single crystalline model systems with particularily “sticky” hydrocarbon molecules such as ethene. Related experiments on realistic systems with more “open”, structurally imperfect, and thus more “bulk diffusion friendly” surfaces appear to be still scarce. Also, the use of technologically more relevant carbon source molecules, especially of methane, is interesting.
Hence, our primary aim is to present a thorough study of methane dissociation and carbon growth, suppression and dissolution on a porous Ni foam sample and polycrystalline Ni foil. Since C deposition and whisker growth is a serious issue also on Ni/YSZ cermet anodes of SOFCs,14 the Ni foam sample is also regarded as a model system for the interconnected bulk Ni network of the commercial Ni/YSZ cermet materials, exhibiting mesoscopic porosity and a high fraction of curved surface area. A major problem of Ni/YSZ cermet anodes, especially upon “dry” admission of the hydrocarbon fuel to the cell at typical operation temperatures above 600 °C, is the ability of Ni to incorporate and resegregate large amounts of carbon into/out of its structure, eventually inducing the growth of carbon filaments and in turn causing electrode failure by anode fracture and short-circuiting of the entire cell.14
To overcome the much lower sticking probability of methane (as compared to ethene, etc.), near ambient pressure XPS spectroscopy (NAP-XPS) is the appropriate technique, since methane pressures up to 1 mbar can be used and the growth process can be studied under close-to-real conditions in situ. Ni-coking is more an issue, the slower the deposited carbon is reacted off the Ni surface either by direct electrooxidation at the three-phase boundary or by internal reforming of methane with water toward CO/H2. Hence, particular emphasis will also be given to eventual and substantial suppression of carbon growth by directional surface doping and chemical modification. In the present contribution, these will include doping of the Ni surface with Cu and adding steam to the reaction mixture. The Ni foil was used as a reference sample covering the “materials” gap between Ni single crystals and the foam.
2. Experimental Section
The in situ NAP-XPS system15 at the beamline ISISS-PGM of BESSY II allowed us to perform in situ photoelectron spectroscopy up to 1 mbar total reactant pressure. It is equipped with differentially pumped electrostatic lenses and a SPECS hemispherical analyzer. The sample is positioned inside the near ambient-pressure chamber 2 mm away from a 1 mm aperture, which is the entrance to the lens system separating gas molecules from photoelectrons. Binding energies (BEs) were generally referred to the Fermi edge recorded after each core level measurement. In general, equal photoelectron kinetic energy and thus information depth for the different XPS signals was realized by tuning the photon energy (monochromator) to the respective value. The respective photon energy dependent XPS cross sections were derived from ref (16).
Samples were mounted on a transferable sapphire holder. The temperature was measured by a K-type chromel/alumel thermocouple spot-welded to the side of the sample, and temperature-programmed heating was ensured by an IR laser from the rear. In the case that the Ni-foam was investigated, it was heated indirectly from the back via a Ni foil support, making sure that the latter was geometrically “invisible” for the spectrometer. The initial sample cleaning procedure consisted of repeated cycles of Ar+ sputtering for 15 min at room temperature, exposure to 0.2 mbar O2 at 500 °C, followed by exposure to 0.2 mbar H2 at 500 °C, and in some cases an additional flash anneal cycle to ∼650 °C in a vacuum. After this treatment, cleanliness was checked by XPS. In order to induce carbon growth at the surface, the sample was then exposed to 0.2 mbar methane within ∼15 min at 400 °C. The temperature was thereafter lowered to and kept at 250 °C (still at 0.2 mbar) for 30 min. Eventually the methane pressure was decreased to 0.02 mbar in order to follow the carbon growth kinetics with sufficient time resolution.
In order to prepare a Ni:Cu = 1:1 near surface alloy, 5 ML of Cu were thermally evaporated by means of an electron beam PVD source. Stepwise annealing up to 400 °C in UHV allowed an ∼1:1 atomic Ni:Cu ratio to be attained within the near-surface layers, as derived from the ratio of the cross-section-corrected Ni 2p and Cu 2p areas.
3. Results
3.1. Growth of Distinct Carbonaceous Species on Ni Foam and Ni Foil in Clean CH4
As already outlined in the Introduction section and will be further discussed below, the role of the surface carbide for the subsequent growth of the graphene/graphite layers was not fully understood. On this basis and to induce the relevant surface species under question, dedicated pretreatments in methane with respect to sample temperature and methane partial pressure were chosen. After the cleaning procedure, the carbon supersaturation of the near-surface regions, being inevitable to induce the subsequent growth of both carbidic and graphene carbon species, was provided. The respective detailed experimental procedure is described in the preceding Experimental Section.
Figure 1 shows the XPS spectra of methane-induced carbon growth on the Ni foam at 0.02 mbar in the temperature range around 250 °C after the above-described pretreatment. As can be deduced from the translational/rotational and surface temperature resolved molecular beam adsorption study on Ni(100) by Chorkendorff et al.,7 under the experimental conditions presented in this work, a lower limit of the thermal sticking coefficient stherm of methane between 10–7 and 10–8 can be estimated for exposures around 250 °C, whereas, for the pretreatment at 400 °C, stherm is estimated to be ∼10–6. Likely, the structural “openness” of the foam surface and the simultaneous influence of the intense X-ray beam favor a higher sticking probability. At a pressure of 0.2 mbar/20 Pa, the impingement rate of CH4 amounts to ∼7 × 1019 cm–2 s–1 at ∼100 °C estimated gas temperature between nozzle and sample surface. With an assumed sticking probability stherm around 10–6 at 400 °C and 10–7 at 250 °C, this corresponds to a carbon deposition rate of ∼7 × 10¹⁴ and ∼7 × 10¹³ C atoms cm–2 s–1, respectively. Assuming a mean number density of ∼2 × 10¹⁵ Ni atoms/cm2, this yields ∼0.35 ML s–1 carbon for 15 min at 400 °C and ∼0.035 ML s–1 for 30 min at 250 °C. In total, the sample was already exposed to ∼380 ML carbon before reducing the methane pressure to 0.02 mbar, which is regarded as an important prerequisite for sufficient supersaturation of the near-surface regions with dissolved C. In comparison, Patera et al.11 used ∼5 × 10⁻⁷ mbar ethylene as a carbon source on Ni(111) at 400 °C and observed almost immediate formation of the Ni2C surface carbide. However, in order to induce the onset of graphene growth, a further 14 min at 400 °C were required, corresponding to roughly 100 ML carbon “preexposure”.
Figure 1.
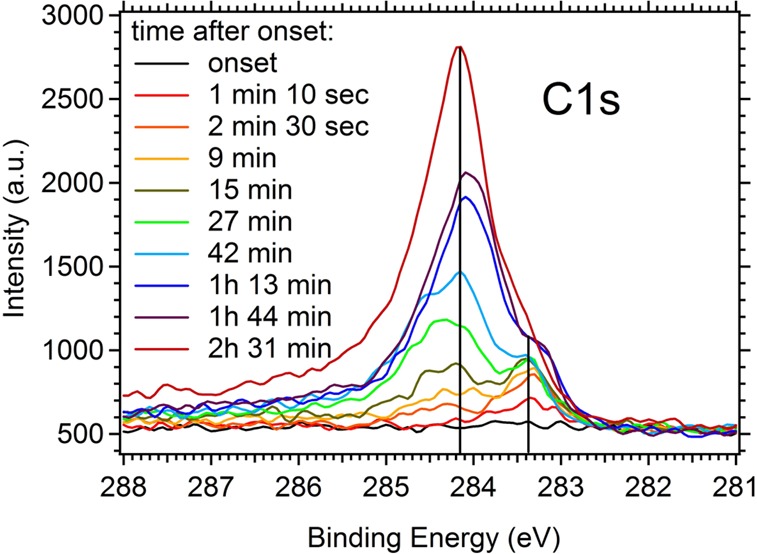
Selected in situ X-ray photoelectron spectra of the C 1s region obtained during exposure of the Ni foam to 0.02 mbar methane at 250 °C at a photon energy of 425 eV. Sample pretreatment: Heating in O2 to 500 °C (0.1 mbar), followed by reduction in hydrogen at 500 °C (0.1 mbar), switching to methane at 400 °C (0.2 mbar), cooling in methane to 250 °C (0.2 mbar). After this pretreatment routine, the methane pressure was reduced to 0.02 mbar at 250 °C to obtain a better time resolution of the carbide/graphene/graphitic carbon growth process. The gas phase signal was deliberately suppressed by applying a voltage of −10 V between the sample and the nozzle to the differentially pumped lens system. This leads to a moderate increase in noise signal, but the gas phase contribution is largely suppressed.
After an additional isothermal period at 0.02 mbar and 250 °C for a further 30 min, corresponding to 6 additional ML of carbon, the last spectrum without measurable carbon intensity with respect to the unequivocal presence of either carbidic or graphite/graphene species in the near-surface regions (termed “onset”) could be collected. Reduction of the methane pressure turned out to be essential to follow the kinetics of carbon growth in a resolvable time scale by XPS, as will be shown below. After a short period of time (84 s), a small carbon feature at a binding energy of 283.3 eV appears, which increases with further exposure time, as indicated in Figures 1 and 2. This feature is found at almost exactly the same BE position as the species indicated by Weatherup et al.9 on polycrystalline Ni films and Patera et al.11 on Ni(111) after exposure to ethylene (283.2 eV). It was originally associated in ref (9) with the presence of distinctly bonded carbon atoms on the Ni surface, but subsequently in ref (11), it was reassigned (on the basis of complementary STM and LEED) to carbon within the Ni2C clock reconstructed surface carbide. It is worth noting that, a few minutes after the appearance of this first feature, a second component at higher binding energy arises. This species, found at ∼284.2 eV, steeply increases upon raising exposure time and is assigned in analogy to ref (11) to sp2-hybridized graphene/graphitic carbon. In contrast, the carbidic species reaches saturation after roughly 20 min (growing to ∼80% intensity in 7 min and slowly saturating after 20 min), while the graphene/graphitic signal still grows. This trend is even valid for prolonged exposure times, although the growth rate of the graphite/graphene species slows down (after 2 h 30 min, Figure 1 last spectrum and Figure 6).
Figure 2.
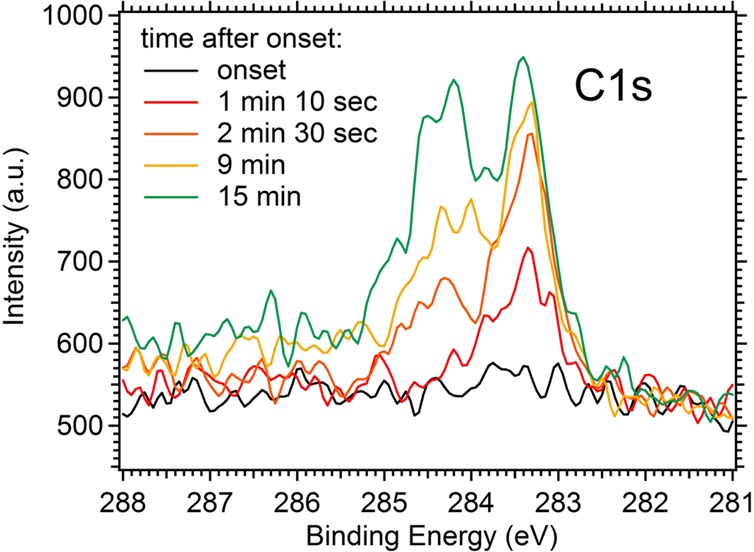
Detailed view of in situ XPS spectra shown in Figure 1, highlighting the initial stages of simultaneous carbide/graphene growth. Experimental conditions as outlined in Figure 1.
Figure 6.
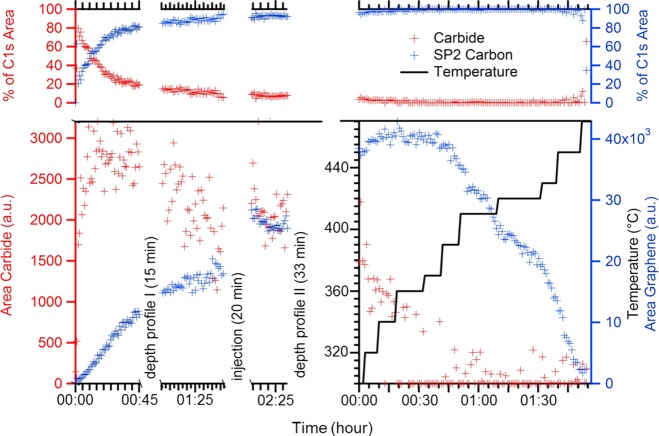
Plot of the relative contribution of carbidic precursor and the graphene/graphite layer to the total carbon signal (above) and plot of the total C 1s carbide and graphene/graphite area (below) during growth and dissolution. Note that the temperature during growth (left panel) is 250 °C but that the temperature is ramped during the dissolution process (right panel). Different intensity scales have been used for carbide and graphite C 1s areas.
Interestingly, upon apparent suppression of the carbide signal after longer exposure times and in particular at higher temperatures, the further graphene/graphite growth stagnates. Dissolution of the carbide into the Ni bulk, along with a possible damping effect of graphite/graphene overlayers with respect to the photoelectrons from the coexisting carbide species, will be discussed below (cf. Figure 6).
We note as a general observation that the presence of a sufficiently intense carbidic “precursor” signal is quite obviously a prerequisite both for the appearance and for the growth of the second, graphene/graphitic, species. The growth of the latter has never been observed in any of our experiments—which were all conducted well below 500 °C—without the simultaneous presence of “carbon-rich” carbide. This is again in agreement with the in situ data by Patera et al.,11 showing that a clean Ni(111) surface exposed to ethylene below 500 °C predominantly shows an initial Ni2C reconstruction, which converts into monolayer graphene either via an in-plane mechanism12 or via an additionally discussed two-layer “carbon-rich” carbide–graphene conversion mechanism.11 As, upon several attempts to induce graphene/graphite growth under slightly altered conditions, a rather weak carbide precursor signal was occasionally observed, but subsequently decreased again and vanished shortly after observation without any graphene/graphite nucleation, we suggest that the carbidic precursor needs to reach a certain concentration to become both stable and sufficiently C-supersaturated to allow for graphene/graphite nucleation. In summary, if the precursor is present in a sufficiently C-rich form, it apparently acts as a template for the subsequent growth of graphene/graphite. If the temperature exceeds 350 °C but stays below 400 °C, the carbidic precursor is preferentially dissolved (see also Figure 6); however, the graphene/graphite layers stay intact without further growth. If this “graphene/graphite-only” state is recooled to the initial temperature conditions of precursor growth, no carbide and, thus, no additional graphite/graphene can grow. Only if the carbon is quantitatively removed from the surface, the carbidic precursor can grow again.
To highlight the initial stages of graphene nucleation, the XPS spectra showing the coexistence of carbidic and graphene/graphitic carbon are shown in Figure 2 in more detail. The evolution of the second carbon component is clearly visible, as well as the beginning saturation of the carbidic precursor species. We also note that, upon increasing the temperature well above 350 °C, the formation of the carbidic precursor species is effectively suppressed also on the clean Ni surface, at least on the time scale of our experiments.
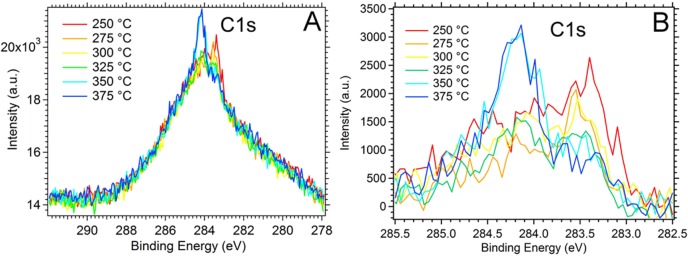
For comparison, Figure 3 shows the corresponding experiments on a polycrystalline Ni foil. Sample pretreatment is exactly the same as specified for the Ni foam. After the pretreatment, the carbidic precursor signal is already present at 250 °C (“onset” spectrum at 0 min, at a binding energy of 283.4 eV), although this time it obviously coexists with a comparably large amount of amorphous (or “adventitious”) carbon with respect to carbidic/graphene/graphite species (∼0.5 ML vs ∼0.1 ML), as indicated by the broad background with an intensity maximum around 284.0 eV. However, compared to the Ni 2p signal, this represents only modest amounts: the total C 1s signal corresponds to ∼0.6 ML. With increasing sample temperature and time, the small fraction of the graphene/graphitic carbon species at 284.2 eV increases and the carbidic precursor is decomposed. Again, in this stage, the further growth of the graphene/graphitic type carbon is inhibited, in full analogy to the foam material. Note that the decrease of the carbidic precursor is most likely due to decomposition and not just due to photoelectron shielding by the other, coexisting, carbon species, as the total amount of the latter is far too low to fully shield the carbide species, even if they were part of a “layered” scenario (using the overlayer model described in the Discussion section with an integral carbon coverage of ∼0.6 ML). Obviously, the “adventitious” carbon of the strongly dominant background signal represents a comparably unreactive form of carbon. It is quickly formed already at the beginning of the methane exposure but then essentially remains unaltered up to the highest temperature (375 °C). As all experimental parameters were exactly the same as, e.g., in the foam experiments of Figures 1 and 2, where hardly any contribution of the adventitious carbon is detectable, its far higher abundance on the foil presently remains unclear. It may be related to poorer carbon bulk diffusion properties of the foil sample (high temperature treated metal foils frequently exhibit large grains with low-index terminal crystallite faces such as (111) and (100), and only a small fraction of curved (high-index) surfaces). Since it covers a very broad BE range, not only structural but also strong chemical heterogeneity (possibly also from C–O containing species around 287 eV at a lower amount to carbidic contributions around 281 eV) can be assumed.
Figure 3.
In situ X-ray photoelectron spectra of the C 1s region obtained during exposure of the Ni foil to 0.02 mbar methane at the indicated temperatures after sample pretreatment as described in Figure 1. Photon energy: 425 eV. Amorphous background shown (A) and subtracted from spectra (B) as it does not participate in the carbide/graphene kinetics in the chosen temperature region.
In order to evaluate thermally induced changes and the overall stability of the graphene/graphite species growing at around 250–300 °C on the foam sample, the evolution of the C 1s, Ni 2p, and O 1s spectra was measured in 0.02 mbar pure methane in the temperature range from 250 to 600 °C.
As shown in Figure 4A, up to 300 °C, no nucleation of graphene/graphite took place on the (in the case of Figure 4 shorter) experimental time scale (only carbidic carbon at 283.4 eV, hardly any intensity at 284.2 eV). At and above 300 °C, the sudden onset and fast growth of graphene/graphitic carbon leads to a maximum intensity of the 284.2 eV signal (350 °C spectrum). Above 350 °C, this intensity trend is reversed, and at 450 °C, a clear decrease of the graphene/graphite related intensity is already observable. Complete loss of the graphene/graphite signal is eventually observed at and above 550 °C. Note that in comparison to Figure 1 a relatively higher amount of unreactive adventitious carbon has been observed (detailed discussion with respect to Figure 3). Although unreactive and obviously not participating in the reaction, this difference might arise from the frequency of methane supply line purging, leading to variable cleanliness of the latter. The trend of the related O 1s spectra (Figure 4C) indicates little changes up to 400 °C, but at and above 450 °C, the oxygen content of the surface increases, despite the pure methane atmosphere. We assign this increase to segregation of predissolved oxygen from the Ni bulk, since the initial cleaning treatment involved oxidation at elevated pressures and temperatures (0.2 mbar O2 treatment at 500 °C followed by H2) but no subsequent vacuum annealing to 650 °C. Note that the O 1s peak only develops one single component at ∼529.5 eV, excluding hydroxylated forms of Ni2+, which were clearly observed in the methane/water experiments described in section 3.3. The increasing oxidation of the surface is also reflected in the corresponding Ni 2p spectra (Figure 4B) by slight changes of the satellite region around 858 eV. A changed weighting of the 852.7 eV + 3.7 eV and + 6 eV satellites (surface plasmon related, see ref (17)) due to adsorbed oxygen appears likely on the basis of similar Ni 2p spectra obtained after O2 chemisorption.18 Alternatively, a small contribution of surface NiO (at ∼855.5 eV) could also contribute to the observed changes.19−21
Figure 4.
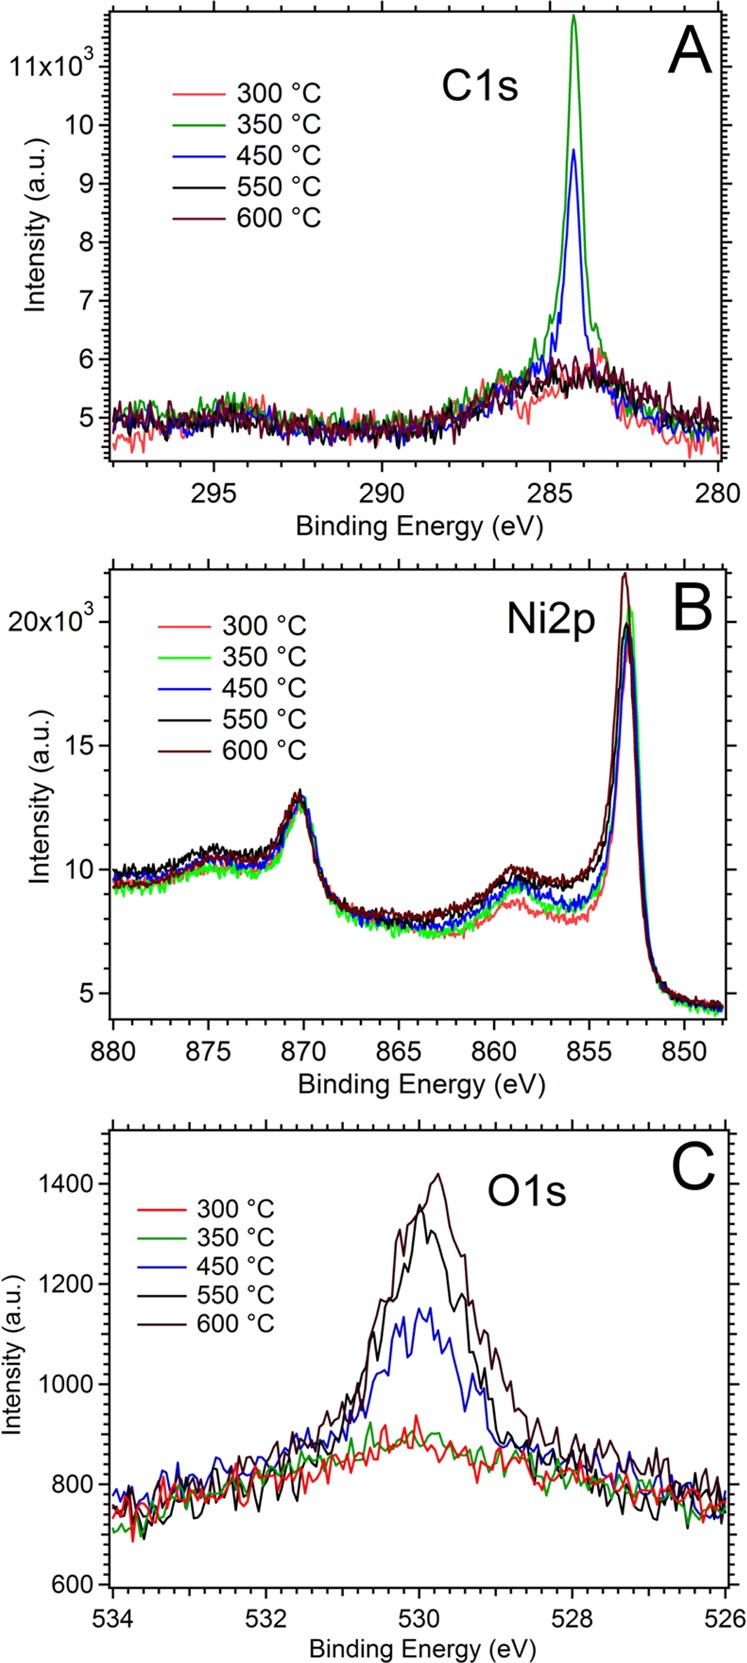
In situ X-ray photoelectron spectra of the C 1s (A), Ni 2p (B), and O 1s (C) regions obtained during exposure of the Ni foam to 0.02 mbar methane at the indicated temperatures after the standard sample pretreatment described in Figure 1. Photon energies: 425 eV (C 1s), 1010 eV (Ni 2p), 680 eV (O 1s). Collecting one set of C 1s, Ni 2p, and O 1s at a given temperature takes ca. 30 min.
The general conclusion from Figure 4 is that a combination of C dissolution at T ≥ 400 °C and clean off by oxygen, becoming mobile above 450 °C, can cause the observed decrease of the C 1s signal. That C redissolution is an active process already at temperatures around 400 °C will be shown in more detail in the following section in the context of Figures 5 and 6.
Figure 5.
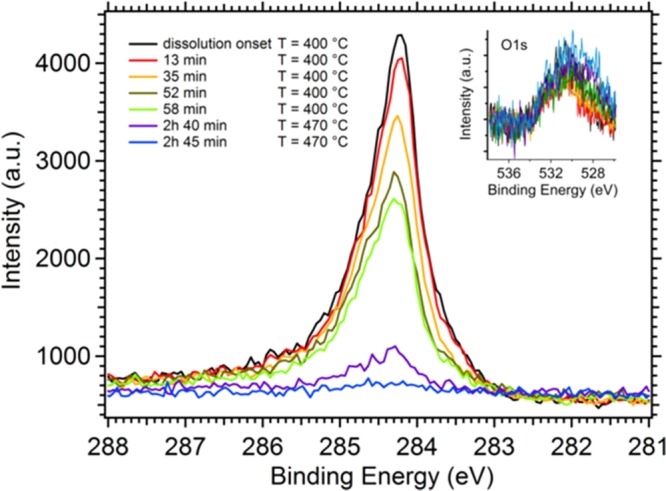
In situ X-ray photoelectron spectra of the C 1s region obtained during exposure of the initially graphene/graphite covered Ni foam to 0.02 mbar methane at sample temperatures between 390 and 470 °C. Sample cleaning pretreatment in O2/H2 as in Figure 1, followed by an additional thermal annealing step in a vacuum at 650 °C. Afterward, exposure to 0.2 mbar methane at 500 °C, cooling to 250 °C, and exposure to 0.02 mbar methane until the full graphene/graphite C 1s intensity at 284.3 eV was reached. The photon energy for C 1s and for O 1s was 425 and 680 eV, correspondingly. The O 1s spectra are shown as an inset.
3.2. Carbon Dissolution
Equally interesting as the growth of the different carbon species is the fate of each of these at higher temperatures, in particular the predominant mechanism of removal. Possible pathways are decomposition/dissolution and/or reactive clean-off by resegregation of dissolved oxygen, as discussed above. The latter was deliberately diminished in the experiments of Figures 5 and 6 by applying an additional thermal annealing step at 650 °C in a vacuum after the oxygen/hydrogen cleaning treatment at 500 °C. During the subsequent heating experiments of the Ni foam and Ni foil samples, both were treated in 0.02 mbar pure methane during the entire experiment while recording the C 1s spectra. To ensure the reduced oxygen resegregation, additional O 1s spectra between the initial 390 °C and after almost complete C dissolution at 470 °C were also recorded, which are shown as an inset in Figure 5 and show a rather small and constant intensity (in contrast to Figure 4C).
Starting out with the maximum graphene/graphite coverage obtained at 250 °C on the Ni foam (similar initial state as the red spectrum after 2 h 31 min in Figure 1, with a still visible 283.4 eV shoulder of the carbidic precursor contribution), further increase of the temperature to 390 °C at first leads to the complete dissolution of the precursor, as confirmed by the loss of the shoulder. The intensity of the graphene/graphitic carbon component then stagnates at around 390 °C. Therefore, the 390 °C spectrum in Figure 5 is associated with the “onset temperature” of the dissolution process. Above 400 °C, the intensity of the sp2-hybridized graphene/graphitic component starts to shrink as well. Note that the temperature was switched from 390 to 410 °C and then back to 400 °C before it was finally increased to 470 °C. The purpose of this temperature loop was to accurately determine the thermal stability range of the graphene/graphitic carbon species. At 390 °C, it is still stable but clearly starts to decompose at 410 °C (red and orange spectra). Therefore, the temperature was lowered to 400 °C to deliberately slow down the decomposition process. As can be seen by comparison of the spectra taken isothermally at 400 °C (light and olive green traces), the dissolution process becomes slower but is still progressing. Upon raising the temperature to 470 °C, the process strongly accelerates, leading to almost complete decomposition/dissolution of the initial graphene/graphite coverage after 2 h 45 min at this temperature.
Figure 6 shows the evolution of carbide and graphene/ite on the Ni foam sample as the percentage of the C 1s signal (above) and as the total component area (below). Initially, very fast formation of the carbidic precursor is observed (in 7 min to 80% of maximum carbide signal, reaching a maximum after ∼20 min). After the carbide signal reaches ∼80% of its maximal intensity, slow growth of the graphene/ite component takes place (Figure 2: the 15 min mark corresponds to Figure 6 upper panel: crossing point of the red and blue percentage curves). With progressing graphene/graphite growth at a constant temperature of 250 °C, a slow decrease of the carbide signal is observed. After ∼3 h (corresponding to time 00:00 on the right side panel) at a isothermal temperature of 250 °C, the graphene signal almost approaches its maximum intensity. At this point, the damping of the carbide signal and/or conversion into graphene is about 50%. From a comparison with a damping calculation based on a surface layer XPS model (ref (24)), a maximum damping effect of 60% is to be expected. The damping calculation is based on a “layered” growth model (ref (13)). In comparison, the damping effect of graphene/ite and amorphous carbon on the foil (∼0.6 ML total C) should be 24% using the same calculation (as the data are normalized to the cross section, a direct and comparative judgment is now possible). Note that an in plane conversion model (as suggested in ref (11)) would cause a similar effect by replacement of carbide by graphene. The data presented in Figure 6 therefore do not allow one to distinguish between these mechanistic scenarios quantitatively. In principle, a superposition of a damping overlayer and the in plane conversion mechanism is conceivable.
Author: After starting the temperature-programmed experiments, the eventual loss of carbide intensity (03:00 h + 00:45 h, temperature increase from 370 to 390 °C) can be clearly assigned to full carbide dissolution and/or conversion to graphene. Only if a temperature of 400 °C is exceeded, the dissolution of graphene starts and is complete at 03:00 h + 02:00 h at 470 °C despite ongoing supply of CH4 from the gas phase. As stated above, deliberate acceleration and slowing down of the dissolution process can be achieved by changing the annealing temperature, provided the critical temperature of 390 °C is overcome (Figure 5). Isothermal treatments at 420 °C therefore cause a slower dissolution, a temperature increase to 430–450 °C a strong acceleration of carbon dissolution.
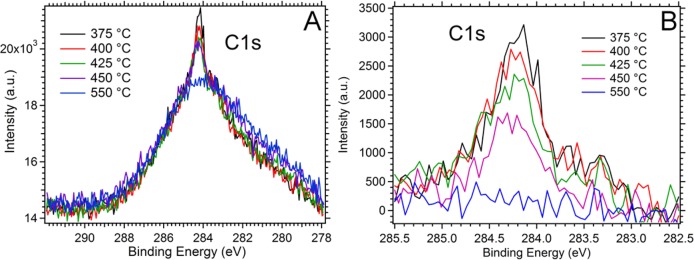
Figure 7 shows the analogous C dissolution experiment on the Ni foil, whereby the temperature range was extended to 375–550 °C. Just as in the related growth experiment of Figure 3, the intensity contribution of unreactive adventitious carbon is much more pronounced than on the foam sample. Nevertheless, the carbide component is clearly missing already at 375 °C, followed by a gradual decrease of the graphene/graphitic component between 400 and 550 °C. At the highest temperature, complete dissolution of the latter is established.
Figure 7.
In situ X-ray photoelectron spectra of the C 1s region obtained during exposure of the initially graphene/graphite/amorphous carbon-covered Ni foil to 0.02 mbar methane at sample temperatures between 375 and 550 °C. Sample cleaning pretreatment in O2/H2 as in Figure 1, followed by an additional thermal annealing step in a vacuum at 650 °C. Afterward, exposure to 0.2 mbar methane at 500 °C, cooling to 250 °C, and exposure to 0.02 mbar methane until full graphene/graphite/amorphous C 1s intensity was reached. Photon energy 425 eV. Amorphous background shown (A) and subtracted from spectra (B) as it does not participate in the carbide/graphene kinetics in the chosen temperature region.
The results of section 3.2 lead us to the general conclusions that the carbon removal process on the oxygen depleted samples is not due to a clean-off reaction with O(dissolved)/O(ads), at least not below 470 °C. The sequence in which the different types of carbon dissolve into the Ni bulk (in the continuous presence of the methane atmosphere) is, therefore, the following: The carbidic precursor is dissolved well below 390 °C, followed by the sp2-hybridized graphene/graphitic carbon at 400–470 °C. The adventitious carbon completely resists dissolution up to 550 °C and can only be removed by oxidation in O2. As a further observation, we report that reformation of the carbidic precursor after cooling back to 250 °C in 0.02 bar methane was neither possible on the (at least spectroscopically) carbon-depleted foam sample nor on the (still adventitious carbon covered) foam sample (not shown). Complete carbon removal by recycling the Ni sample in oxygen and hydrogen and thermal annealing at 650 °C in a vacuum had to be performed to re-establish the growth of the precursor species.
3.3. Suppression of Carbon Growth
As for technological applications suppression of carbon growth is of paramount importance (e.g., avoiding the formation of carbon filament on Ni-cermet anodes in solid-oxide fuel cells), the influence of selected experimental parameters on the carbon growth kinetics has also been studied. In particular, this refers to the introduction of a water partial pressure to the methane gas atmosphere and to chemical changes of the Ni surface reactivity by doping with Cu.
The effects of adding water to methane are shown in Figure 8. After the already described standard pretreatment sequence (15 min Ar+ sputtering, 0.2 mbar O2 at 500 °C, 0.2 mbar H2 at 500 °C, 0.2 mbar methane within ∼15 min at 400 °C, lowering the temperature to and keeping at 250 °C for 30 min, decreasing methane pressure to 0.02 mbar), this time a water partial pressure of 0.02 mbar was added (CH4 + H2O at 1:1 ratio, 0.04 mbar total pressure). On the same time scale and at the same temperature (250 °C) as previously used without water, neither formation of the carbidic precursor nor formation of the graphene/graphitic carbon species was observed between 250 and 300 °C. Also, a further increase of the total pressure of the 1:1 methane–water mixture from 0.04 to 0.4 mbar and variations of the temperature between 250 and 500 °C did not induce the above-described carbide to graphene/graphite growth mechanism. Rather, we observed quick formation of a small amount of adventitious carbon already in the beginning of the experiment, which remained essentially unreactive up to 500 °C (hardly any intensity variation in Figure 8A). Thus, neither a clean-off reaction of amorphous surface carbon by water (and/or its dissociation products) nor dissolution of the amorphous C in the Ni bulk take place. As the C-dissolution works well for the carbide above 350 °C and for the graphene/graphite deposits above 400 °C, the blocking of the carbide/graphene mechanism is most obvious in the 350 °C experiment. The corresponding O 1s intensity increase in Figure 8C, which is assigned to the simultaneous growth of adsorbed oxygen (and/or a partial coverage with a NiO surface oxide) together with a pronounced fraction of Ni-hydroxyl species with temperature (beyond the single O 1s peaks of Figure 4C), is most pronounced above 400 °C, which may be explained by carbon depletion of the surface by a combination of C-dissolution and reactive clean-off effects. Mass spectrometry of CO (measured in parallel) suggests that CO formation increases markedly above 500 °C; thus, the clean-off contribution seems to become stronger with increasing temperature.
Figure 8.
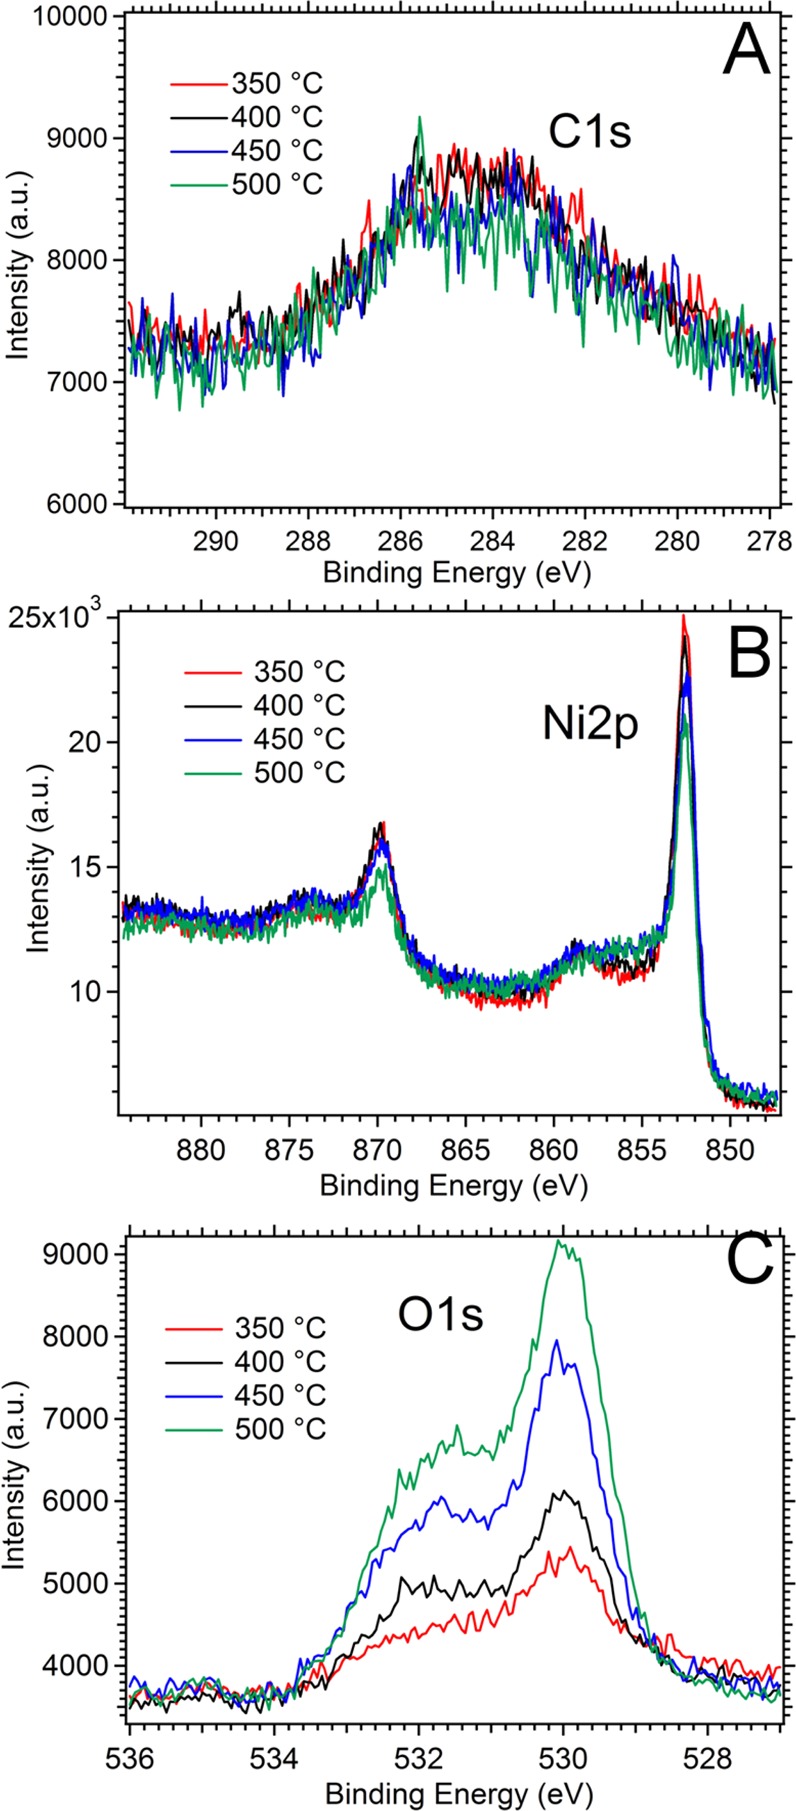
In situ X-ray photoelectron spectra of the C 1s (A), Ni 2p (B), and O 1s (C) regions obtained during exposure of the Ni foil to a mixture of methane and water (CH4 + H2O, 1:1 ratio, 0.04 mbar total pressure) at the indicated temperatures after the standard sample pretreatment described in Figure 1. Photon energies: 425 eV (C 1s), 1010 eV (Ni 2p), 680 eV (O 1s).
The component at 529.9 eV can be both O(ads) and NiO,22,23 and the high BE component at 531.7 eV is characteristic for hydroxyls on Ni.19,23 Apparently, the related oxygen species are unreactive toward the adventitious carbon residue but could be nevertheless important for the blocking of the carbide-to-graphene growth mechanism and/or clean-off of the carbidic/graphene species. The Ni surface remains largely in the metallic state, as evidenced by the related Ni 2p spectra in Figure 8B. In analogy to Figure 4B, the slight changes of the satellite region around 858 eV appear to be characteristic for the influence of chemisorbed oxygen18 and/or minute amounts of surface NiO. In essence, the Ni 2p region did not show spectral fingerprints characteristic of larger amounts of bulk NiO, NiO(OH), or Ni(OH)217,19 in any of the experiments reported in this work and only spectra characteristic of metallic Ni with slight indications of surface oxidation/oxygen/hydroxyl chemisorption were observed.
To test the potential of bimetallic doping by Cu for the suppression of carbon growth, 5 ML equivalents of Cu metal were deposited on the Ni foam at 25 °C by means of an electron-beam microevaporator (measured in situ by a quartz crystal microbalance). Subsequently, the sample was annealed in a stepwise manner to 400 °C to induce intermixing of Ni and Cu in the near-surface regions. As a result, the atomic ratio between Ni and Cu (derived from the ratio of the cross-section-corrected Ni 2p and Cu 2p signal intensities, which were measured at ∼120 eV kinetic energy to ensure maximum surface sensitivity, IMFP ∼ 0.5 nm) was determined to be ∼1:1 within the uppermost 2–3 surface layers. After the standard sample pretreatment and methane preexposure as described in Figure 1, no carbon formation of any kind could be observed during the subsequent exposure to 0.02 mbar pure methane between 250 and 600 °C on a comparable time scale, as shown in Figure 9.
Figure 9.
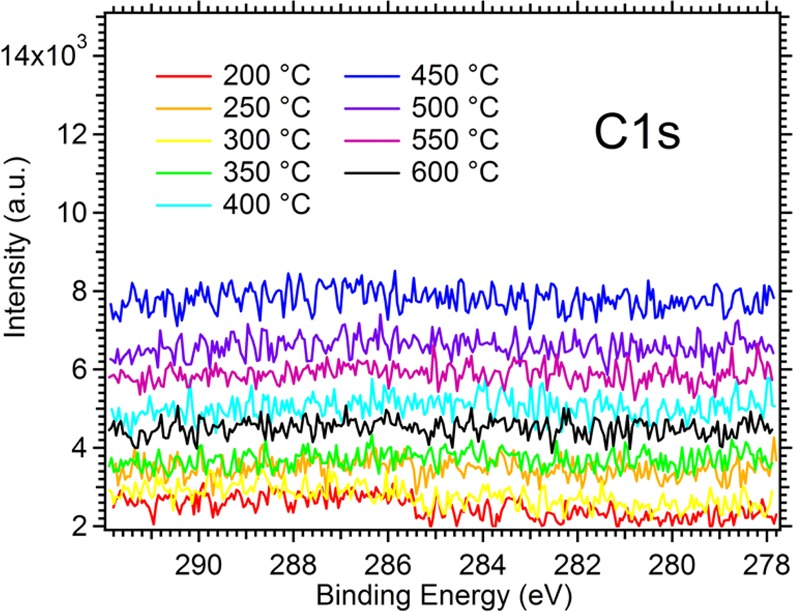
In situ X-ray photoelectron spectra of the C 1s region obtained on the Ni:Cu = 1:1 near-surface alloy in 0.02 mbar methane. Sample pretreatment as described in Figure 1 followed by methane pressure reduction to 0.02 mbar at 250 °C. Photon energy: 425 eV.
Below 400 °C, the Ni:Cu ratio remained at the initial 50:50 ratio, despite the simultaneous presence of CH4. Above 400 °C, a fast increase of the Ni:Cu ratio was observed (Figure 10). Nevertheless, carbon deposition remained completely blocked until 600 °C. The related O 1s series of spectra did not show any signs of oxygen segregation to the surface, as previously observed on the pure Ni foam (Figure 4C). We conclude that near-surface Cu provides a highly effective adsorption barrier for methane, in combination with an increased diffusion barrier in both directions, inward carbon diffusion, and outward oxygen diffusion.
Figure 10.
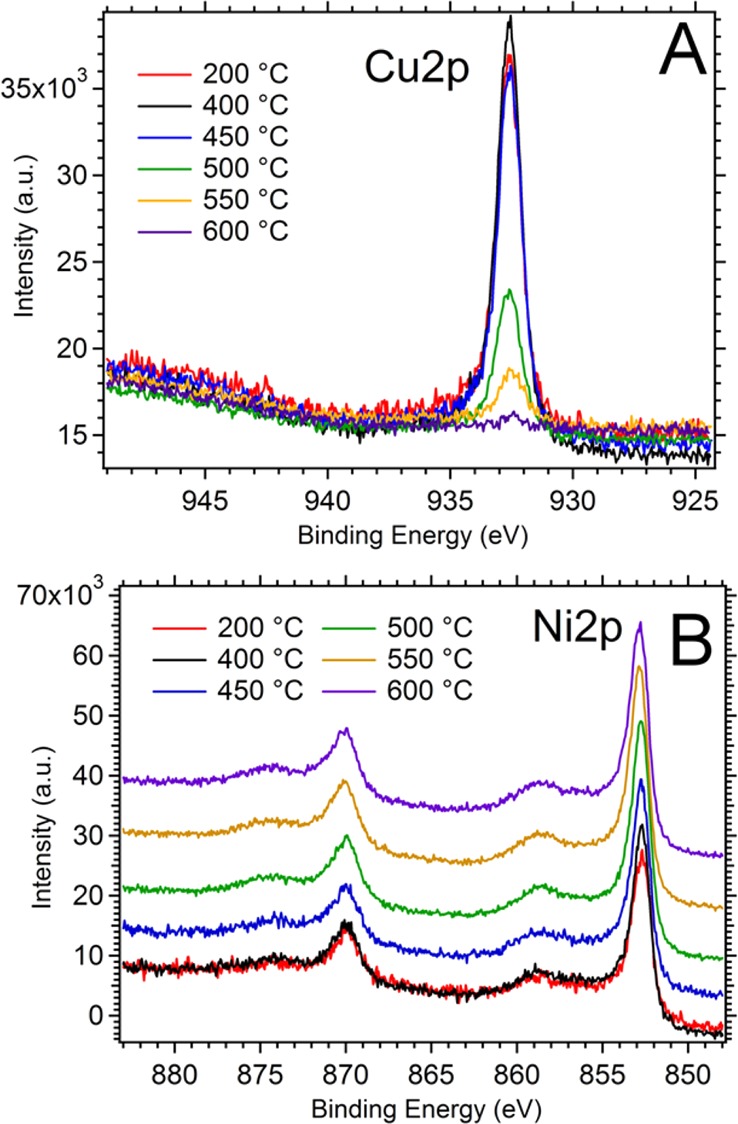
In situ X-ray photoelectron spectra of the Cu 2p and Ni 2p regions of the initial 50:50 near-surface NiCu alloy in 0.02 mbar CH4 in the temperature range 200–600 °C.
At the highest temperature (600 °C), the Cu signal decreases to almost zero, indicating a change of the surface termination toward almost clean Ni and/or progressive dissolution of Cu into deeper Ni layers. This is already a well-established fact and has been reported to also happen under UHV conditions.25−29 Similar surface modification processes during methane decomposition on Cu-promoted Ni–ZrO2 catalysts were recently reported, concluding that Cu does enhance the desired coking resistance but only in a certain temperature range. In analogy to the results of this study, it showed only limited stability under relevant reaction conditions. Beyond ∼400 °C, surface segregation of Ni caused a fast increase in methane decomposition rate.30 This stability issue will be particularly important in SOFC anode applications, where temperatures around 800 °C are common. Nevertheless, it appears possible that the bulk-diffusion blocking function of Cu can be utilized to inhibit the well-known growth mechanism of C nanofilaments, while still keeping up the advantage of a catalytically active Ni terminated surface, which is important for effective internal reforming of the respective fuel. The question remains open of how the obviously Cu-depleted surface region at 600 °C can still act as an effective adsorption barrier. As the carbon blocking effect is an experimental matter of fact, this question can only be answered by future directed experiments of a similarly Cu-diluted system (deviating from the 1:1 stoichiometry) treated in methane at 400 °C. Note, however, that at 600 °C under the chosen experimental conditions (methane pressure) both the precursor and the graphite/graphene layers are unstable also on the pure Ni foil/foam toward decomposition and the resulting carbon is dissolved.
4. Discussion
The focus of this work centers on the investigation of the more application-relevant graphene/graphitic carbon formation mechanism from methane at rather low temperatures (250–400 °C) on “Ni-cermet-like” polycrystalline Ni surfaces and on comparing these experiments to those on structurally “ideal” Ni(111) single crystals with sticky hydrocarbons such as ethylene, acetylene, or toluene. In order to develop a comprehensive model for the growth, dissolution, and prevention of carbon species on curved and polycrystalline Ni surfaces, we first needed to calculate the maximum average thickness of the observed graphene/graphite layers and subsequently to compare the XPS quantification on the foam with those reported for Ni single crystals exposed to ethylene. This comparison should help to clarify the structural and morphological analogies and discrepancies between the “ideal” and “realistic” model systems.
The carbon film thickness was estimated from XPS via an attenuated overlayer model assuming an atomically flat substrate and overlayer (for details, we refer to ref (31))
 |
where ρ = atom density (cm–3); I = X-ray flux, which varies depending on photon energy (different photon flux at different photon energy); dσ/dΩ = differential cross section; θ = photoemission angle measured with respect to the surface normal, 50°; t = overlayer thickness; N = normalized XPS intensity (peak area); Λ(E) = electron attenuation length (EAL data from SRD 82 database32); indices: s, substrate; l, overlayer/adlayer.
To further corroborate our coverage estimation on the basis of this model and to back-check its applicability, we utilized a XPS depth profile analysis recorded at three different photon energies and thus C 1s kinetic energies and compared the results. This provides us with three independently determined coverage values for the same overlayer. Under consideration of the three pairs of Ni 2p and C 1s peak areas (deduced from Figure 11, which highlights the spectra obtained from depth profiling, after background subtraction), we estimated the overlayer coverage to be 2 ± 0.2 ML (based on the surface atom density of graphene and Ni(111) and the respective attenuation length; recalculating to the thickness of the graphite layer yields a value of ∼4.9 Å). Because of the fact that the EAL is effectively an electron energy-dependent entity, this value is the common solution for all three resulting electron kinetic energies (150, 350, and 550 eV). This good compliance for all three pairs of Ni/C spectra supports the validity of the attenuated overlayer model within certain constraints, even though there are certain limits for applying it in this system: (1) One obstacle is the porosity of the foam, which conflicts to some extent with the restriction of a homogeneous, evenly thick overlayer (this of course also applies to the used emission angle, which is 50° in the experiments), and (2) residual dissolved carbon in Ni may still contribute to the C 1s intensity.
Figure 11.
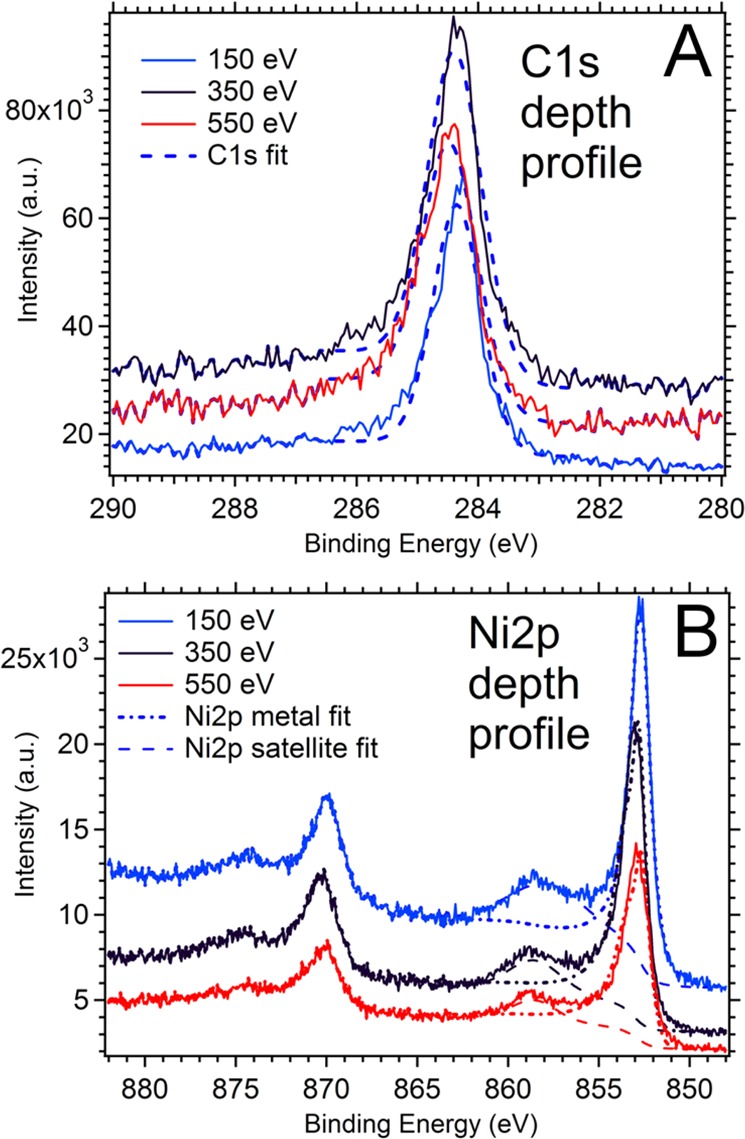
In situ X-ray photoelectron spectra of the C 1s (A) and Ni 2p (B) regions used for obtaining the depth profile. Sample preparation and graphene/graphite growth as described in Figure 1, photoelectron kinetic energies: 150, 350, and 550 eV. Fits required for background subtraction are also shown.
Over the past few years, several groups investigated carbide and graphene formation on Ni(111) in an ethylene- or toluene gas atmosphere in the low and intermediate temperature region (∼250–600 °C). A common observation is the initial formation of a C 1s component at a XPS binding energy of ∼283.3 eV already at low temperatures around 250 °C and small exposures in the 10–100 L range (Weatherup et al.9 on polycrystalline Ni films and Patera et al.11 on Ni(111)). This component was originally associated in ref (9) with adsorbed carbon atoms on the Ni surface but subsequently in ref (11) reassigned (on the basis of STM and LEED) to carbon within the Ni2C clock reconstructed surface carbide, an ordered 2D species with coverages of ΘNi = 0.9 and ΘC = 0.45 with respect to the Ni substrate, which was first described by Klink et al.10 We conclude that a related but structurally probably much more heterogeneous and disordered near-surface carbide phase is initially formed also on the Ni foam. Obviously, also methane dissociation delivers the carbon atoms to build a related structure at a comparable rate, but roughly 5 orders of magnitude higher pressures are required to compensate for the lower sticking probability relative to ethylene (this holds at least for the foam sample, on the foil the predominant species is inactive adventitious carbon). The growth of the ∼284.2 eV component is assigned in analogy to ref (11) to sp2-hybridized graphene/graphitic carbon. On the basis of the coverage estimation given above, 2 ML (based on layer distance and surface atom density of Ni(111) would correspond exactly to a full single layer of graphene, reported also as C saturation coverage for the Ni(111)/ethylene system).11 In contrast, the carbidic species reaches saturation at a lower coverage also in the foam system described herein, while the graphene/graphitic signal still grows up to 2 ML and fully replaces the carbide species around 350 °C. Again, in analogy to ref (11), we may discuss the possibility that complete decomposition of a sufficiently C-supersaturated “metastable” carbide/dissolved carbon precursor around 350 °C leaves single graphene layers/flakes on top of Ni metal (in an unknown degree of order) behind. Consequently, upon suppression of the carbide signal, the further graphene/graphite growth is expected to stagnate, because (a) the near-surface regions are depleted of dissolved/carbidic carbon feedstock to build graphene and (b) the full graphene layer inhibits further supply of carbon from the gas phase by blocking methane chemisorption and lowering its effective sticking probability. Vice versa, the presence of a sufficiently intense carbidic “precursor” signal is quite obviously an indication of sufficient supersaturation of near-surface regions to nucleate and grow graphene/graphitic carbon patches. The nucleation and growth of the latter has thus never been observed in any of our experiments—which were all conducted well below 500 °C—without the simultaneous presence of a sufficiently strong carbide signal and thus “carbon-rich” metastable carbide precursor. In this context, we imply an analogy to the three-dimensional nickel–carbon phase stability diagram reported in ref (33). Also for the related bulk phases, formation of a metastable Ni3C bulk carbide from a supersaturated solid solution of C in Ni metal is expected, which becomes unstable well above 500 °C and is finally converted to the thermodynamically stable graphite phase and Ni metal with a lower carbon content.
We suggest that the in-plane/two-layer carbide–graphene conversion mechanisms, which rely on continuous carbon supply from the gas phase, may in our case also occur in combination with the “C-contaminated subsurface segregation” mechanism,11 which operates without continuous carbon supply and is based on a preexposure-induced, extended subsurface/dissolved carbon reservoir. This reservoir should in our case also exist beneath the carbidic surface reconstruction, and thus help to supply the full carbon amount to form a fully surface-covering 2 ML graphene film. Nevertheless, without continuous supply of 0.02 mbar methane via the gas phase, the formation of the full 2 ML graphene coverage has experimentally not been observed, suggesting a “weighted” combination of all mechanistic scenarios described in ref (11).
Our general conclusion is that the methane-on-foam growth mechanism bears strong analogies to the one described for ethylene on Ni(111) but all individual processes appear to be shifted to at least 100° lower temperatures, likely due to the “open” structure of the curved foam surface. Structurally, the formation of a single graphene layer or disordered flakes/patches on the foam is obviously difficult to proof by modern high-end electron microscopic techniques and/or STM. Thus, we cannot exclude a high degree of disorder and heterogeneity in the graphene film coexisting, e.g., with thin patches of disordered graphite, which may extend over a few layers. At rather high carbon supersaturations of polycrystalline Ni, the nucleation of rotated graphene domains in multilayer graphene by decoupling of the layers from the Ni surface has been recently shown on the basis of postgrowth STM data.34
5. Conclusions
It has been shown that the initial formation of a sufficiently C-supersaturated carbidic/dissolved carbon phase is a necessary precondition for the nucleation and growth of graphene/graphitic carbon on Ni foam already at lower temperatures than usually applied on Ni(111) (<400 °C). Any chemical surface modification which inhibits the buildup of this precursor state, or at least lowers its C-content below a critical value, necessarily also inhibits graphene/ite growth. Addition of H2O effectively suppresses the initial formation of the precursor and thus the fundamental growth condition for graphene. The same holds for already present carbon deposits such as “adventitious” carbon and, of course, bimetallic dopants such as Cu alloyed into Ni. Thus, a broad choice of structural and chemical modifications of the Ni surface opens up exciting possibilities to circumvent pending problems in technological applications such as coking of the Ni anode catalyst surface of SOFCs and associated formation of deleterious carbon nanofilaments.
Acknowledgments
We thank the FWF (Austrian Science Foundation) for financial support under the SFB F45 project part F4503-N16. The work was performed in the framework of the Forschungsplattform “Advanced Materials” at the University of Innsbruck. We acknowledge the Helmholtz-Zentrum Berlin-Electron storage ring BESSY II for provision of synchrotron radiation at the ISISS beamline. R.R. acknowledges financial support by the Max Planck Society in the frame of a PhD grant.
The authors declare no competing financial interest.
References
- Weatherup R. S.; Baehtz C.; Dlubak B.; Bayer B. C.; Kidambi P. R.; Blume R.; Schlögl R.; Hofmann S. Introducing Carbon Diffusion Barriers for Uniform, High-Quality Graphene Growth from Solid Sources. Nano Lett. 2013, 13, 4624–4631 10.1021/nl401601x. [DOI] [PMC free article] [PubMed] [Google Scholar]
- Tauster S. J.; Fung S. C.; Baker R. T. K.; Horsley J. A. Strong Interactions in Supported-Metal Catalysts. Science 1981, 211, 1121–1125 10.1126/science.211.4487.1121. [DOI] [PubMed] [Google Scholar]
- Kumar D.; Chen M. S.; Goodman D. W. Synthesis of Vinyl Acetate on Pd-based Catalysts. Catal. Today 2007, 123, 77–85 10.1016/j.cattod.2007.01.050. [DOI] [Google Scholar]
- Rinaldi A.; Tessonnier J. P.; Schuster M. E.; Blume R.; Girgsdies F.; Zhang Q.; Jacob T.; Abd Hamid S. B.; Su D. S.; Schlögl R. Dissolved Carbon Controls the Initial Stages of Nanocarbon Growth. Angew. Chem., Int. Ed. 2011, 50, 3313–3317 10.1002/anie.201006639. [DOI] [PubMed] [Google Scholar]
- Gabasch H.; Hayek K.; Klötzer B.; Knop-Gericke A.; Schlögl R. Carbon Incorporation in Pd (111) by Adsorption and Dehydrogenation of Ethene. J. Phys. Chem. B 2006, 110, 4947–4952 10.1021/jp056765g. [DOI] [PubMed] [Google Scholar]
- Schouten F. C.; Kaleveld E. W.; Bootsma G. A. AES-LEED-Ellipsometry Study of the Kinetics of the Interaction of Methane with Ni (110). Surf. Sci. 1977, 63, 460–474 10.1016/0039-6028(77)90359-4. [DOI] [Google Scholar]
- Holmblad P. M.; Wambach J.; Chorkendorff I. Molecular Beam Study of Dissociative Sticking of Methane on Ni(100). J. Chem. Phys. 1995, 102, 8255. 10.1063/1.468955. [DOI] [Google Scholar]
- Nakamura J.; Hirano H.; Xie M.; Matsuo I.; Yamada T.; Tanaka K. I. Formation of a Hybrid Surface of Carbide and Graphite Layers on Ni(100) But No Hybrid Surface on Ni (111). Surf. Sci. 1989, 222, L809–L817 10.1016/0039-6028(89)90328-2. [DOI] [Google Scholar]
- Weatherup R. S.; Bayer B. C.; Blume R.; Ducati C.; Baehtz C.; Schlögl R.; Hofmann S. In Situ Characterization of Alloy Catalysts for Low-Temperature Graphene Growth. Nano Lett. 2011, 11, 4154–4160 10.1021/nl202036y. [DOI] [PubMed] [Google Scholar]
- Klink C.; Stensgaard I.; Besenbacher F.; Lægsgaard E. An STM Study of Carbon-Induced Structures on Ni (111): Evidence for a Carbidic-Phase Clock Reconstruction. Surf. Sci. 1995, 342, 250–260 10.1016/0039-6028(95)00697-4. [DOI] [Google Scholar]
- Patera L. L.; Africh C.; Weatherup R. S.; Blume R.; Bhardwaj S.; Castellarin-Cudia C.; Knop-Gericke A.; Schlögl R.; Cornelli G.; Hofmann S.; Cepek C. In Situ Observations of the Atomistic Mechanisms of Ni Catalyzed Low Temperature Graphene Growth. ACS Nano 2013, 7, 7901–7912 10.1021/nn402927q. [DOI] [PubMed] [Google Scholar]
- Lahiri J.; Miller T.; Adamska L.; Oleynik I. I.; Batzill M. Graphene Growth on Ni (111) by Transformation of a Surface Carbide. Nano Lett. 2011, 11, 518–522 10.1021/nl103383b. [DOI] [PubMed] [Google Scholar]
- Jacobson P.; Stöger B.; Garhofer A.; Parkinson G. S.; Schmid M.; Caudillo R.; Mittendorfer F.; Redinger J.; Diebold U. Nickel Carbide as a Source of Grain Rotation in Epitaxial Graphene. ACS Nano 2012, 6, 3564–3572 10.1021/nn300625y. [DOI] [PubMed] [Google Scholar]
- McIntosh S.; Gorte R. J. Direct Hydrocarbon Solid Oxide Fuel Cells. Chem. Rev. 2004, 104, 4845–4866 10.1021/cr020725g. [DOI] [PubMed] [Google Scholar]
- Knop-Gericke A.; Kleimenov E.; Hävecker M.; Blume R.; Teschner D.; Zafeiratos S.; Schlögl R.; Bukhtiyarov V. I.; Kaichev V. V.; Prosvirin I. P.; et al. Chapter 4 X-Ray Photoelectron Spectroscopy for Investigation of Heterogeneous Catalytic Processes. Adv. Catal. 2009, 52, 213–271 10.1016/S0360-0564(08)00004-7. [DOI] [Google Scholar]
- Yeh J. J.Atomic Calculation of Photoionization Cross-Sections and Asymmetry Parameters; Gordon and Breach Science Publishers: Langhorne, PA, 1993. [Google Scholar]
- Grosvenor A. P.; Biesinger M. C.; Smart R.; St C.; Stewart McIntyre N. New Interpretations of XPS Spectra of Nickel Metal and Oxides. Surf. Sci. 2006, 600, 1771–1779 10.1016/j.susc.2006.01.041. [DOI] [Google Scholar]
- Ayyoob M.; Hegde M. S. Coadsorption of Barium and Oxygen on Nickel-Effect on Oxide Nucleation: Photoelectron Spectroscopic Studies. J. Vac. Sci. Technol., A 1991, 9, 1680–1683 10.1116/1.577485. [DOI] [Google Scholar]
- Biesinger M. C.; Payne B. P.; Lau L. W. M.; Gerson A.; Smart R. St. C. X-ray Photoelectron Spectroscopic Chemical State Quantification of Mixed Nickel Metal, Oxide and Hydroxide Systems. Surf. Interface Anal. 2009, 41, 324–332 10.1002/sia.3026. [DOI] [Google Scholar]
- Hagelin-Weaver H. A.E.; Weaver J. F.; Hoflund G. B.; Salaita G. N. Electron Energy Loss Spectroscopic Investigation of Ni Metal and NiO before and after Surface Reduction by Ar+ Bombardment. J. Electron Spectrosc. Relat. Phenom. 2004, 134, 139–171 10.1016/j.elspec.2003.10.002. [DOI] [Google Scholar]
- Hagelin-Weaver H. A. E.; Weaver J. F.; Hoflund G. B.; Salaita G. N. Electron Energy Loss Spectroscopy Study of Nickel, Chromium and a Nickel–Chromium Alloy. J. Alloys Compd. 2005, 389, 34–41 10.1016/j.jallcom.2004.07.039. [DOI] [Google Scholar]
- Held G.; Schuler J.; Sklarek W.; Steinrück H.-P. Determination of Adsorption Sites of Pure and Coadsorbed CO on Ni(111) by High Resolution X-ray Photoelectron Spectroscopy. Surf. Sci. 1998, 398, 154–171 10.1016/S0039-6028(98)80020-4. [DOI] [Google Scholar]
- Lo P.-H.; Tsai W.-T.; Lee J.-T.; Hung M.-P. The Electrochemical Behavior of Electroless Plated Ni-P Alloys in Concentrated NaOH Solution. J. Electrochem. Soc. 1995, 142, 91–96 10.1149/1.2043954. [DOI] [Google Scholar]
- Specs Company. http://www.specs.de/cms/upload/PDFs/ApplNotes/PHOIBOS/TNote-OverlayerThickness.pdf (accessed Nov 5, 2015).
- Mittemeijer E. J.; Delhez R.; van Rooijen R.; Hoyer W. On Twinning in Crystallized Copper Layers on a 111 Nickel Surface. J. Cryst. Growth 1976, 36, 249–253 10.1016/0022-0248(76)90284-0. [DOI] [Google Scholar]
- Abbati I.; Braicovich L.; Fasana A.; Picco P.; Rossi G. Chemisorption of Cu Onto Ni(111): Comparison with Cu Chemisorption on Simple Metal. Phys. Status Solidi B 1980, 101, K7–K10 10.1002/pssb.2221010148. [DOI] [Google Scholar]
- Feng X. H.; Yu M. R.; Yang S.; Meigs G.; Garfunkel E. Carbon Monoxide Chemisorption on Cu Covered Ni (111) Surfaces. J. Chem. Phys. 1989, 90, 7516–7523 10.1063/1.456185. [DOI] [Google Scholar]
- Frank K. H.; Dudde R.; Sagner H. J.; Eberhardt W. Modification of the Surface Electronic Structure of Cu (111) by Monolayer Ni Adsorption and the Effects on H2 Chemisorption. Phys. Rev. B: Condens. Matter Mater. Phys. 1989, 39, 940–947 10.1103/PhysRevB.39.940. [DOI] [PubMed] [Google Scholar]
- Koschel H.; Held G.; Steinrück H. P. The Growth of Thin Cu Layers on Ni (111) Studied by CO Titration and Photoelectron Spectroscopy. Surf. Sci. 2000, 453, 201–213 10.1016/S0039-6028(00)00349-6. [DOI] [Google Scholar]
- Wolfbeisser A.; Klötzer B.; Mayr L.; Rameshan R.; Zemlyanov D.; Bernardi J.; Föttinger K.; Rupprechter G. Surface Modification Processes During Methane Decomposition on Cu-promoted Ni–ZrO2 catalysts. Catal. Sci. Technol. 2015, 5, 967–978 10.1039/C4CY00988F. [DOI] [PMC free article] [PubMed] [Google Scholar]
- Fadley C. S. In Electron Spectroscopy: Theory, Techniques and Applications; Brundle C. R., Baker A. D., Eds.; Academic Press: New York, 1978; Vol 2, pp 1–156. [Google Scholar]
- National Institute of Science and Technology. NIST Standard Reference Database 82; Powell C. J., Jablonski A.; Electron Effective-Attenuation-Length Database SRD 82, version 1.3. http://www.nist.gov/srd/upload/SRD82UsersGuideV1-3.pdf (accessed Nov 7, 2015).
- Singleton M.; Nash P. The C-Ni (Carbon-Nickel) System. Bull. Alloy Phase Diagrams 1989, 10, 121–126 10.1007/BF02881419. [DOI] [Google Scholar]
- Zhang Y.; Gao T.; Xie S.; Dai B.; Fu L.; Gao Y.; Chen Y.; Liu M.; Liu Z. Different Growth Behaviors of Ambient Pressure Chemical Vapor Deposition Graphene on Ni(111) and Ni Films: A Scanning Tunneling Microscopy Study. Nano Res. 2012, 5, 402–411 10.1007/s12274-012-0221-6. [DOI] [Google Scholar]


