Abstract
Background:
The prevalence of obesity continues to rise worldwide with alarming rates in most of the world countries. Our aim was to compare the mortality of fatal disease attributable to excess body mass index (BMI) in Iran in 2005 and 2011.
Methods:
Using standards implementation comparative risk assessment methodology, we estimated mortality attributable to excess BMI in Iranian adults of 25–65 years old, at the national and sub-national levels for 9 attributable outcomes including; ischemic heart diseases (IHDs), stroke, hypertensive heart diseases, diabetes mellitus (DM), colon cancer, cancer of the body of the uterus, breast cancer, kidney cancer, and pancreatic cancer.
Results:
In 2011, in adults of 25–65 years old, at the national level, excess BMI was responsible for 39.5% of total deaths that were attributed to 9 BMI paired outcomes. From them, 55.0% were males. The highest mortality was attributed to IHD (55.7%) which was followed by stroke (19.3%), and DM (12.0%). Based on the population attributed fractions estimations of 2011, except for colon cancer, the remaining 6 common outcomes were higher for women than men.
Conclusions:
Despite the priority of the problem, there is currently no comprehensive program to prevention or control obesity in Iran. The present results show a growing need to comprehensive implications for national and sub-national health policies and interventional programs in Iran.
Keywords: Body mass index, burden, mortality, obesity, population attributed fraction
INTRODUCTION
The prevalence of obesity continues to rise worldwide with alarming rates in most of the world countries.[1,2] Evidence shows that obesity is a major cause of death in both developed and developing countries.[3,4] These increases over the last several decades as well as growing reports of co-morbidities and mortality, has led to considerable interest in estimating and evaluating obesity possible health effects’.[5,6]
Most of recent global, national, and sub-national studies approved the body-mass index (BMI), as a reasonably good measure of general adiposity.[7,8,9] The increasing trends of BMI are widely associated with adverse effects on health trends.[9,10,11,12]
Raised BMI is an established risk factor for several causes of death, including ischemic heart disease (IHD), stroke, hypertensive diseases (hypertension [HTN]), diabetes mellitus (DM), and cancers.[4,5,10] It has been suggested that obesity is second only to smoking as a preventable cause of death accounting for as many as 300,000 globally deaths per year as a public health threat.[5,13,14]
In Iran, studies emphasized on noticeable increase in overweight and obesity prevalence for all ages and both sexes.[3,9,15] Considering the higher population of young people, ignoring the priority of the problem and lack of effective policies, burden of obesity in the near future, become the irreparable concern of health.[3,14]
To designing the controlling programs and allocating resources, a determinant question is the role of risk factors on mortality.[16] Population attributed fraction (PAF) is one of the important parameters of measuring health effect of risk factors and evaluating their potential impact of preventive programs in community level.[17] Evidence reveal that for obesity, PAFs may be best-considered indicators of attributed outcomes effects.[18] It also provide some information on the consequences of interventions.[19]
There are few evidence that estimated the mortality effects of BMI in Iran. Although some of them are conducted based on exact methodological approaches, there are limited to some national and socioeconomic-geographical regions estimations.[10,20] The previous related study was based on data that were not nationally representative. Moreover, it estimated the effects of BMI defined clinical thresholds, even though epidemiologic studies reveal that the association between BMI and its attributed outcomes continues below such thresholds.[9,10,18] In this estimations, incompleteness of the vital registration system and misclassification of cause of death, and uncertainty of the estimated number of deaths were other problems.[21]
Considering above, using the representative national and provincial data, benefiting from the most comprehensive of mortality data, and following the global burden of diseases (GBD) studies approach, the aim of this study was to estimate and compare the mortality attributable to excess BMI in Iranian population.
METHODS
Using the PAF, we estimated mortality attributable to excess BMI in Iranian adults of 25–65 years old, at the national and sub-national levels. PAF provides the fraction by which the occurrence of an interesting disease/risk factor would be reduced under a sustained alternative, more favorable, exposure distribution.[11,16,22]
To assess the full effects of BMI distribution as an “exposure,” following the comparative risk assessment (CRA) project, we used the counterfactual of BMI distribution with a mean of 21 kg/m2 and a standard deviation (SD) of 1 kg/m2.[1,20,23] In summary, to calculate deaths attributable to excess BMI, the total number of deaths is multiplied by the PAF which may be interpreted as the proportion of deaths attributable to excess BMI:
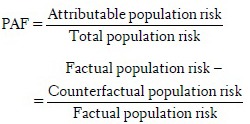
These aggregates of population risk can be thought of as proportional to “areas under the curve,” made up, in a discrete approximation, of small strata of proportions exposed at a given level times the risk at that level, so that:

where P1 refers to the factual (or predicted) and P2 to the counterfactual BMI distribution. In the CRA method, the relative risks (RRs) for all positions on the counterfactual exposure distribution are set to 1 and given that the sum of the probability distribution is 1, the formula simplifies to:

Data sources
For BMI values, we used data from the Noncommunicable Disease Surveillance Survey (NCDSS) which followed STEP wise approach of WHO guidelines. Surveys’ data are available for 6 years (2005–2009, 2011). This is the only complete data source that contains the information of BMI, separately by age and sex at provincial and district levels for adults of 25–65 years old.[10] After refine processing, we had 3182 point of data that was representative of 169,347 population
The effect size of excess BMI for outcomes’ specific mortality was included by RR. Aim to that we used recent relevant meta-analyses of international cohorts evidence[20]
Mortality data are from Death Registration System (DRS) that is currently collected by Ministry of Health and Medical Education (MOHME) and National Organization for Civil Registration (NOCR). Because of delayed registration and inaccurate recording of cause of deaths in NOCR data, only MOHME data were employed in this study. The MOHME DRSs collected by Deputy of Research and Technology from 1996 to 2001 and by Deputy of Public Health from 2001 to 2010. This system registers the death by age, sex, cause of death, date of death, place of residence, place of death, and other information[24,25]
Population data are from the censuses which are systematically iterated every 10 years, except periods. Accordingly, seven censuses have been conducted so far (1986–2011, Province, District).[24]

Estimation of attributable mortality
We considered 9 attributable outcomes of excess BMI for loss of life, based on deaths assigned codes of ICD-10. These include: IHDs, stroke, hypertensive heart disease HTN, DM, colon cancer, cancer of the body of the uterus (only in females), breast cancer (only in ≥45-year-old females), kidney cancer, and pancreatic cancer. These losses are expressed in the metrics of deaths.
Using simulation methods, combining the uncertainties of BMI distributions, RRs, and outcome-specific mortality, we estimated the corresponding uncertainty intervals of deaths estimations. By assuming an SD of 20% of the estimated completeness, the uncertainty of incompleteness of death registration considered as the variance of the estimated level of completeness.[20] Computation were based on 1000 draws for each mentioned parameter in repeated calculations and reported 95% uncertainty intervals based on the distributions of 1000 estimated attributable deaths. The uncertainty of the basic assumptions of the extrapolation of age patterns and RRs across population is not considered in this analysis.[26] These analyses were performed by Stata software (version 11) and R software (version 3.0.2).
RESULTS
In 2011, in adults of 25–65 years old, at the national level, excess BMI was responsible for 39.5% (10,210 deaths) of total 25,860 deaths that were attributed to 9 BMI paired outcomes. Of them, 5619 (55.0%) were males. Considering BMI outcomes, the highest mortality was attributed to IHD (55.7%) which was followed by stroke (19.3%), and DM (12.0%). Except for IHD and colon cancer, attributed death to all of other common outcomes, considerably, were higher in females. Figure 1 shows the national attributed deaths (and uncertainty intervals) trends of excess BMI, by outcomes, sex, and age groups.
Figure 1.
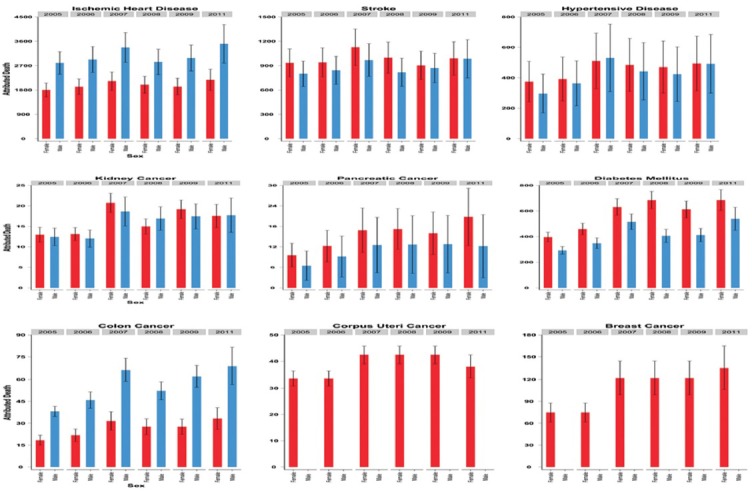
The national attributed deaths (and uncertainty intervals) trends of excess body mass index, by outcomes, sex, and age groups (2005–2011)
In Figure 2, the provincial patterns of excess BMI attributed death have been presented by outcomes and sex, in 2005 and 2011. Based on the provincial patterns, the most incremental changes happened in Central and Western provinces. These increases are more impressive in females than males and in IHD, HTN, and cancers than other outcomes.
Figure 2.
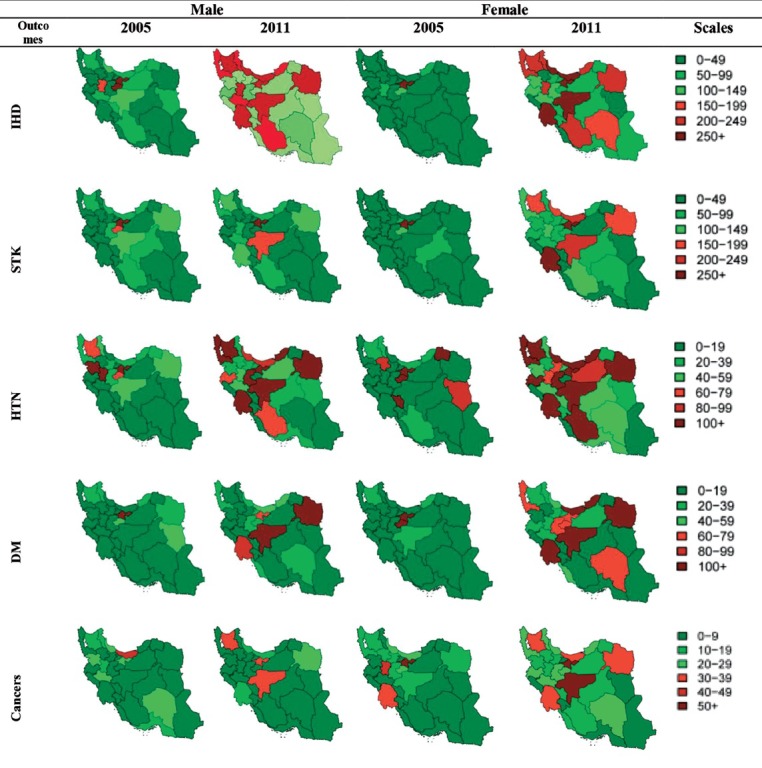
The provincial patterns of excess body mass index attributed deaths by outcomes and sex, in 2005 and 2011
Figure 3 shows the provincial excess BMI attributed deaths by outcomes, sex, and age groups, in 2011. For all of the outcomes, the highest death was, mostly, happened in 55–59 and 60–64 age groups. Isfahan, Mazandaran, and Khuzestan were the first leading province for IHD attributed death in males. For females, these orders changed to Khuzestan, Mazandaran, and Isfahan. The highest deaths for stroke were aligned, respectively, to Tehran, Isfahan, and Khuzestan in males and Tehran, Khuzestan, and East Azerbaijan in females. Khorasan Razavi and Isfahan were the first two provinces with the highest HTN death, for both sexes, which were followed by Tehran in males and East Azerbaijan in females. At the same way, Khuseatan and Isfahan were two top ranked of highest DM death that were followed by Razavi Khorasan in males and Mazandaran in females. For cancers mortality: Tehran, Isfahan, and Khuzestan, unanimously, were three first leading provinces in both sexes. It is mentionable that in females, West Azerbaijan was together with Khuzestan stand at the third ranks.
Figure 3.
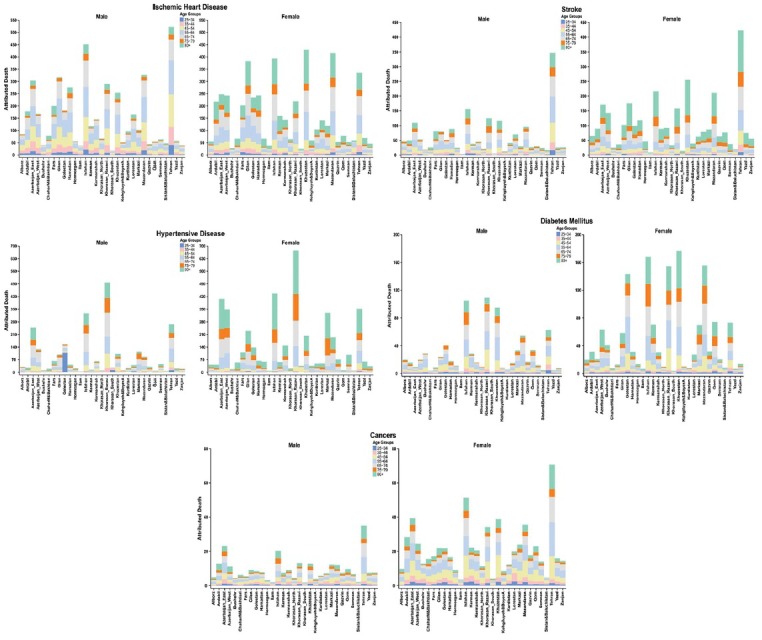
The provincial excess body mass index attributed deaths by outcomes, sex, and age groups, in 2011
Given the comparative results at national levels, between 2005 and 2011, obtained PAFs, were increased for all 9 excess BMI attributed outcomes’. Considering the age-specific changes, these increasing detected in most of adult age groups. Except for colon cancer, the remaining 6 common outcomes of IHD, stroke, HTN, DM, kidney cancer, and pancreatic cancer, were higher for women than men. It is noteworthy that colon cancer showed higher attributed risk in all of age groups of males, compared with females. Figure 4 compares the national PAFs of all 9 excess BMI attributed outcomes, by sex, by age groups, between 2005 and 2011. Based on the categorical references, for breast cancer, data were estimated only for over 45 age groups.
Figure 4.
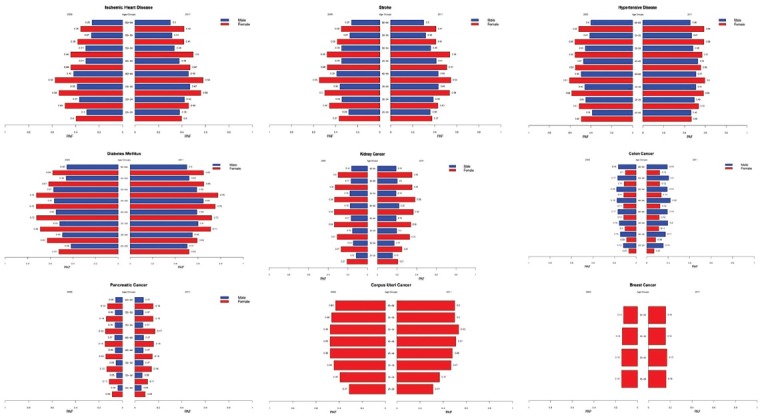
The national PAFs of excess body mass index attributed outcomes, by sex, by age groups, in 2005 and 2011
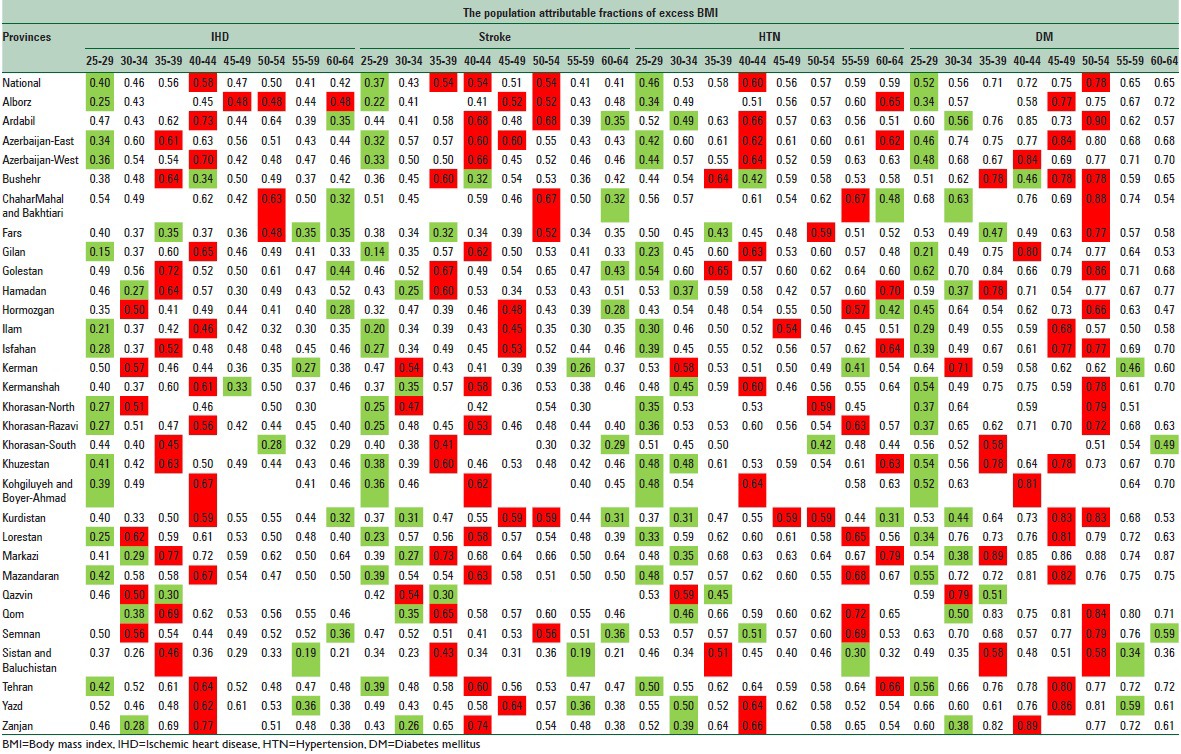
In Tables 1 and 2, respectively, for males and females, the PAFs of three leading cause of excess BMI attributed death, IHD, stroke, HTN, and DM compared between different age groups at national and provincial levels. In each province, the lowest and highest levels have been showed, respectively, in green and red.
Table 1.
The national and provincial population attributable fractions of excess BMI on IHD, stroke, HTN, and DM in Iranian males by age groups in 2011
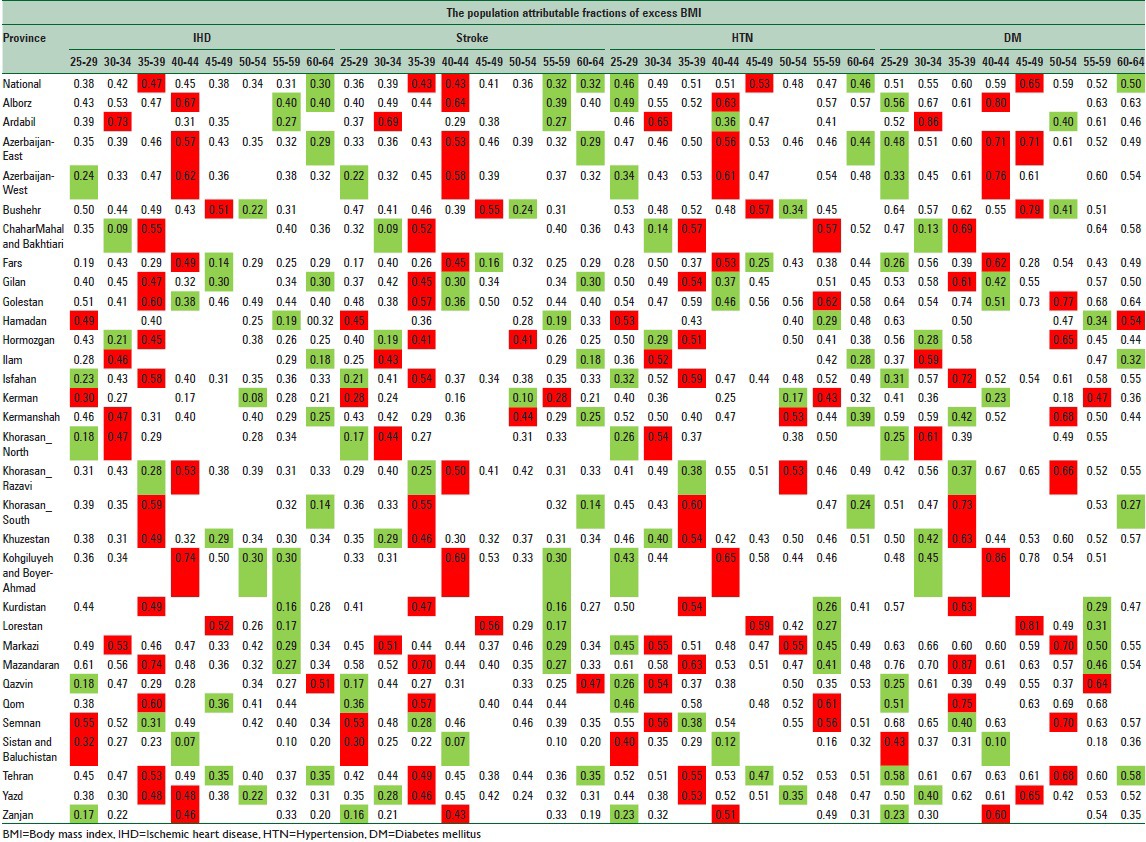
Table 2.
The national and provincial population attributable fractions of excess BMI on IHD, stroke, HTN, and DM in Iranian females by age groups in 2011
Overlay at national level, in males, the highest PAF for IHD, stroke, HTN, and DM were, respectively, detected in 35–39, 35–39, and 40–44, and 45–49 age groups. At the same way, for all three outcomes, the lowest values were related to 60–64 age groups.
At provincial levels, the highest PAFs for IHD were in Kohgiluyeh and Boyer-Ahmad and Mazandaran (0.74), for stroke, in Ardabil and Kohgiluyeh and Boyer-Ahmad (0.69), for HTN, in Ardabil and Kohgiluyeh and Boyer-Ahmad (0.65), and for DM, in Mazandaran (0.87) provinces.
In females, the highest national PAF for IHD (0.58), stroke (0.54), and HTN (0.60) was, respectively, detected in 40–44 age groups. Two age groups of 35–39 and 50–54 also had the highest value for PAF of stroke (0.54). The highest national PAF for DM (0.54) was detected in 50–54 age groups. Except for all other three outcomes, with lowest PAFs of 25–29 age groups, for DM the lowest value was found in 60–64 age groups. At provincial levels, the highest PAFs for IHD were in Markazi and Zanjan (0.77), for stroke, Zanjan (0.74), for HTN in Markazi (0.79), and for DM Ardebil (0.90) provinces.
DISCUSSION
Using PAF, widely regarded as an estimate of the proportion of disease/risk factor(s) burden,[19] we estimate the mortality attributable to excess BMI in Iranian population. We followed the methodology which was used in previous researches.[10,20] In 2011, in adults of 25–65 years old, at national level, excess BMI was responsible for 39.5% (10,210 deaths) of total 25,860 deaths that were attributed to 9 BMI paired outcomes, of them 5619 (55.0%) were males. Considering BMI outcomes, the highest mortality was attributed to IHD (55.7%) which was followed by stroke (19.3%), and DM (12.0%).
Based on the PAFs estimations in 2011, except for colon cancer, the remaining 6 common outcomes of IHD, stroke, HTN, DM, kidney cancer, and pancreatic cancer, were higher for women than men.
There is a considerable variety among studies regarding the methods and results for PAF calculation and the selection of appropriate counterfactuals.[18] In Iran, studies are limited, and there is no previous study on provincial estimation of PAFs or excess BMI mortality (10, 20, 28). Based on the results of previous study, in 2010, excess BMI was the third cause of cardiovascular disease (CVD) deaths in women, which was responsible for about 17,000 (14,000–20,000) national deaths.[10] For men, excess BMI as the fourth cause of CVD death led to 13,000 (11,000–15,000) deaths. Comparing four socioeconomic-geographical regions of the country, the lowest BMI attributed death was estimated for both males and females in South-East region 700 (600–800). The highest estimations were in the Western region, 5400 (4600–6200) and 7100 (5900–8300), respectively, for men and women. Considering the differences, the highest attributable mortality rate was 1.2–2.2 times that of the lowest.[10]
Our analysis extends the relevant evidence on national and sub-national CRA analyses.[10] Considering the previous studies in Iran, the present study has several achievements. This study is the first analysis of national and sub-national estimation of mortality attributable to excess BMI in Iranian population. Benefited from GBD studies approaches, using NCDSS data, we estimate the trends of attributed deaths and their correspond uncertainties, at the national and provincial levels from 2005 to 2011, by sex and age. It is northworthy that for the first time, we had access to most comprehensive data of mortality, at the national and sub-national levels. Considering the geographical changes in provincial divisions, dealing with misalignments problems, for a better comparison, our results estimate for 31 provinces.
We also faced with many limitations. First of all, there is a potential source of bias in methods when estimations used with RRs adjusted for confounding. Obesity is correlated with other exposures or unobserved factors in the population resulting in under- (when there is a positive correlation) or over- (negative correlation) estimation of the true PAF when used with adjusted RRs. We did not have data on dietary factors, physical activity, alcohol and drug use, or other metabolic risk factors. Moreover, causes other than those considered in our study may be positively associated with excess adiposity, which biases our estimates of attributable deaths downward. As another important limitations, our exposure data did not include people 65 years of age and older, which limited the scope of our analysis. It is mentionable that to estimate the number of deaths, we used recorded death data that did not consider incompleteness. In our future plan, our death estimations would be presented dealing with these limitations.[24,27] Considering all of strengths and limitations, under the National Plan of Comprehensive NASBOD project,[28] using most updated modern methodologies and regarding more wide age ranges from 25 up to more than 80 years old,[27,29,30] we are going to estimate trends and burden of BMI, obesity, and overweight, at the national and sub-national levels, for adult Iranian population from 1990 to 2014.[31]
The present results show a growing need to comprehensive implications for the national and sub-national health policies and interventional programs in Iran. Despite the priority of the problem, there is currently no comprehensive program to prevention or control obesity in Iran. These considerations should be followed at the shortest possible time through the primary health care system or community-based lifestyle and dietary interventions.[4,32,33]
Suggested strategies including family-oriented interventions on healthy eating and physical activity by a dietitian, integrating obesity prevention and control programs in the primary health care system, and identifying, implementing, and evaluating of applied interventions are particularly solutions emphasized for dealing with ascending trends of overweight and obesity in Iran and worldwide.[13,14,33,34,35]
In these regards, evidence-based documents emphasize specifically on “solutions and strategies that could be implemented at the level of the individual.” These plans should be designed and followed through a comprehensive by collective societal actions to change the food and activity environments.[35,36,37] We must also help to bridge the division between individual and collective responsibility for successful long-term weight loss maintenance.[13,36,38]
CONCLUSIONS
According to our knowledge, this is the first analysis of the national and sub-national estimation of mortality attributable to excess BMI in Iranian population. Excess BMI was responsible for 39.5% (10,210 deaths) of total attributed deaths to 9 BMI paired outcomes. Considering the priority of the problem, presented estimations provide practical information for health policies and programs. Results also could be used for future complementary analyses.
ACKNOWLEDGEMENTS
The present study was part of a Ph.D. dissertation completed by Shirin Djalalinia. We would like to express our thanks to NCDRC. The study is granted by MOHME of Islamic Republic of Iran and Setad-e-Ejraie Farmane Imam.
Footnotes
Source of Support: This study was part of a Ph.D. dissertation completed by Shirin Djalalinia which is granted by Ministry of Health and Medical Education of Islamic Republic of Iran and Setad-e-EjraieFarmane Imam
Conflict of Interest: None declared.
REFERENCES
- 1.Danaei G, Ding EL, Mozaffarian D, Taylor B, Rehm J, Murray CJ, et al. The preventable causes of death in the United States: Comparative risk assessment of dietary, lifestyle, and metabolic risk factors. PLoS Med. 2009;6:e1000058. doi: 10.1371/journal.pmed.1000058. [DOI] [PMC free article] [PubMed] [Google Scholar]
- 2.Finucane MM, Stevens GA, Cowan MJ, Danaei G, Lin JK, Paciorek CJ, et al. National, regional, and global trends in body-mass index since 1980: Systematic analysis of health examination surveys and epidemiological studies with 960 country-years and 9·1 million participants. Lancet. 2011;377:557–67. doi: 10.1016/S0140-6736(10)62037-5. [DOI] [PMC free article] [PubMed] [Google Scholar]
- 3.Jafari-Adli S, Jouyandeh Z, Qorbani M, Soroush A, Larijani B, Hasani-Ranjbar S. Prevalence of obesity and overweight in adults and children in Iran; a systematic review. J Diabetes Metab Disord. 2014;13:121. doi: 10.1186/s40200-014-0121-2. [DOI] [PMC free article] [PubMed] [Google Scholar]
- 4.Djalalinia S, Qorbani M, Peykari N, Kelishadi R. Health impacts of obesity. Pak J Med Sci. 2015;31:239–42. doi: 10.12669/pjms.311.7033. [DOI] [PMC free article] [PubMed] [Google Scholar]
- 5.Flegal KM, Williamson DF, Pamuk ER, Rosenberg HM. Estimating deaths attributable to obesity in the United States. Am J Public Health. 2004;94:1486–9. doi: 10.2105/ajph.94.9.1486. [DOI] [PMC free article] [PubMed] [Google Scholar]
- 6.Kelly C, Pashayan N, Munisamy S, Powles JW. Mortality attributable to excess adiposity in England and Wales in 2003 and 2015: Explorations with a spreadsheet implementation of the comparative risk assessment methodology. Popul Health Metr. 2009;7:1–7. doi: 10.1186/1478-7954-7-11. [DOI] [PMC free article] [PubMed] [Google Scholar]
- 7.Low S, Chin MC, Deurenberg-Yap M. Review on epidemic of obesity. Ann Acad Med Singapore. 2009;38:57–9. [PubMed] [Google Scholar]
- 8.Stevens GA, Singh GM, Lu Y, Danaei G, Lin JK, Finucane MM, et al. National, regional, and global trends in adult overweight and obesity prevalences. Popul Health Metr. 2012;10:22. doi: 10.1186/1478-7954-10-22. [DOI] [PMC free article] [PubMed] [Google Scholar]
- 9.Finucane M, Stevens G, Cowan M, Danaei G, Lin J, Paciorek C, et al. National, regional, and global trends in body-mass index since 1980: Systematic analysis of health examination surveys and epidemiological studies with 960 country-years and 9·1 million participants. Lancet. 2011;377:557. doi: 10.1016/S0140-6736(10)62037-5. [DOI] [PMC free article] [PubMed] [Google Scholar]
- 10.Farzadfar F, Danaei G, Namdaritabar H, Rajaratnam JK, Marcus JR, Khosravi A, et al. National and subnational mortality effects of metabolic risk factors and smoking in Iran: A comparative risk assessment. Popul Health Metr. 2011;9:55. doi: 10.1186/1478-7954-9-55. [DOI] [PMC free article] [PubMed] [Google Scholar]
- 11.Lim SS, Vos T, Flaxman AD, Danaei G, Shibuya K, Adair-Rohani H, et al. A comparative risk assessment of burden of disease and injury attributable to 67 risk factors and risk factor clusters in 21 regions, 1990-2010: A systematic analysis for the Global Burden of Disease Study 2010. Lancet. 2012;380:2224–60. doi: 10.1016/S0140-6736(12)61766-8. [DOI] [PMC free article] [PubMed] [Google Scholar]
- 12.Kelly C, Pashayan N, Munisamy S, Powles JW. Mortality attributable to excess adiposity in England and Wales in 2003 and 2015: Explorations with a spreadsheet implementation of the comparative risk assessment methodology. Popul Health Metr. 2009;7:11. doi: 10.1186/1478-7954-7-11. [DOI] [PMC free article] [PubMed] [Google Scholar]
- 13.Kelishadi R, Alikhani S, Delavari A, Alaedini F, Safaie A, Hojatzadeh E. Obesity and associated lifestyle behaviours in Iran: Findings from the First National Non-communicable Disease Risk Factor Surveillance Survey. Public Health Nutr. 2008;11:246–51. doi: 10.1017/S1368980007000262. [DOI] [PubMed] [Google Scholar]
- 14.Kelishadi R. Childhood overweight, obesity, and the metabolic syndrome in developing countries. Epidemiol Rev. 2007;29:62–76. doi: 10.1093/epirev/mxm003. [DOI] [PubMed] [Google Scholar]
- 15.Mirzazadeh A, Sadeghirad B, Haghdoost A, Bahreini F, Kermani MR. The prevalence of obesity in Iran in recent decade; a systematic review and meta-analysis study. Iran J Public Health. 2009;38:1–11. [Google Scholar]
- 16.Flegal KM, Graubard BI, Williamson DF. Methods of calculating deaths attributable to obesity. Am J Epidemiol. 2004;160:331–8. doi: 10.1093/aje/kwh222. [DOI] [PubMed] [Google Scholar]
- 17.Azimi S, Khalili D, Hadaegh F, Mehrabi Y, Yavari P, Azizi F. Direct estimate of population attributable fraction of risk factors for cardiovascular diseases: Tehran Glucose and Lipid Study. Iran J Epidemiol. 2012;7:9–18. [Google Scholar]
- 18.Flegal KM, Panagiotou OA, Graubard BI. Estimating population attributable fractions to quantify the health burden of obesity. Ann Epidemiol. 2015;25:201–7. doi: 10.1016/j.annepidem.2014.11.010. [DOI] [PMC free article] [PubMed] [Google Scholar]
- 19.Levine BJ. The other causality question: Estimating attributable fractions for obesity as a cause of mortality. Int J Obes (Lond) 2008;32(Suppl 3):S4–7. doi: 10.1038/ijo.2008.81. [DOI] [PubMed] [Google Scholar]
- 20.Danaei G, Lu Y, Singh GM, Carnahan E, Stevens GA, Cowan MJ, et al. Cardiovascular disease, chronic kidney disease, and diabetes mortality burden of cardiometabolic risk factors from 1980 to 2010: A comparative risk assessment. Lancet Diabetes Endocrinol. 2014;2:634–47. doi: 10.1016/S2213-8587(14)70102-0. [DOI] [PMC free article] [PubMed] [Google Scholar]
- 21.Naghavi M, Abolhassani F, Pourmalek F, Lakeh M, Jafari N, Vaseghi S, et al. The burden of disease and injury in Iran 2003. Popul Health Metr. 2009;7:9. doi: 10.1186/1478-7954-7-9. [DOI] [PMC free article] [PubMed] [Google Scholar]
- 22.Vander HS, Ezzati M, Rodgers A, Lopez AD, Murry CJL. USA: Oxford University Press; 2004. Estimating attributable burden of disease from exposure and hazard data. [Google Scholar]
- 23.Ezzati M, Lopez AD, Rodgers A, Murray CJL. Geneva: World Health Organization; 2004. Comparative quantification of health risks: Global and regional burden of diseases attributable to selected major risk factors. [Google Scholar]
- 24.Mohammadi Y, Parsaeian M, Farzadfar F, Kasaeian A, Mehdipour P, Sheidaei A, et al. Levels and trends of child and adult mortality rates in the Islamic Republic of Iran, 1990-2013; protocol of the NASBOD study. Arch Iran Med. 2014;17:176–81. [PubMed] [Google Scholar]
- 25.Khosravi A, Taylor R, Naghavi M, Lopez AD. Mortality in the islamic republic of Iran, 1964-2004. Bull World Health Organ. 2007;85:607–14. doi: 10.2471/BLT.06.038802. [DOI] [PMC free article] [PubMed] [Google Scholar]
- 26.Lim SS, Vos T, Flaxman AD, Danaei G, Shibuya K, Adair-Rohani H, et al. A comparative risk assessment of burden of disease and injury attributable to 67 risk factors and risk factor clusters in 21 regions, 1990-2010: A systematic analysis for the Global Burden of Disease Study 2010. Lancet. 2013;380:2224. doi: 10.1016/S0140-6736(12)61766-8. [DOI] [PMC free article] [PubMed] [Google Scholar]
- 27.Mehdipour P, Navidi I, Parsaeian M, Mohammadi Y, Moradi Lakeh M, Rezaei Darzi E, et al. Application of Gaussian Process Regression (GPR) in estimating under-five mortality levels and trends in Iran 1990 - 2013, study protocol. Arch Iran Med. 2014;17:189–92. [PubMed] [Google Scholar]
- 28.Farzadfar F, Delavari A, Malekzadeh R, Mesdaghinia A, Jamshidi HR, Sayyari A, et al. NASBOD 2013: Design, definitions, and metrics. Arch Iran Med. 2014;17:7–15. [PubMed] [Google Scholar]
- 29.Kasaeian A, Eshraghian MR, Rahimi Foroushani A, Niakan Kalhori SR, Mohammad K, Farzadfar F. Bayesian autoregressive multilevel modeling of burden of diseases, injuries and risk factors in Iran 1990 - 2013. Arch Iran Med. 2014;17:22–7. [PubMed] [Google Scholar]
- 30.Parsaeian M, Farzadfar F, Zeraati H, Mahmoudi M, Rahimighazikalayeh G, Navidi I, et al. Application of spatio-temporal model to estimate burden of diseases, injuries and risk factors in Iran 1990-2013. Arch Iran Med. 2014;17:28–33. [PubMed] [Google Scholar]
- 31.Peykari N, Sepanlou SG, Djalalinia S, Kasaeian A, Parsaeian M, Ahmadvand A, et al. National and sub-national prevalence, trend, and burden of metabolic risk factors (MRFs) in Iran: 1990 - 2013, study protocol. Arch Iran Med. 2014;17:54–61. [PubMed] [Google Scholar]
- 32.Farzadfar F, Murray CJ, Gakidou E, Bossert T, Namdaritabar H, Alikhani S, et al. Effectiveness of diabetes and hypertension management by rural primary health-care workers (Behvarz workers) in Iran: A nationally representative observational study. Lancet. 2012;379:47–54. doi: 10.1016/S0140-6736(11)61349-4. [DOI] [PubMed] [Google Scholar]
- 33.Peykari N, Tehrani FR, Eftekhari MB, Malekafzali H, Dejman M, Neot R, et al. A peer-based study on adolescence nutritional health: A lesson learned from Iran. J Pak Med Assoc. 2011;61:549–54. [PubMed] [Google Scholar]
- 34.Jakicic JM, Clark K, Coleman E, Donnelly JE, Foreyt J, Melanson E, et al. American College of Sports Medicine position stand. Appropriate intervention strategies for weight loss and prevention of weight regain for adults. Med Sci Sports Exerc. 2001;33:2145–56. doi: 10.1097/00005768-200112000-00026. [DOI] [PubMed] [Google Scholar]
- 35.Stice E, Shaw H, Marti CN. A meta-analytic review of obesity prevention programs for children and adolescents: The skinny on interventions that work. Psychol Bull. 2006;132:667–91. doi: 10.1037/0033-2909.132.5.667. [DOI] [PMC free article] [PubMed] [Google Scholar]
- 36.Bray GA, Wadden TA. Improving long-term weight loss maintenance: Can we do it? Obesity (Silver Spring) 2015;23:2–3. doi: 10.1002/oby.20964. [DOI] [PubMed] [Google Scholar]
- 37.Lang A, Froelicher ES. Management of overweight and obesity in adults: Behavioral intervention for long-term weight loss and maintenance. Eur J Cardiovasc Nurs. 2006;5:102–14. doi: 10.1016/j.ejcnurse.2005.11.002. [DOI] [PubMed] [Google Scholar]
- 38.Anderson JW, Konz EC, Frederich RC, Wood CL. Long-term weight-loss maintenance: A meta-analysis of US studies. Am J Clin Nutr. 2001;74:579–84. doi: 10.1093/ajcn/74.5.579. [DOI] [PubMed] [Google Scholar]


