Abstract
The relationship between the structures of protein–ligand complexes existing in the crystal and in solution, essential in the case of fragment-based screening by X-ray crystallography (FBS-X), has been often an object of controversy. To address this question, simultaneous co-crystallization and soaking of two inhibitors with different ratios, Fidarestat (FID; Kd = 6.5 nM) and IDD594 (594; Kd = 61 nM), which bind to h-aldose reductase (AR), have been performed. The subatomic resolution of the crystal structures allows the differentiation of both inhibitors, even when the structures are almost superposed. We have determined the occupation ratio in solution by mass spectrometry (MS) Occ(FID)/Occ(594) = 2.7 and by X-ray crystallography Occ(FID)/Occ(594) = 0.6. The occupancies in the crystal and in solution differ 4.6 times, implying that ligand binding potency is influenced by crystal contacts. A structural analysis shows that the Loop A (residues 122–130), which is exposed to the solvent, is flexible in solution, and is involved in packing contacts within the crystal. Furthermore, inhibitor 594 contacts the base of Loop A, stabilizing it, while inhibitor FID does not. This is shown by the difference in B-factors of the Loop A between the AR–594 and AR–FID complexes. A stable loop diminishes the entropic energy barrier to binding, favoring 594 versus FID. Therefore, the effect of the crystal environment should be taken into consideration in the X-ray diffraction analysis of ligand binding to proteins. This conclusion highlights the need for additional methodologies in the case of FBS-X to validate this powerful screening technique, which is widely used.
Keywords: protein crystallography, mass spectrometry, ligand soaking, competitive binding, high resolution crystallography
INTRODUCTION
The problem of characterizing ligand binding is a fundamental one for drug design. X-ray crystallography is a widely used method to determine the interactions between a potential drug and its target.1 This technique has been used widely to establish structure–activity relations (SAR) in the design of ligands for a pharmaceutical target.2 The concept of fragment screening has become increasingly popular to establish binding sites for ligands.3
From the beginning of protein crystallography, the question of the relationship between the structure observed in the crystal and the structure in solution has been posed. This question is also relevant for ligand binding studies, which have been done extensively, mainly in pharmaceutical companies.4 In this case, it is important to know to what extent the crystalline state affects the binding of the ligand and in particular its affinity. For instance, it is known that ligands often increase the order of the target protein.5 This may have an effect on packing contacts. On the other hand, packing contacts could have an effect on ligand affinity. These questions are of great practical importance, since the possibility of ligand exchange in the crystal would greatly simplify binding experiments, for instance, the systematic screening of ligand–target complexes, as in the case of fragment-based screening by X-ray crystallography (FBS-X), a methodology used to determine hit compounds for a pharmaceutical target, which relies on the possibility of the competition between the ligands and their exchange in the crystal.
As has been noted several times in the past (for a recent example, see Ma et al.6), it is possible to bind multiple and diverse ligands to the same site of the protein in the crystal. The fact that different protein/ligand complexes have different unit cells and even different space groups might suggest that changing the ligand could change the crystal packing, for example, the cocrystallization experiment done with Saquinavir and Ritonavir versus HIV Protease.7
In order to compare binding occupancies in solution and in the crystal, we have designed a competition experiment in which two ligands targeting the same binding site of a protein are added simultaneously to the protein, and the experiment is repeated at different relative concentrations of the ligands. The binding occupancies are measured by mass spectrometry (MS) in solution and by X-ray crystallography by soaking the two inhibitors into a native crystal. The goal of the experiment is to accurately measure the ratios of ligand occupancies, and to determine whether there are changes when the complexes are in solution or in the crystalline state. We have also performed an experiment of simultaneous co-crystallization with two inhibitors.
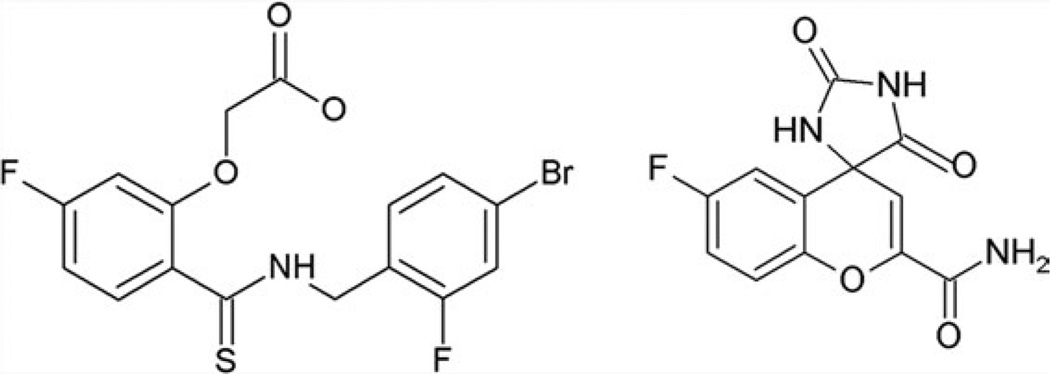
To be reliable, the experiment requires very accurate X-ray structures, temperature factors, and occupancies. We have, therefore, chosen to perform the experiments on human aldose reductase (AR), which diffracts up to 0.66 Å resolution.8 Also, to have significant differences, we have chosen two ligands, IDD-594 [594, Fig. 1(a)] and Fidarestat [FID, Fig. 1(b)], which have very strong, but different binding modes.8,9 All known inhibitors of AR bind to the so-called “anion binding pocket,” which is built by Tyr48, Lys77, His110, Trp111, and the cofactor nicotinamide adenine dinucleotide phosphate (NADP)+. Most of the known inhibitors are addressing this area of the pocket by the carboxylic acid or by the hydantoin moiety. On the other hand, some of them also have another moiety, which binds to the so-called “specificity pocket,” formed by residues of the three external loops of AR adjacent to the anion binding pocket.10 In solution, FID binds AR more strongly (with the hydantoin moiety; Kd: 6.5 nM11) than 594 (with the carboxylic acid moiety; Kd: 61 nM12), as confirmed in the present study by competition experiments monitored by native MS and by IC50 measurements. To characterize the binding in solution, we have also measured the IC50 values (a measure of binding in the case of an enzyme).
Figure 1.
(a) Chemical formula of 594; (b) chemical formula of FID.
This work shows that the binding occupancies are influenced by the crystal packing, and proposes an explanation. At the same time, we observe that it is possible to change very substantially the ligand binding site conformation while keeping the crystalline order, and indeed by keeping the same structure in most of the protein. This highlights the high adaptability of some proteins to different ligands. Thus, in spite of FBS-X suitability for obtaining high hit rates, alternative methodologies (like MS or surface plasmon resonance (SPR)) should be used in order to validate the results of this powerful high-throughput screening technique for the identification of drug leads.
MATERIALS AND METHODS
Native electrospray mass spectrometry
Prior to electrospray mass spectrometry (ESI-MS) experiments, purified AR was incubated with a two-fold molar excess of a freshly prepared NADP+ solution (Sigma Aldrich, St. Louis, MO). The holoenzyme was then dialyzed overnight at 4°C against 10 mM ammonium acetate buffer pH 6.8 using a 10 kDa molecular-weight cutoff Slide-A-Lyzer desalting unit (Thermo Scientific, Rockford, IL). Protein concentration was determined spectrophotometrically.
MS experiments were carried out on an electrospray time-of-flight mass spectrometer operating in the positive ion mode (MicrOTOF, Bruker Daltonics, Bremen, Germany). External calibration was done over the mass range m/z 500–5000 using the multiply charged ions produced by horse heart myoglobin (Sigma Aldrich, St. Louis, MO) diluted to 2 µM in 1:1 acetonitrile/water mixture acidified with 1% formic acid. Samples were continuously infused into the ESI ion source at a flow rate of 3 µL/min. In-source collision dissociation, ion energy and collision energy voltages were, respectively, set to 30 V, 2 V, and 6 V in order to preserve the integrity of non-covalent complexes while achieving sufficient ion desolvation in the gas phase.
Protein integrity was first checked under denaturing conditions by diluting the protein to 2 µM in 1:1 acetonitrile/water mixture acidified with 1% formic acid. The molecular weight measured under these conditions (36135.0 ± 0.6 Da) was found in good agreement with the mass of the apoenzyme calculated from its amino acid sequence (36134.6 Da—data not shown). Analysis of the holoenzyme in non-denaturing conditions leads to the detection of two major species: Species A corresponds to the apoprotein, while the Species B displays a mass difference of +744 Da and can therefore be assigned to the holoenzyme, that is, the protein complexed with one molecule of NADP+ (Fig. S1, Supporting Information). Competition experiments were performed by diluting the protein to 10 µM in 10 mM ammonium acetate buffer containing concentrations of FID (279.2 Da) and 594 (416.2 Da) ranging from 10 to 30 µM. Data processing was performed using Data Analysis 3.4 (MicrOTOF, Bruker Daltonics, Bremen, Germany).
Crystallographic studies
We first tried co-crystallization of AR containing two molar excess of cofactor NADP+, following the published conditions8 with two molar excess of both inhibitors, 594 and FID, simultaneously. X-ray data were collected at the Advanced Photon Source (APS) (Argonne, USA) in 19-ID Structural Biology Center (SBC) beamline13 and processed with the program HKL2000.14 The crystal structure was solved with molecular replacement (AMoRe15) using the Protein Data Bank (PDB) 2I16 entry.16 The resulting maps showed an electron density only for 594.
We then soaked simultaneously for 6 days the inhibitors FID and 594 in drops containing AR/NADP+ crystals obtained at 24°C, with a protein molar concentration (Conc) estimated in the drop of 0.27 mM, in three ratios of inhibitor concentrations (FID vs 594), as follows:
FID > 594. Conc (FID) = 1.5 mM (5.5 × Conc(AR)); Conc (594) = 0.5 mM (1.8 × Conc(AR)).
FID = 594. Conc (FID) = 1.5 mM (5.5 × Conc(AR)); Conc (594) = 1.5 mM (5.5 × Conc(AR)).
FID < 594. Conc (FID) = 0.5 mM (1.8 × Conc(AR)); Conc (594) = 1.5 mM (5.5 × Conc(AR)).
These three soaking conditions correspond to equal concentrations and excess of one or the other of a factor 3. X-ray data were collected in 19-ID SBC beamline at APS up to subatomic resolution (between 0.85 and 0.9 Å) and processed with the program HKL2000.14 The structures were solved by Molecular Replacement15 using the 2I16 PDB entry and refined with SHELXL.17 We will refer to them below as FID > 594, FID = 594, and FID < 594.
Refinement
In this work, two different PDB entries were used for the already published single-inhibitor AR–594 complex. PDB entry 2I16,16 refined at 0.81 Å (approximately the same resolution range of the presented data) from crystals measured at helium temperature (15 K) was used as the starting model for refinement of the models FID > 594, FID = 594, and FID < 594. PDB entry 1US0,8 re-refined in this work at 0.92 Å resolution (originally at 0.66 Å), from crystals measured at liquid nitrogen temperatures (100 K) was used for B-factor comparison, since the measurement temperature was the same as the one in this work. The refinement from the model 2I16 was carried out using the program SHELXL.17 First round of refinement for each model was performed with isotropic atomic displacement parameters (ADPs) values, then, ADPs were refined anisotropically. For the residues of the protein, distance, planarity and chiral volume restraints, and restraints for ADPs were applied. The anisotropic displacement components of the two bonded atoms along the line joining them were restrained to be equal (DELU restraints). The components of ADPs matrix were approximately equal for spatially closed atoms (SIMU restraints). An inspection of electron density maps and manual rebuilding of the model were done using the program Coot.18
While, at the first rounds of refinement, the model 2I16 with only 594 was used, negative peaks at Fobs − Fcalc difference map at positions of the atoms of the inhibitor indicated that occupancy of 594 was less than 1.00. At the same time, strong positive peaks in the difference map revealed also the presence of inhibitor FID in the active site. FID (PDB code 1PWM9) was fitted into the map, and inhibitors 594 and FID together with the corresponding alternative positions of residues 299–305 and 309 were modeled as two conformations, A and B. A number of water molecules were incorporated to these alternate models based on the distances from the corresponding residues. Occupancy values of the alternates A and B were refined by the program SHELX in constraint that the sum of occupancy values of these alternates was equal to 1.0.
The occupancy value of the bromine (Br) atom of the inhibitor 594 was estimated separately in the refinement because of debromination caused by radiation-induced damage, with the restriction that the B value of Br had to be approximately equal to the B value of the covalently bound carbon atom.
Atomic coordinates and experimental structure factors for the models FID > 594, FID = 594, and FID < 594 were deposited into the PDB and are accessible under the codes 2PEV, 2PF8, and 2PFH, correspondingly. The final R-factor values and other refinement statistics are given in Table I. The occupancy values of alternates A, B, and Br atoms are given in Table II.
Table I.
Data Collection and Refinement Statistics for FID > 594, FID = 594, and FID < 594 Models
| FID > 594 (2PEV) | FID = 594 (2PF8) | FID <594 (2PFH) | |
|---|---|---|---|
| Space group | P21 | P21 | P21 |
| a, b, c | 49.247, 66.667, 47.226 | 49.339, 66.815, 47.378 | 49.147, 66.553, 47.238 |
| α, β, γ | 90.00, 92.27, 90.00 | 90.00, 92.10, 90.00 | 90.0, 92.3, 90.00 |
| Resolution range (Å) | 50–0.90 (0.93–0.90) | 50–0.85 (0.88–0.85) | 50–0.85 (0.88–0.85) |
| Data collection | |||
| R-sym | 0.042 (0.344) | 0.034 (0.285) | 0.033 (0.235) |
| Completeness | 0.96 (0.93) | 0.99 (0.98) | 0.95 (0.69) |
| I/sigma(I) | 34.5 (3.6) | 33.7 (4.5) | 25.9 (5.8) |
| Measured reflections | 908,565 | 964,213 | 938,116 |
| Unique reflections | 216,325 | 267,837 | 253,545 |
| Redundancy | 4.2 (4.0) | 3.6 (3.3) | 3.7 (3.6) |
| Refinement | |||
| Number of reflections | 216,325 | 267,837 | 253,545 |
| Number of refined parameters | 36,221 | 36,921 | 35,241 |
| Total number of restraints | 53,881 | 55,761 | 51,709 |
| Rfree/Rwork (%) (models with hydrogen atoms) | 8.8/10.0 | 8.5/9.5 | 8.2/9.5 |
| R-factor for all the data (%) (models with hydrogen atoms) | 8.3 | 7.9 | 7.8 |
| Number of protein atoms | 3183 | 3098 | 3207 |
| <B> | <B> = 10.29 | <B> = 6.90 | <B> = 8.07 |
| Number of ions | 1 | 1 | 1 |
| <B> | <B> = 6.3 | <B> = 5.45 | <B> = 3.6 |
| Number of water molecules | 727 | 702 | 770 |
| <B> | <B> = 20.91 | <B> = 17.71 | <B> = 18.11 |
| Number of ligands | 4 | 5 | 5 |
| Number of atoms in ligands | 105 | 118 | 118 |
| <B> | <B> = 7.72 | <B> = 5.16 | <B> = 6.01 |
| <RMS> deviations | |||
| Bond length (Å) | 0.015 | 0.015 | 0.026 |
| Angle (°) | 0.034 | 0.036 | 0.055 |
Values in parentheses are for the last shell.
Table II.
Occupancy Values Obtained During the Main and Additional Rounds of Refinement of the Models FID > 594, FID = 594, and FID < 594
| FID > 594 (2PEV) | FID = 594 (2PF8) | FID < 594 (2PFH) | |
|---|---|---|---|
| Occupancy values of | |||
| Alternate A (inhibitor 594 and residues 299–305, 309 and water molecules) | 0.43 | 0.63 | 0.8 |
| Alternate B (inhibitor FID and residues 299–305, 309 and water molecules) | 0.57 | 0.37 | 0.2 |
| Occupancy value of Br atom of 594 refined separately | 0.4 | 0.6 | 0.76 |
| Occupancy values of the inhibitors refined separately | |||
| Inhibitor 594 | 0.43 | 0.63 | 0.8 |
| Inhibitor FID | 0.57 | 0.37 | 0.2 |
| Occupancy values of the loop 299–305 refined separately | |||
| Conformation A | 0.43 | 0.61 | 0.79 |
| Conformation B | 0.57 | 0.39 | 0.21 |
| Occupancy of 309 residue refined separately | |||
| > Conformation A | 0.4 | 0.63 | 0.78 |
| > Conformation B | 0.6 | 0.37 | 0.22 |
| Occupancy of the part of inhibitor 594 refined separately | 0.42 | 0.64 | 0.79 |
Comparison of the models FID > 594, FID = 594, and FID < 594 with the models containing only single-inhibitor AR–594 (2I16 and 1US0) and single-inhibitor FID (1PWM) revealed that all the conformations that were built in these two models also exists in the models FID > 594, FID = 594, and FID < 594. Similar observations can be done concerning water molecules. All the water molecules that were observed in the models 2I16 and 1US0 (594), and 1PWM (FID), were also observed in the models FID > 594, FID = 594, and FID < 594 (but with different occupancy values).
After the main refinement was finished, a few additional rounds of occupancy refinement were performed in which occupancy values of the inhibitors and residues in the vicinity of the active site were explored. Instead of only two alternates A and B, several independent alternates were considered. Occupancy values of the inhibitors, residues 299–305, and residue 309, were assigned by different variables and were refined independently from each other. Inhibitor 594 was considered as consisting of two parts, and occupancy values of each part were refined separately. The goal of these additional rounds of refinement was to determine to what extent occupancy values will deviate from the values that were obtained as a result of refinement of two unique alternates A and B. The final occupancy values are presented in Table II. For all three models, the difference between occupancy values obtained during main and additional rounds of refinement is very small, which can be considered as a confirmation that the approach to refine everything together as two alternates A and B was correct.
For the calculation of B-factors for the loop 122–130, the models for the single-inhibitor AR–594 complex (1US0), the single-inhibitor AR–FID complex (1PWM), the double-inhibitor FID = 594, and the double-inhibitor FID < 594 were all refined anisotropically at 0.92 Å resolution (the limit of the 1PWM data) using the program SHELX. The model and structure factor data for entries 1US0 (AR–594; 100 K data) and 1PWM (AR–FID; 100 K data) were downloaded from the PDB. The model FID > 594 was excluded from this analysis because, in the loop 122–130, some residues are in double conformation. The model 2I16 was not used in this comparison, because the data for this model were collected at 15 K.
IC50 studies
The IC50 activity assays were carried out according to a previously described method,19 based on the quantification of NADPH consumption which takes place when the enzyme catalyses the conversion of glyceraldehyde into glycerol. The assays were performed at 25°C in 100 mM sodium phosphate buffer pH 7.0, with AR protein amount to reach Vmax and 0.2 mM NADPH. The final reaction volume was of 500 µL per reaction. Both compounds assayed were dissolved in dimethyl sulfoxide, and the corresponding solution was added to the cell and incubated for 5 min at 25°C prior to addition of the substrate. The reaction was initiated by addition of 1 mM glyceraldehyde and the decrease in optical density at 340 nm was monitored for 3 min at 25°C in a UV–vis spectrophotometer (UV-1700 PharmaSpec, Shimadzu). The IC50 value was determined as the compound concentration that inhibits enzymatic activity by 50%. IC50 was calculated using the Grafit program (version 5.0; Erithacus Software) and values were given as the mean of three experiments ± the standard deviation.
RESULTS AND DISCUSSION
Solution studies
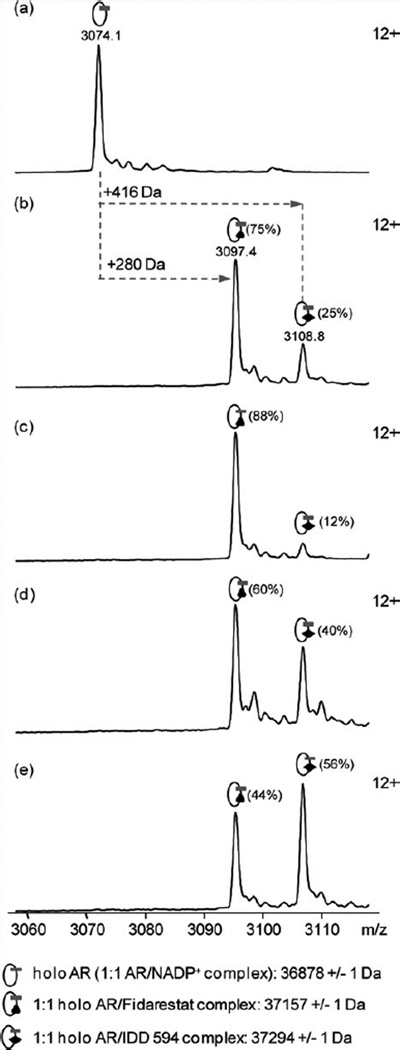
MS: Relative binding affinities of 594 and FID for AR were first studied in solution by native MS. To rank these ligands according to their binding affinity, competition experiments were carried out in solution by incubating AR with mixtures containing different concentration ratios of 594 and FID. Relative proportion of each complex was determined from relative peak height of the 12+ charge states assuming that the binding of these small ligands does not affect the protein response factor.20–22
In the absence of any ligand, ESI mass spectrum shows the detection of the 1:1 AR–NADP+, further on called holo AR [Fig. 2(a)]. Analysis performed in the presence of equimolar concentrations of both compounds (10 µM, each) reveals the formation of 1:1 holo AR–FID (75%) as well as 1:1 holo AR–594 (25%) [Fig. 2(b)], with the population of AR–FID (75%) three times higher than that of AR–594 (25%). Doubling either FID or 594 concentration again leads to higher proportions of 1:1 holo AR–FID complex (88% and 60%, respectively) confirming that FID displays a higher binding affinity to AR than 594 [Fig. 2(c,d)]; tripling the 594 leads to a distribution of 44% for FID and 56% for 594 [Fig. 2(e)]. Assuming that the peak height is proportional to the concentration and inversely proportional to the Kd, we can calculate that the ratio between the Kd of 594 and of FID is 2.7 ± 0.3.
Figure 2.
Competition experiments in solution monitored by native mass spectrometry. Holo AR was diluted to 10 µM in 10 mM ammonium acetate pH 6.8 either (a) alone or in the presence of (b) 10 µM FID + 10 µM 594, (c) 20 µM FID + 10 µM 594, (d) 10 µM FID + 20 µM 594, and (e) 10 µM FID + 30 µM 594. Mass spectra represent the +12 charge states of holo AR and holo AR/ligand complexes. Relative intensity of each species is given in brackets.
IC50: In order to check whether the observations obtained for the experiments in solution by MS were reliable, IC50 values for both inhibitors against AR were measured. As stated before, the IC50 value was determined as the compound concentration that inhibits enzymatic activity by 50%. This is the parameter checked in pharmaceutical screens for AR.23 Values obtained were 26 ± 2 nM for FID and 124 ± 10 nM for 594. If we assume that the IC50 values are proportional to Kd, the ratio between the Kd of 594 and of FID is 4.8. Both FID and 594 display uncompetitive inhibition, as most of AR inhibitors (ARIs).24 Moreover, we have compared them in the same experimental conditions, which means that IC50 is at least a relative parameter which allows to compare the binding of both inhibitors. Also, for uncompetitive inhibitors, IC50 values approximate Ki when the substrate concentration used in the assay is much higher than Km, as seen in the Cheng–Prusoff derived equation.25 Thus, the IC50 value in this enzyme assay really does provide a measure of binding.
Thus, both MS gas-phase measurements and IC50 solution studies indicate that FID is the strongest binder. This is even more the case in the published11,12 isothermal titration calorimetry (ITC) studies, for which the ratio between the Kd of 594 and of FID is 10.
X-ray crystallography
The Fobs − Fcalc difference map reveals a density corresponding to the superposition of both inhibitors, with evident atomic peaks for every atom (Fig. 3). The refinement results show that the crystallographic occupancy values (Table II) increase or decrease according to the variation of the soaking concentrations.
Figure 3.
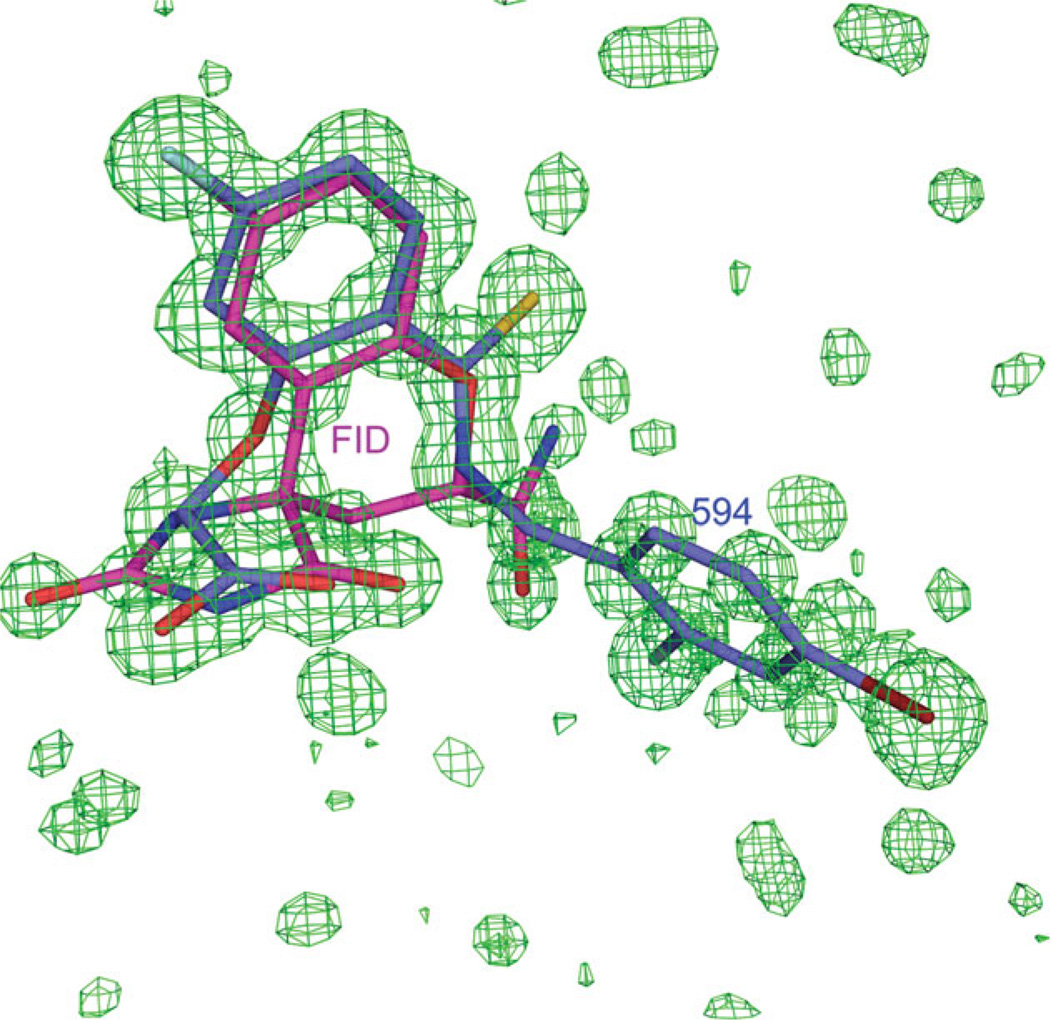
Difference map for the FID = 594 structure data shows the superposition of the inhibitors 594 and FID in the active site. The Fobs − Fcalc density map in green is contoured at 3σ. The models of the inhibitors 594 and FID are colored in blue and magenta, respectively.
For the case of FID = 594, for which the soaking concentrations of inhibitors were equal, the occupancy of 594 is ~1.7 times higher than the occupancy of FID.
Effect of experimental conditions used in ligand binding
It is important to pay attention to the fact that the binding affinity is highly dependent on buffer conditions used. The buffers used in the different methodologies shown here have been chosen in a compromise between keeping the protein full functional and a proper adaptation to each methodology. The buffer used for the IC50 analysis is 100 mM sodium phosphate buffer pH 7.0. The protein is fully active in these pH conditions, as described.26 For native MS, a 10 mM ammonium acetate pH 6.8 buffer was used. MS is a powerful method for analyzing the active forms of macromolecular complexes of biomolecules. However, such native analyses cannot be performed when solutions contain high concentrations of non-volatile salts (like in the IC50 assay). Addition of ammonium acetate can improve signal stability and reproducibility for native MS assays, and can significantly lower adduction and background signals.27 Anyway, MS conditions might not alter AR activity, as shown in the native MS analysis of the holoenzyme, where NADP+ is bound to AR. For ITC, in the articles cited, AR was prepared in 10 mM HEPES buffer pH 8.0. Phosphate buffers are known to have a very small enthalpy of ionization under these conditions, whereas HEPES has a much larger value.28 If the selected buffer has a large enthalpy of ionization, the measured enthalpy will reflect both buffer ionization and complex formation. This can be quite informative if one wishes to determine whether protons are taken up or released on complex formation.29 Finally, crystallization conditions used were with 50 mM di-ammonium citrate at pH 5.0 (protein buffer) and 50 mM di-ammonium citrate at pH 5.0, 20% polyethylene glycol (PEG) 6000 (reservoir), as detailed before.8,30 This condition is mandatory for growing crystals. Anyway, both NADP+ and the carboxylate group are charged, as it can be observed in the crystallographic structures. In the case of carboxylate, equal bond lengths C—O indicated that it is charged.8 This is coincident with the described reaction mechanism of AR and uncompetitive inhibition displayed by both inhibitors.10,31
Indeed, differences in experimental conditions allow only a qualitative comparison between results. Anyway, all the methodologies considered here ensure the full functionality of the enzyme and, thus, they are feasible to study ligand binding potency.
Structural explanation of differences between solution and X-ray crystallography studies
As discussed above, MS studies indicate a 2.7 times higher occupancy of FID vs 594, while X-ray crystallography indicates a 0.6 times lower occupancy. There is a significant difference (4.6 times) in occupancy ratios. Other solution studies indicate also a stronger binding of FID vs 594 (4.8 times for IC50 studies, 10 times for ITC). Both soaked ligands are highly soluble and can enter to the active site pocket, which is accessible. This is also proven because AR has been shown as active in the crystalline form32 and because the soaking time assayed is long (6 days), allowing the system to reach equilibrium. Thus, kinetic effects are not relevant in these conditions (but they are relevant for short time scales), while thermodynamics is guiding the ligand binding.
We searched, therefore, a structural explanation for the favored binding of 594 vs FID in the crystal. FID binds only to the active site pocket (or anion binding pocket) (Fig. 4), while 594 binds both to the active site pocket and also to the specificity pocket (Fig. 4). Loop A, containing the residues 122–130 (in yellow in Fig. 4) is in closer contact with 594 than with FID. In the case of 594, the specificity pocket (marked by S), which is occupied by the inhibitor, is at the base of this loop, as shown in Figure 4. The last ring of 594 has close hydrophobic contacts with Leu 300 and Phe 122 [Fig. 4(b)], which is itself in contact with Ala 130 (Fig. 5). Therefore, 594 binds the base of the loop, decreasing its flexibility. The effect of the inhibitor binding is seen in the configuration of Loop A. For the structures FID > 594 and FID = 594, the configuration is similar to that observed in the published structures of single-inhibitor AR–594 (PDB 1US0 and 2I16), while for the structure FID > 594 there are two conformations corresponding to the structures with the individual inhibitors (Fig. 6, magenta for the single-inhibitor AR–FID complex (1PWM) conformation, and cyan for the single-inhibitor AR–594 complex (1US0 and 2I16) conformation). The symmetry-related residues are shown in yellow, and the complexes in which they appear are indicated in the labels. Note that the contacts are similar, but not identical. In particular, symmetry-related residue Glu 29 has two conformations in the single-inhibitor AR–594 complex, both making an H-bond with Ser 127, and one conformation in the single-inhibitor AR–FID complex. We have studied the effect of the different contacts of the inhibitor with Loop A and the different packing contacts by looking at the temperature factors of the Loop A residues for the different structures. As shown in Figure 7, B-factors in the single-inhibitor AR–FID structure are clearly higher than those in the single-inhibitor AR–594 one, and the B-factors in the double-inhibitor structures FID < 594 and FID = 594 are intermediate. Those in the structure FID > 594 are not shown, since the loop has two conformations, as shown in Figure 6. Thus, Loop A is more flexible in the crystal of AR–FID than in the crystal of AR–594, most likely due to the contacts of 594 with Phe 122 (Fig. 5), which restrains the mobility of Loop A. The stabilization of this loop diminishes the entropy cost involved in fixing the conformation of Loop A during crystallization. Therefore, the binding of 594 favors crystallization, and vice versa: the crystal packing favors the binding of 594 over the binding of FID. This can explain the difference between the occupancy ratios in solution and in the crystal.
Figure 4.
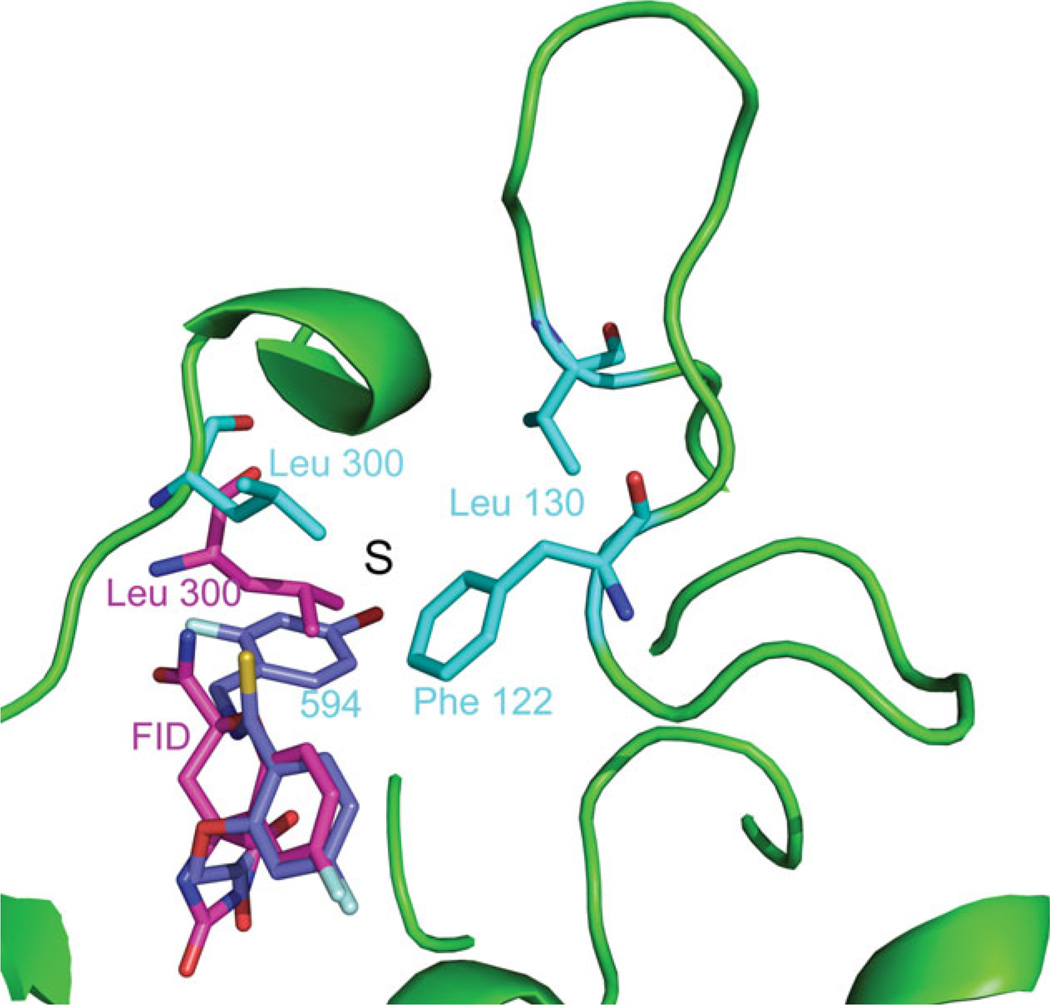
Difference in the binding of the inhibitors 594 and FID in the structure FID>594. Inhibitor FID (magenta) binds only to the active site while 594 (violet) binds both to the active site and to the specificity pocket (marked S). Residues Phe 122, Leu 130, and Leu 300 in the conformation that binds 594 are shown in cyan, and residue Leu 300 in the conformation that binds FID is shown in magenta. The cartoon representation of the fold in the conformation that binds 594 is shown in green.
Figure 5.
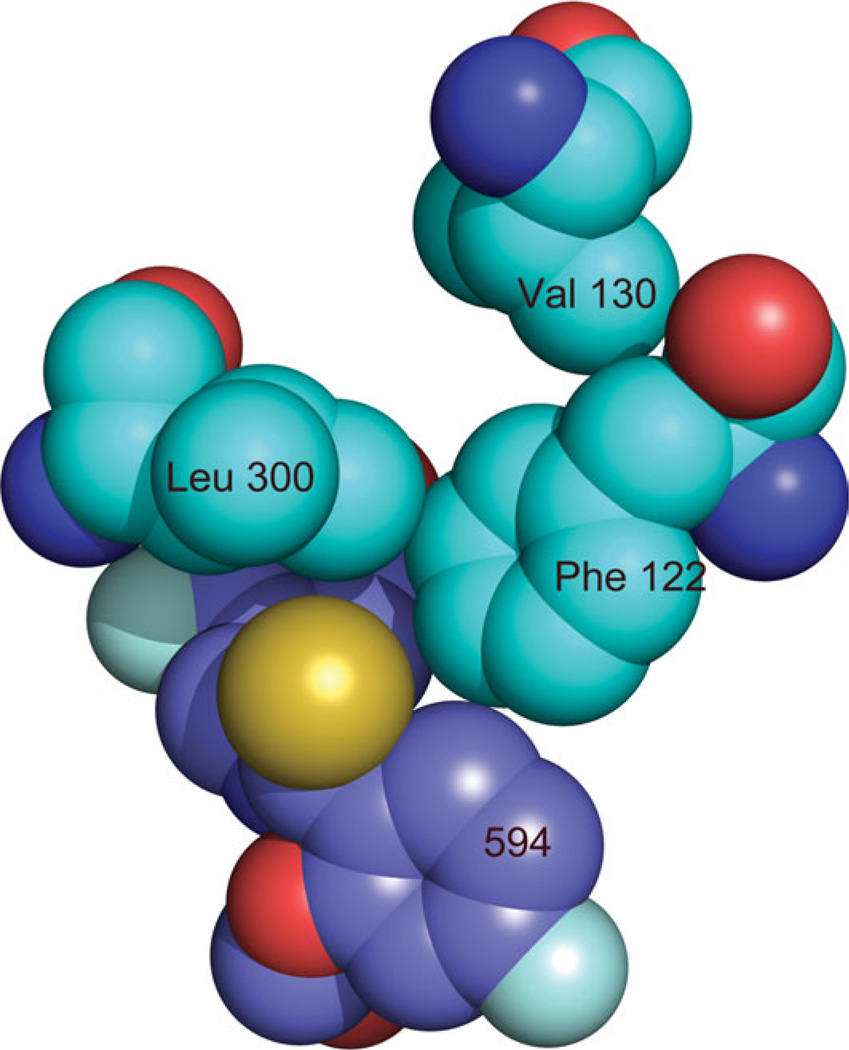
Detail of the interaction of 594 with Phe 122 and Leu 300 shows their close contact.
Figure 6.
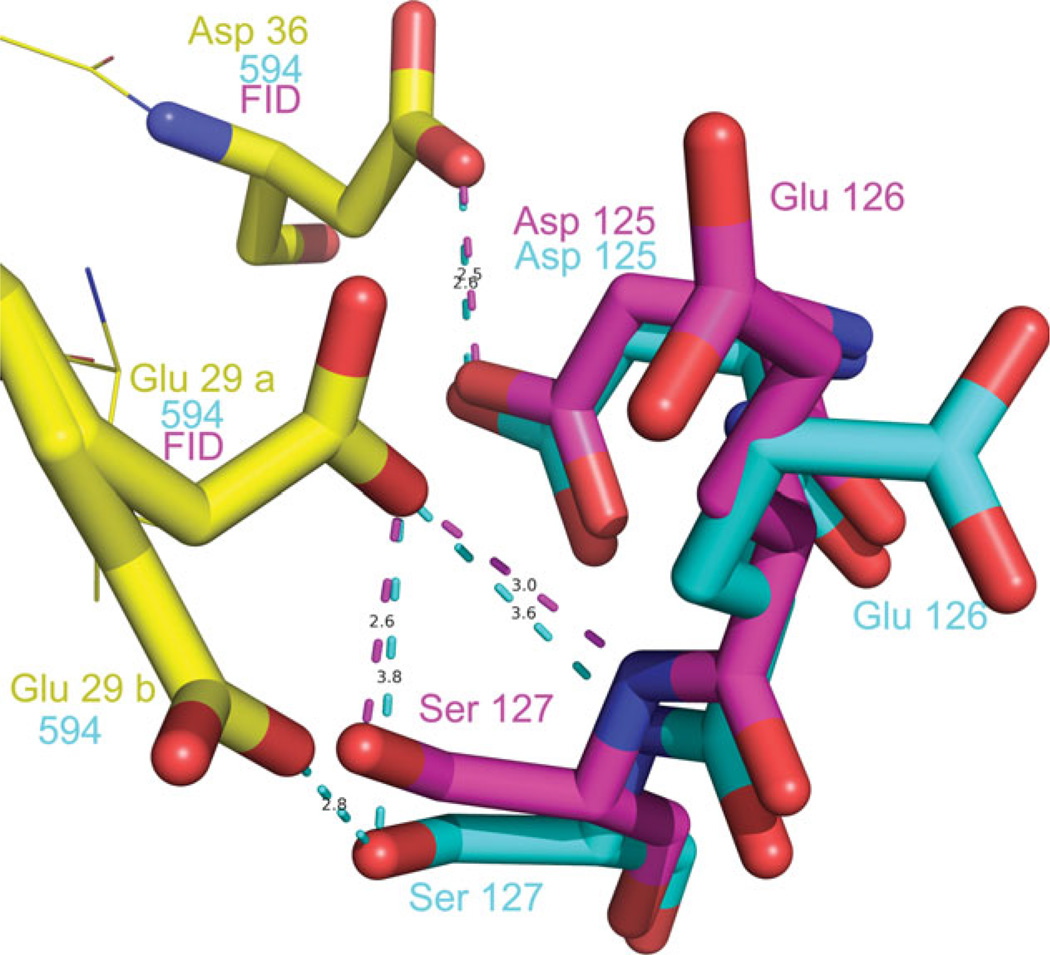
Crystal packing contacts of Loop A (residues 125–127) in the structure FID>594. Two conformations are observed for these residues, one corresponding to the single-inhibitor complex AR–594 (1US0), shown in cyan, and the other to the single-inhibitor AR–FID (1PWM), shown in magenta. The symmetry-related residues Asp 36 and Glu 29 are shown in yellow, and labeled with “FID” and “594” according to their appearance in the structures of the single-inhibitor complexes AR–594 and AR–FID. Note that conformation B of Glu 129, making an H-bond with Ser 127, appears only in the single-inhibitor AR–594 complex and not in the single-inhibitor AR–FID complex.
Figure 7.
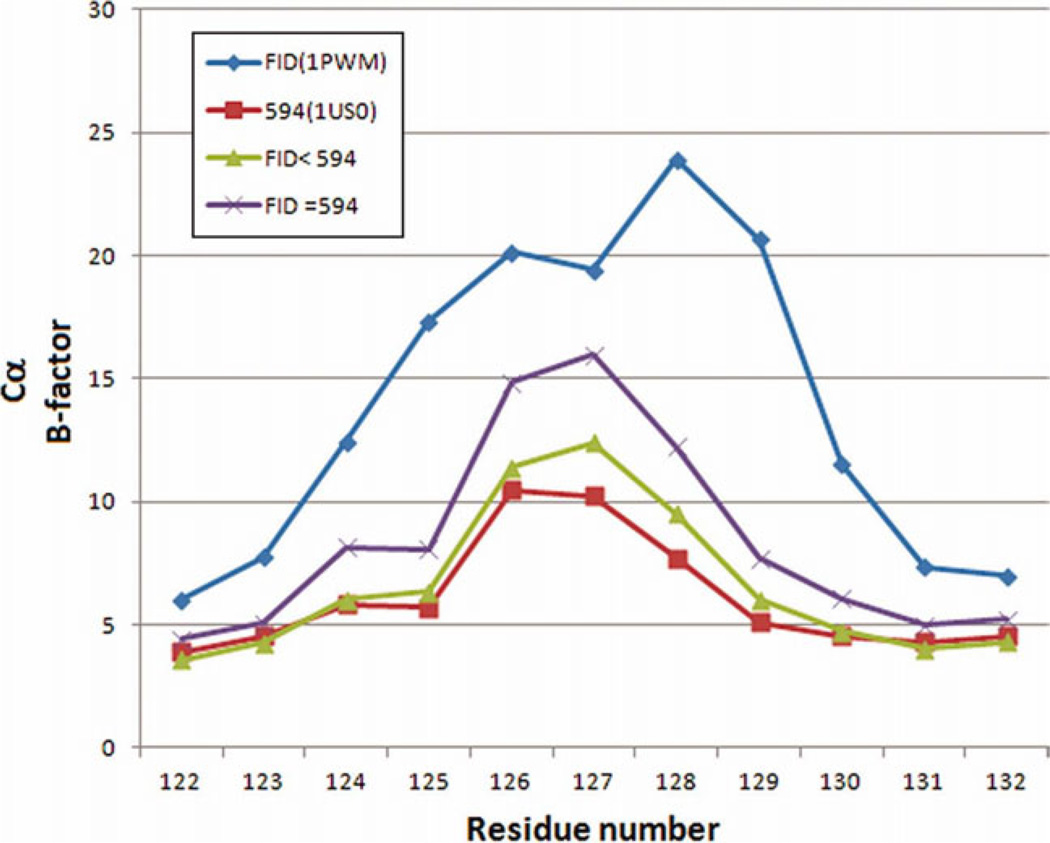
Comparison of atomic B values in the loop 122–130 for the structures of single-inhibitor AR–FID, single-inhibitor AR–594, FID = 594 and FID < 594. [Color figure can be viewed in the online issue, which is available at wileyonlinelibrary.com.]
It is interesting to see that the opening of the specificity pocket by 594 implies a large conformational change around residues 300–301 (see Fig. 4), and both conformations are seen in the electron density maps. This is also true for water molecules, which are different for the two conformations of the active site (see Fig. 8). Note that both sets of water molecules appear in the crystals of FID > 594, FID = 594, and FID < 594 in the same positions that they appear in the structures of complexes of single-inhibitor AR–FID complex (1PWM) and single-inhibitor AR–594 solved independently (PDB 1US0 and 2I16).
Figure 8.
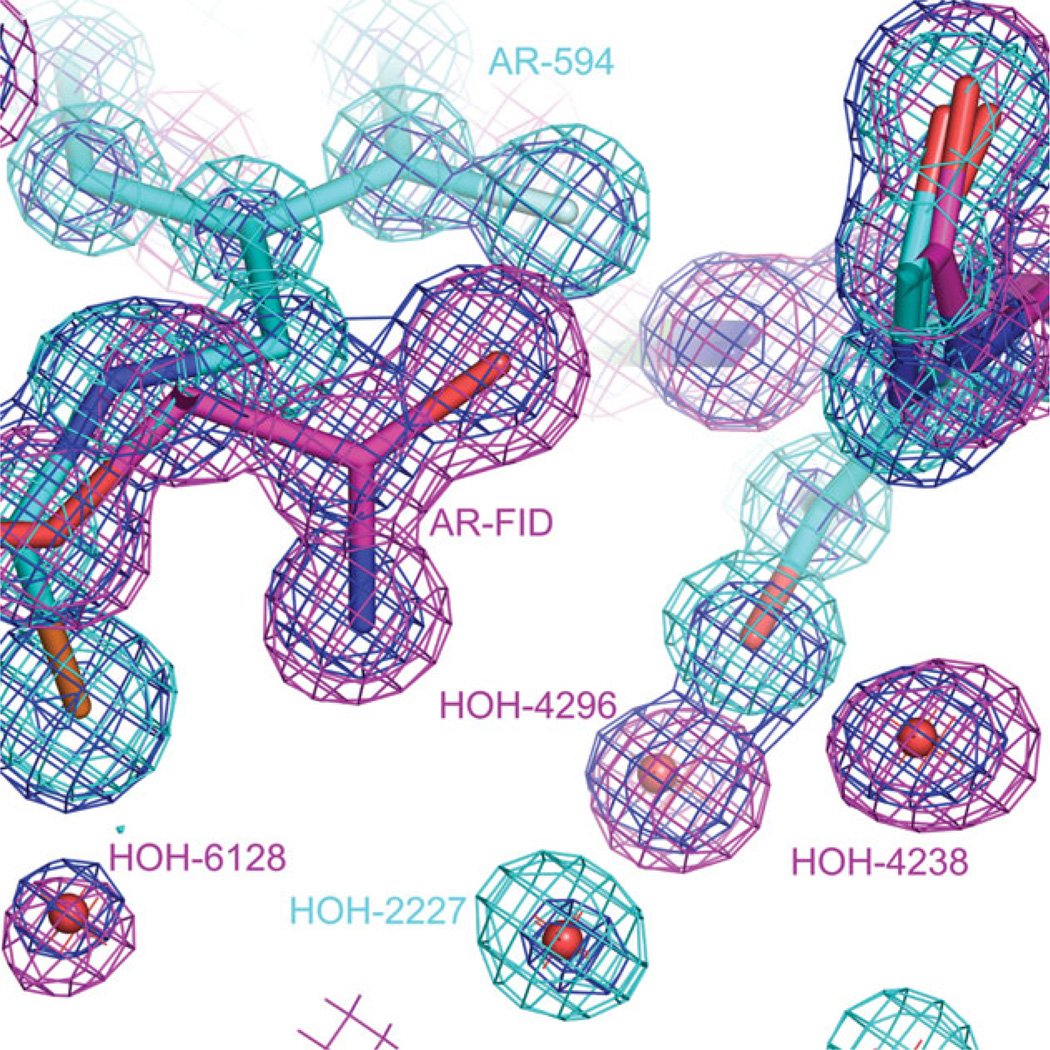
Water molecules in the active site of FID > 594. The active site contains water molecules that were observed both in the single-inhibitor AR–594 complex (2I16) and in single-inhibitor AR–FID complex (1PWM). Water molecule 2227 is present in model 2I16 and not present in model 1PWM. Water molecules 4296, 6128, and 4238 are present in model 1PWM and not present in model 2I16. 2Fo − Fcalc maps are shown for the models 2I16 (colored magenta), 1PWM (colored green), and FID>594 (colored blue). All three maps are contoured at 1.4 σ.
CONCLUSIONS
Crystallographic studies usually concern a complex of an enzyme with a single ligand, and the main assumption is that the observations in the crystal can be extrapolated to predict the binding in solution. We have asked the question whether more than one ligand can be tried in a crystallographic experiment, and to which extent the crystalline state affects ligand binding. This is especially relevant for FBS-X screenings, used to identify novel lead compounds by academic institutions and pharmaceutical companies.33
Two different types of competition experiments have been performed, as follows:
In the co-crystallization experiments with two inhibitors simultaneously, FID and 594, only 594 is fixed. Furthermore, the resolution obtained for the X-ray diffraction data is higher for single-inhibitor AR–594 crystal (0.66 Å) than for single-inhibitor AR–FID crystal (0.9 Å). A possible explanation for this observation is that the binding of the AR–594 complex to the growing crystal is energetically more favorable than that of the AR–FID complex. Therefore, during the crystal growth the AR–594 complex will replace the AR–FID complex, leading to a crystal with only AR–594.
In the soaking experiments, the results described above show that competition for the same site between different ligands is indeed possible in the crystalline state, and that the relative occupancy of the ligands is to a first approximation proportional to the soaking concentrations. An important corollary of this observation is that when the binding site in the protein crystal remains accessible for ligands by soaking, there is always equilibrium between bound and unbound states, even with several inhibitors.
The question still remains of the influence of the crystal packing on the binding equilibrium. In this work, we have tackled this problem and obtained the following results: the occupancy of 594 in the crystal is ~1.7 times higher than binding of FID, while in solution the occupancy of FID is ~2.7 times stronger than the occupancy of 594 (shown by MS). These observations have been linked to a change in the order of the Loop A (residues 122–130). Indeed, the ligand 594 fixes this loop through interactions with Phe 122. As this loop intervenes in packing contacts, its ordering favors crystallization. Therefore, the relation between the packing and the binding is established for this case, and linked to ligand-induced changes in the order of protein regions involved in packing contacts. We can interpret this as a supplementary “crystal packing” ligand binding energy term, which can explain the difference between the occupancy ratios in solution and in the crystal as well as the obtention of crystals of AR–594 alone in co-crystallization experiments with both inhibitors. Nevertheless, this effect has a weak influence on the overall binding energy, which remains dominated by the local interactions of the ligand with the target. In summary, the main assumption of extrapolation of results of crystallographic studies to studies in solution and eventually to in vivo binding can be biased due to the effect of crystallographic contacts. This strongly supports the use of additional techniques (i.e., like MS or SPR) to further characterize binding in solution and to validate FBS-X screenings. This later point is being nowadays reinforced by several publications in the drug-design field.34,35 Overall, the case of AR is an illustrative example of the influence of the crystal environment in crystallographic studies of ligand binding to proteins.
ACKNOWLEDGMENTS
Authors thank the personnel of SBC, ANL for their help in data collection. They also thank the personnel of the Department of Integrative Biology, IGBMC, for their assistance.
Grant sponsors: Centre National de la Recherche Scientifique (CNRS), the Institut National de la Santé et de la Recherche Médicale (INSERM), the Hôpital Universitaire de Strasbourg (H.U.S), the Université de Strasbourg (UdS), Région Alsace. French Ministère de la Recherche; Grant sponsor: Russian Foundation for Basic Research; Grant number: RFBR 10-04-00254-a; Grant sponsor: the U. S. Department of Energy, Office of Biological and Environmental Research, under contract DE-AC02-06CH11357.
Footnotes
Additional Supporting Information may be found in the online version of this article
REFERENCES
- 1.Danley DE. Crystallization to obtain protein-ligand complexes for structure-aided drug design. Acta Crystallogr D Biol Crystallogr. 2006;62(Part 6):569–575. doi: 10.1107/S0907444906012601. [DOI] [PubMed] [Google Scholar]
- 2.Rondeau J, Klebe G, Podjarny A. Ligand binding: the crystallographic approach. In: Podjarny A, Dejaegere A, Kieffer B, editors. Biophysical approaches determining ligand binding to biomolecular targets: detection, measurement and modelling. modelling. Vol. 1: Biomolecular sciences. London: RSC Publishing; 2011. pp. 56–135. [Google Scholar]
- 3.Blundell TL, Jhoti H, Abell C. High-throughput crystallography for lead discovery in drug design. Nat Rev Drug Discov. 2002;1:45–54. doi: 10.1038/nrd706. [DOI] [PubMed] [Google Scholar]
- 4.Skarzynski T, Thorpe J. Industrial perspective on X-ray data collection and analysis. Acta Crystallogr D Biol Crystallogr. 2006;62(Part 1):102–107. doi: 10.1107/S0907444905034281. [DOI] [PubMed] [Google Scholar]
- 5.Cimmperman P, Matulis D. Protein thermal denaturation measurements via a fluorescent dye. In: Podjarny A, Dejaegere A, Kieffer B, editors. Biophysical approaches determining ligand binding to biomolecular targets: detection, measurement and modelling. Vol. 1: Biomolecular sciences. London: RSC Publishing; 2011. pp. 247–274. [Google Scholar]
- 6.Ma B, Shatsky M, Wolfson HJ, Nussinov R. Multiple diverse ligands binding at a single protein site: a matter of pre-existing populations. Protein Sci. 2002;11:184–197. doi: 10.1110/ps.21302. [DOI] [PMC free article] [PubMed] [Google Scholar]
- 7.Olajuyigbe F, Geremia S. Characteristic ligand-induced crystal forms of hiv-1 protease complexes: A novel discovery of x-ray crystallography. The Abdus Salam International Centre for Theoretical Physics. 2009 http://users.ictp.it/~pub_off/preprints-sources/2009/IC2009084P.pdf. [Google Scholar]
- 8.Howard EI, Sanishvili R, Cachau RE, Mitschler A, Chevrier B, Barth P, Lamour V, Van Zandt M, Sibley E, Bon C, Moras D, Schneider TR, Joachimiak A, Podjarny A. Ultrahigh resolution drug design. I. Details of interactions in human aldose reductase-inhibitor complex at 0.66 A. Proteins. 2004;55:792–804. doi: 10.1002/prot.20015. [DOI] [PubMed] [Google Scholar]
- 9.El-Kabbani O, Darmanin C, Schneider TR, Hazemann I, Ruiz F, Oka M, Joachimiak A, Schulze-Briese C, Tomizaki T, Mitschler A, Podjarny A. Ultrahigh resolution drug design. II. Atomic resolution structures of human aldose reductase holoenzyme complexed with Fidarestat and Minalrestat: implications for the binding of cyclic imide inhibitors. Proteins. 2004;55:805–813. doi: 10.1002/prot.20001. [DOI] [PubMed] [Google Scholar]
- 10.El-Kabbani O, Podjarny A. Selectivity determinants of the aldose and aldehyde reductase inhibitor-binding sites. Cell Mol Life Sci. 2007;64:1970–1978. doi: 10.1007/s00018-007-6514-3. [DOI] [PMC free article] [PubMed] [Google Scholar]
- 11.Petrova T, Steuber H, Hazemann I, Cousido A, Mitschler, Chung R, Oka M, Klebe G, El-Kabbani O, Joachimiak A, Podjarny A. Factorizing selectivity determinants of inhibitor binding towards aldose and aldehyde reductases: structural and thermodynamic properties of the ALR2 mutant Leu300Pro/Fidarestat Complex. J Med Chem. 2005;48:5659–5665. doi: 10.1021/jm050424+. [DOI] [PubMed] [Google Scholar]
- 12.Koch C, Heine A, Klebe G. Tracing the detail: how mutations affect binding modes and thermodynamic signatures of closely related aldose reductase inhibitors. J Mol Biol. 2011;406:700–712. doi: 10.1016/j.jmb.2010.11.058. [DOI] [PubMed] [Google Scholar]
- 13.Rosenbaum G, Alkire RW, Evans G, Rotella FJ, Lazarski K, Zhang RG, Ginell SL, Duke N, Naday I, Lazarz J, Molitsky MJ, Keefe L, Gonczy J, Rock L, Sanishvili R, Walsh MA, Westbrook E, Joachimiak A. The Structural Biology Center 19ID undulator beamline: facility specifications and protein crystallographic results. J Synchrotron Radiat. 2006;13:30–45. doi: 10.1107/S0909049505036721. [DOI] [PMC free article] [PubMed] [Google Scholar]
- 14.Otwinowski Z, Minor W. Processing of X-ray Diffraction Data Collected in Oscillation Mode. Methods Enzymol. 1997;276:307–326. doi: 10.1016/S0076-6879(97)76066-X. [DOI] [PubMed] [Google Scholar]
- 15.Navaza J. Implementation of molecular replacement in AMoRe. Acta Crystallogr D Biol Crystallogr. 2001;57(Part 10):1367–1372. doi: 10.1107/s0907444901012422. [DOI] [PubMed] [Google Scholar]
- 16.Petrova T, Ginell S, Mitschler A, Hazemann I, Schneider T, Cousido A, Lunin VY, Joachimiak A, Podjarny A. Ultra high-resolution study of protein atomic displacement parameters at cryotemperatures obtained with a helium cryostat. Acta Crystallogr D Biol Crystallogr. 2006;62:1535–1544. doi: 10.1107/S0907444906041035. [DOI] [PubMed] [Google Scholar]
- 17.Sheldrick GM, Schneider TR. SHELXL: high-resolution refinement. Methods Enzymol. 1997;277:319–343. [PubMed] [Google Scholar]
- 18.Emsley P, Cowtan K. Coot: model-building tools for molecular graphics. Acta Crystallogr D Biol Crystallogr. 2004;60:2126–2132. doi: 10.1107/S0907444904019158. [DOI] [PubMed] [Google Scholar]
- 19.de la Fuente JA, Manzanaro S, Martín MJ, de Quesada TG, Reymundo I, Luengo SM, Gago F. Synthesis, activity, and molecular modeling studies of novel human aldose reductase inhibitors based on a marine natural product. J Med Chem. 2003;46:5208–5221. doi: 10.1021/jm030957n. [DOI] [PubMed] [Google Scholar]
- 20.Jecklin MC, Touboul D, Jain R, Toole EN, Tallarico J, Drueckes P, Ramage P, Zenobi R. Affinity classification of kinase inhibitors by mass spectrometric methods and validation using standard IC(50) measurements. Anal Chem. 2009;81:408–419. doi: 10.1021/ac801782c. [DOI] [PubMed] [Google Scholar]
- 21.Jorgensen TJD, Roepstorff P, Heck AJR. Direct determination of solution binding constants for noncovalent complexes between bacterial cell wall peptide analogues and vancomycin group antibiotics by electrospray ionization mass spectrometry. Anal Chem. 1998;70:4427–4432. [Google Scholar]
- 22.Peschke M, Verkerk UH, Kebarle P. Features of the ESI mechanism that affect the observation of multiply charged noncovalent protein complexes and the determination of the association constant by the titration method. J Am Soc Mass Spectrom. 2004;15:1424–1434. doi: 10.1016/j.jasms.2004.05.005. [DOI] [PubMed] [Google Scholar]
- 23.Van Zandt M, Jones M, Gunn D, Geraci L, Jones J, Sawicki D, Sredy J, Jacot J, Dicioccio A, Petrova T, Mitschler A, Podjarny A. Discovery of 3-[(4,5,7-trifluorobenzothiazol-2-yl)methyl]indole-N-acetic acid (lidorestat) and congeners as highly potent and selective inhibitors of aldose reductase for treatment of chronic diabetic complications. J Med Chem. 2005;48:3141–3152. doi: 10.1021/jm0492094. [DOI] [PubMed] [Google Scholar]
- 24.Barski OA, Tipparaju SM, Bhatnagar A. The aldo-keto reductase superfamily and its role in drug metabolism and detoxification. Drug Metab Rev. 2008;40:553–624. doi: 10.1080/03602530802431439. [DOI] [PMC free article] [PubMed] [Google Scholar]
- 25.Burlingham BT, Widlanski TS. An intuitive look at the relationship of Ki and IC50: a more general use for the Dixon plot. J Chem Educ. 2003;80:214. [Google Scholar]
- 26.Cao D, Fan ST, Chung SS. Identification and characterization of a novel human aldose reductase-like gene. J Biol Chem. 1998;273:11429–11435. doi: 10.1074/jbc.273.19.11429. [DOI] [PubMed] [Google Scholar]
- 27.Sterling HJ, Batchelor JD, Wemmer DE, Williams ER. Effects of buffer loading for electrospray ionization mass spectrometry of a noncovalent protein complex that requires high concentrations of essential salts. J Am Soc Mass Spectrom. 2010;21:1045–1049. doi: 10.1016/j.jasms.2010.02.003. [DOI] [PMC free article] [PubMed] [Google Scholar]
- 28.Austin RP, Barton P, Davis AM, Fessey RE, Wenlock MC. The thermodynamics of the partitioning of ionizing molecules between aqueous buffers and phospholipid membranes. Pharm Res. 2005;22:1649–1657. doi: 10.1007/s11095-005-6336-7. [DOI] [PubMed] [Google Scholar]
- 29.Pierce MM, Raman CS, Nall BT. Isothermal titration calorimetry of protein–protein interactions. Methods. 1999;19:213–221. doi: 10.1006/meth.1999.0852. [DOI] [PubMed] [Google Scholar]
- 30.Lamour V, Barth P, Rogniaux H, Poterszman A, Howard E, Mitschler A, Van Dorsselaer A, Podjarny A, Moras D. Production of crystals of human aldose reductase with very high resolution diffraction. Acta Crystallogr D Biol Crystallogr. 1999;55(Part 3):721–723. doi: 10.1107/s0907444998013365. [DOI] [PubMed] [Google Scholar]
- 31.Petrash JM. All in the family: aldose reductase and closely related aldo-keto reductases. Cell Mol Life Sci. 2004;61:737–749. doi: 10.1007/s00018-003-3402-3. [DOI] [PMC free article] [PubMed] [Google Scholar]
- 32.Rondeau JM. Pig lens aldose reductase: a structural study. Strasbourg: Université Strasbourg; 1988. p. 241. [Google Scholar]
- 33.Murray C, Blundell T. Structural biology in fragment-based drug design. Curr Opin Struct Biol. 2010;20:497–507. doi: 10.1016/j.sbi.2010.04.003. [DOI] [PubMed] [Google Scholar]
- 34.Drinkwater N, Vu H, Lovell K, Criscione K, Collins B, Prisinzano T, Poulsen S, McLeish M, Grunewald G, Martin J. Fragment-based screening by X-ray crystallography, MS and isothermal titration calorimetry to identify PNMT (phenylethanolamine N-methyltransferase) inhibitors. Biochem J. 2010;431:51–61. doi: 10.1042/BJ20100651. [DOI] [PubMed] [Google Scholar]
- 35.Larsson A, Jansson A, Åberg A, Nordlund P. Efficiency of hit generation and structural characterization in fragment-based ligand discovery. Curr Opin Chem Biol. 2011;15:482–488. doi: 10.1016/j.cbpa.2011.06.008. [DOI] [PubMed] [Google Scholar]


