

Abstract
A critical step in improving our understanding of the development of amyotrophic lateral sclerosis (ALS) is to identify the factors contributing to the alterations in the excitability of motoneurons and assess their individual contributions. Here we investigated the early alterations in the passive electrical and morphological properties of neonatal spinal motoneurons that occur by 10 d after birth, long before disease onset. We identified some of the factors contributing to these alterations, and estimated their individual contributions. To achieve this goal, we undertook a computer simulation analysis using realistic morphologies of reconstructed wild-type (WT) and mutant superoxide dismutase-1 (mSOD1) motoneurons. Ion channel parameters of these models were then tuned to match the experimental data on electrical properties obtained from these same motoneurons. We found that the reduced excitability of mSOD1 models was accompanied with decreased specific membrane resistance by ∼25% and efficacy of synaptic inputs (slow and fast) by 12–22%. Linearity of summation of synaptic currents was similar to WT. We also assessed the contribution of the alteration in dendritic morphology alone to this decreased excitability and found that it reduced the input resistance by 10% and the efficacy of synaptic inputs by 7–15%. Our results were also confirmed in models with dendritic active conductances. Our simulations indicated that the alteration in passive electrical properties of mSOD1 models resulted from concurrent alterations in their morphology and membrane biophysical properties, and consequently altered the motoneuronal dendritic processing of synaptic inputs. These results clarify new aspects of spinal motoneurons malfunction in ALS.
Introduction
Action potentials generated by motoneurons are the functional output of the CNS that translates the motor command to muscle contraction. The level of action potential firing activity is influenced by the intrinsic properties of motoneurons, such as morphology, size, electrotonic properties, and active conductances, as well as by their synaptic inputs. In neurological disorders or injury of the nervous system, alterations occur in both synaptic inputs to motoneurons and in their intrinsic properties, which lead to disruption of the motor command and functional disability (Hochman and McCrea, 1994; Li and Bennett, 2003; Kitzman, 2005; Kuo et al., 2005; Harvey et al., 2006; Bories et al., 2007; Amendola and Durand, 2008; van Zundert et al., 2008). It is, therefore, crucial for the understanding of the development of neurological disorders to dissociate these factors and estimate their individual contributions to the alterations in motoneuronal properties.
The importance of morphological and electrical properties in neurological disorders is further supported by the remarkably early changes that occur in motoneurons of various mouse models of amyotrophic lateral sclerosis (ALS) (Kuo et al., 2004, 2005; Bories et al., 2007; Amendola and Durand, 2008; van Zundert et al., 2008). In the standard transgenic mouse model (G85R) of ALS, which has a mutated superoxide-dismutase-1 (mSOD1) gene, overt symptom onset occurs at 180 d or later (Bruijn et al., 1998), but before 10 d of age neonatal mSOD1 motoneurons have increases in the dendritic morphology coupled to a reduction in input resistance (Rin) and gain (Bories et al., 2007; Amendola and Durand, 2008). These alterations are specific to the large motoneurons (Bories et al., 2007; Amendola and Durand, 2008), which are in fact the first to degenerate (Pun et al., 2006; Hegedus et al., 2007).
Our goal was to determine whether the changes in morphology are sufficient to account for the changes in electrical properties or whether alterations in ionic channels are also involved. We also investigated whether dendritic processing of synaptic inputs is affected. We combined realistic computer models based on previously published three-dimensional (3D) reconstructions of wild-type (WT) and mSOD1 motoneurons with the electrophysiological recordings obtained experimentally from same motoneurons to optimize and constrain model parameters and match experimental data. We also developed a transformational algorithm that systematically altered the morphology of WT models to match mSOD1 morphologies, while maintaining the electrical properties of WT models, to estimate the contribution of morphology alteration to electrical properties of mSOD1 models.
Our results demonstrated that the changes in electrical passive properties of mSOD1 motoneurons resulted from alterations in both the dendritic morphology and membrane biophysical properties, and consequently reduced the efficacy of synaptic inputs. The alteration in morphology alone did not account fully for the changes in Rin as previously hypothesized (Bories et al., 2007), but contributed partially to the reductions in Rin and synaptic efficacy. Part of this work has been presented in abstract form (ElBasiouny and Heckman, 2008).
Materials and Methods
Motoneuron reconstruction and intracellular recordings
The data on the reconstructed morphologies of WT and mSOD1 motoneurons were obtained from the Amendola and Durand (2008) study, whereas the electrophysiological data obtained from these motoneurons were not previously published and exhibited similar reduction in Rin as observed in the Bories et al. (2007) study. Detail of the experimental procedures for intracellular motoneuron staining, and 3D reconstruction and quantification of morphologies are described previously (Amendola and Durand, 2008). Briefly, neonatal WT and transgenic mice (G85R) between postnatal day 8 (P8) and P10 were anesthetized and decerebrated at the postcollicular level. Dorsal craniotomy and laminectomy were performed to allow the removal of the brainstem and spinal cord to a recording chamber superfused with artificial CSF containing the following (in mm): 130 NaCl, 4 KCl, 1.2 MgCl2, 2 CaCl2, 1 NaH2PO4, 25 NaHCO3, 30 glucose, oxygenated with a 95% O2 and 5% CO2 mixture, adjusted to pH 7.4. Sharp microelectrodes (filled with 2 m potassium acetate with 2% Neurobiotin) were used to penetrate motoneurons in the ventral horn of the lumbar cord (L5 segment). Motoneurons were confirmed through their antidromic activation in response to electrical stimulation of the L5 ventral root. Measurements were obtained from 34 WT and 23 mSOD1 motoneurons (whole sample), in which membrane electrical properties (Rin; time constant, τ0; total cell capacitance, Ct; and resting membrane potential, Vrest) (Table 1, Fig. 1B, right) and firing activity (rheobase current, gain, and antidromic action potential and afterhyperpolarization properties) were recorded, followed by prolonged positive current injections for intracellular staining. The spinal cord was then fixed and cut transversely into slices of 75 μm. A number of motoneurons were labeled and reconstructed (WT: 8 cells and mSOD1: 6 cells) from serial sections using a microscope equipped with camera lucida attachment and computer-interfaced motorized stage and z-axis optical encoder with Neurolucida software. Shrinkage was corrected along the z-axis for the reconstructed morphologies. Metrical and topological parameters of reconstructed morphologies were computed using Neurolucida Explorer software (Fig. 1B, left).
Table 1.
Experimental data on electrical properties of mSOD1 motoneurons
| Property | WT | mSOD1 |
|---|---|---|
| Input resistance; Rin (MΩ) | 16.2 ± 4.78 (34) | 11.4 ± 2.96*** (23) |
| Resting potential; Vrest (mV) | −70.03 ± 7.16 (34) | −69.61 ± 6.16 (23) |
| Time constant; τ0 (ms) | 11.05 ± 2.64 (11) | 14.4 ± 6.25 (7) |
| Cell capacitance; Ct (pF) | 727 ± 253 (11) | 1404 ± 1055 (7) |
Experimental data were recorded from neonatal (P8–P10) WT and mSOD1 motoneurons in the whole-cord preparation (2 mm extracellular Ca2+ concentration). Data are expressed as mean ± SD.
***High statistical significance (p = 0.00002 for unpaired t test and 0.00006 for the Mann–Whitney U test). Values in parentheses indicate number of cells in each group. These data include those of the reconstructed motoneurons. Same data as in Figure 1B, right.
Figure 1.

Summary of the alteration in electrical and morphological properties of mSOD1 motoneurons. A, Reconstructed morphologies of exemplar WT and mSOD1 lumbar motoneurons (P8–P10) illustrating the differences between the two groups (top). WT and mSOD1 computer models retain the detailed morphometrical and topological characteristics of the reconstructed motoneurons (i.e., the variation in dendritic branch diameter is not illustrated in the bottom). B, Summary of experimental data illustrating the percentage change in electrical and morphological properties of mSOD1 lumbar motoneurons. Experimental data were normalized to the mean values of WT motoneurons to illustrate the percentage change in mSOD1 motoneuron properties relative to WT. Experimental data on morphological properties were obtained from Amendola and Durand (2008), whereas electrical properties data were obtained from whole sample recordings (Table 1). Number of stars indicates the level of statistical significance (*p < 0.05; **p < 0.01; ***p < 0.001). Error bars express SD.
Computer simulations
Computer simulations in the present study were run on two types of computational models to simulate mSOD1 motoneurons: reconstructed mSOD1 and mSOD1-like (morph) models. Models were developed and simulations were run on the NEURON simulation environment version 6.2.995 (Hines and Carnevale, 1997).
Simulations of reconstructed mSOD1 models
Reconstructed morphologies of real WT and mSOD1 motoneurons.
In this method, the 3D reconstructed morphologies of real WT (8 cells) and mSOD1 (6 cells) motoneurons previously published in the Amendola and Durand (2008) study were used in developing realistic models of those cells to study the factors underlying the alteration in their electrical properties (Fig. 1A). Model parameters were optimized and further constrained by experimental data obtained from same motoneurons. The dendritic morphologies of those cells have been previously quantified and mSOD1 motoneurons showed significant differences in their morphometrical and topological properties relative to WT (data from Amendola and Durand, 2008 are summarized in Fig. 1B, left, Table 2). In brief, mSOD1 motoneurons exhibited an increase in the dendritic membrane surface area and total dendritic path length by 58% and 65% relative to WT motoneurons, respectively. Similarly, the total numbers of dendritic terminal branches, dendritic branching nodes, and maximum dendritic branching order of mSOD1 motoneurons have been found increased by 89%, 97%, and 37%, respectively. On the other hand, the morphological properties of the soma, primary dendritic arborizations, and the longest dendritic path distance from the soma did not change between the two groups. In addition to the change in their morphology, some of the electrical properties of mSOD1 motoneurons were altered as well (experimental data on electrical properties are summarized in Fig. 1B, right, Table 1). For instance, Rin of mSOD1 motoneurons was decreased by 30%. This study is focusing on the relationship between the alterations in mSOD1 motoneuron passive properties and morphology, and the consequences of these alterations on the dendritic processing of synaptic inputs.
Table 2.
Summary of metrical parameters of mSOD1-like (morph) morphologies
| Property | Morphologies of mSOD1-like (morph) models |
Experimental dataa Mean (confidence interval) | |||||||
|---|---|---|---|---|---|---|---|---|---|
| MN 1 | MN 2 | MN 3 | MN 4 | MN 5 | MN 6 | MN 7 | MN 8 | ||
| Total dendritic path length | 170% | 196% | 165% | 158% | 163% | 146% | 158% | 154% | 165%** (133–197%) |
| Total dendritic membrane area | 186% | 252% | 172% | 149% | 177% | 145% | 177% | 169% | 158%* (125–191%) |
| Total branching points | 265% | 218% | 207% | 191% | 193% | 189% | 179% | 172% | 197%*** (165–229%) |
| Total terminations | 243% | 208% | 195% | 182% | 184% | 178% | 172% | 168% | 189%*** (160–219%) |
| Maximum branch order | 100% | 114% | 111% | 113% | 125% | 113% | 113% | 111% | 137%** (107–167%) |
| Longest dendritic path | 112% | 151% | 119% | 118% | 145% | 100% | 147% | 117% | 105% (88–122%) |
amSOD1 experimental data are presented as percentage of the mean value of the WT measurements. Experimental data are from Amendola and Durand (2008). The 95% confidence interval was computed as mean ± 1.96 × SD/,
*p < 0.05;
**p < 0.01;
***p < 0.001; ns, not statistically significant.
Matching electrical properties of WT and mSOD1 models to experimental data.
The biophysical parameters (the membrane-specific resistance, Rm; capacitance, Cm; and axial resistance, Ra) of reconstructed WT and mSOD1 models were optimized to match all passive properties (e.g., Rin, τ0, τ1, Ct, electrotonic length, L; and Vrest) experimentally recorded from same motoneurons. This was achieved by using the Multiple Run Fitter tool in NEURON software, which allowed for optimizing the model biophysical parameters to fit the multiple electrophysiological recordings.
All model passive properties, except the membrane time constants, were measured in the simulations in similar way to the experimental recordings obtained from mSOD1 motoneurons. Rin was measured by injecting somatic hyperpolarizing current pulses (−1 nA to +1 nA, 500 ms) and measuring the somatic voltage deflection from the resting membrane potential at the end of the current pulse (Fig. 2A). The membrane time constants (τ0 and τ1) were computed from the linear fit of the semilogarithmic voltage decay transients following brief hyperpolarizing somatic current pulses (0.5 ms), i.e., the graphical peeling method (Fig. 2B) (Rall, 1969). This method was favored over curve fitting the relaxing voltage traces with an exponential relationship, which was used to determine τo from the experimental recordings. The curve fitting method was found very sensitive to the location and time range over which the fitting was performed, and resulted in high variability in the values of estimated time constants. Furthermore, in some reconstructed motoneurons (one WT and two mSOD1 motoneurons) τ0 was difficult to determine from the experimental traces using the curve fitting method. Subsequently, Ct and L were computed from the values of Rin, τ0, and τ1 as follows:
 |
Figure 2.
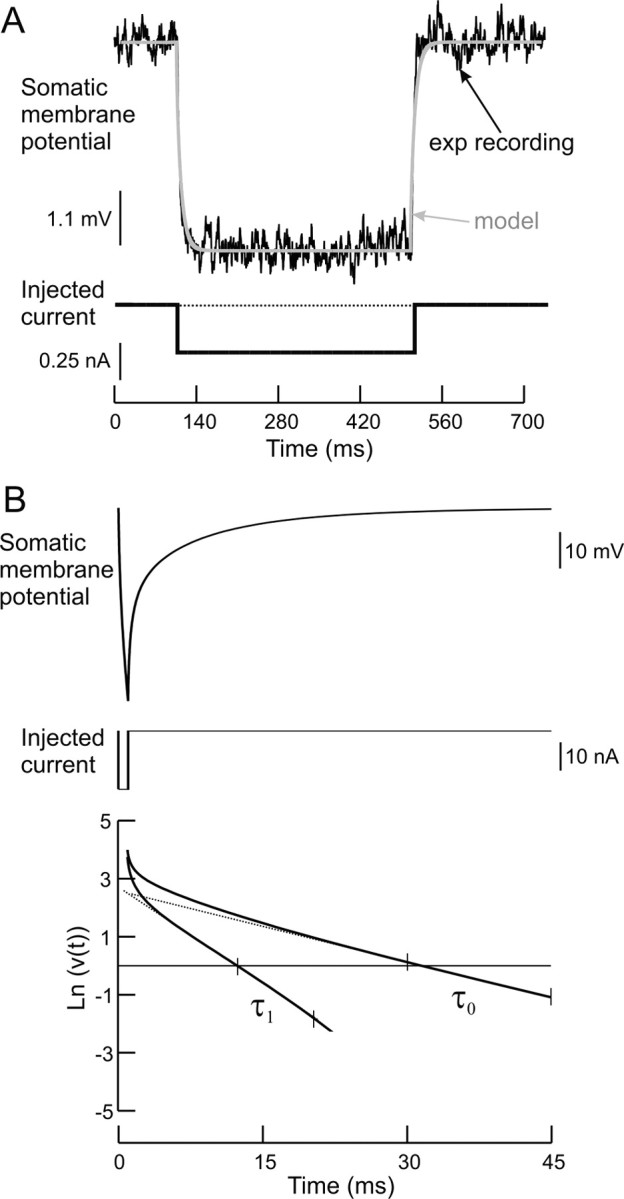
Measurements of Rin and time constants. A, Simulation of Rin measurement in which model behavior (gray trace) was matched to the experimental recording (black trace) of that individual motoneuron. B, Simulation of membrane time constants (τ0 and τ1) measurement using the graphical peeling method. The values of τ0 and τ1 are measured from the reciprocal of the slopes of the linear ranges indicated between the small ticks.
A complete and satisfactory match of model behavior to experimental data of that individual motoneuron was considered only when all model passive properties had values within the 95% confidence interval of experimental data on electrical properties.
Comparison of WT and mSOD1 motoneuron model parameters.
After matching model passive properties to experimental data of individual motoneurons, the parameters of WT and mSOD1 models were compared, and an unpaired Student's t test was used to check for statistically significant differences between the two groups. Given the small sample size, we also used the nonparametric Mann–Whitney U test (ProStat, version 5.01, Poly Software International) to check for statistical significance between WT and mSOD1 data. All reported significance levels are those of the Mann–Whitney U test, unless otherwise stated. This comparison of model parameters between the two groups allowed for the identification of any potential alteration in membrane biophysical properties that could underlie the change in passive properties of mSOD1 motoneurons.
Simulations of mSOD1-like (morph) models
Transformation of WT morphologies to mSOD1-like (morph).
Contrary to comparing the properties of reconstructed WT and mSOD1 models, this method alters the morphology of WT models, denoted “mSOD1-like (morph)”, to approximate the metrical and topological parameters of the mSOD1 motoneurons measured experimentally in Amendola and Durand (2008) (see Fig. 6A). By altering just the morphology of the WT model, this technique isolates the contribution of dendritic morphology to the altered electrical properties of mSOD1 motoneurons.
Figure 6.
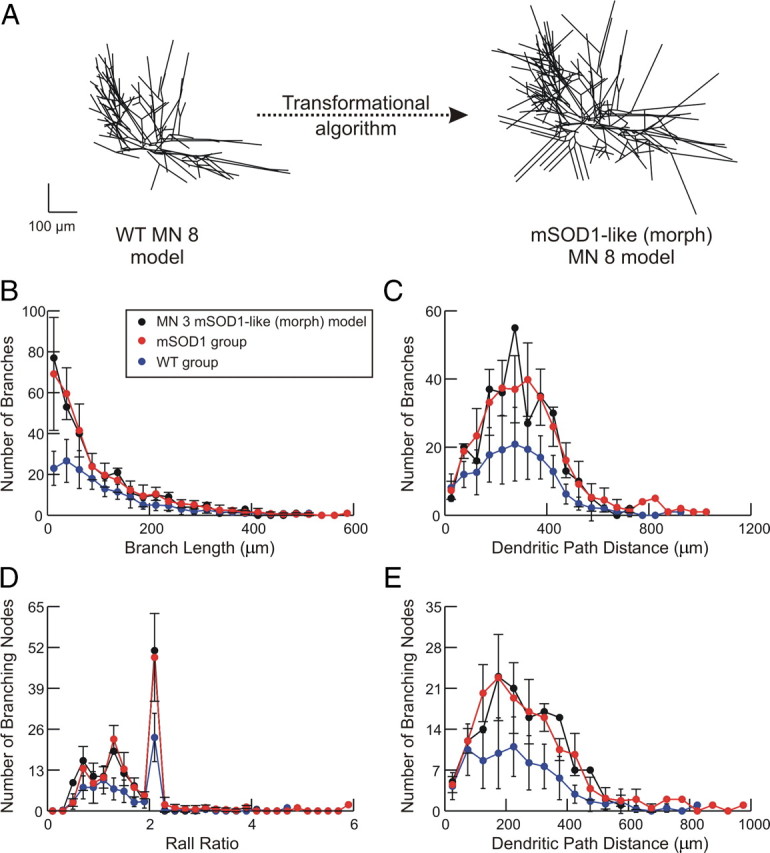
Transformation of WT to mSOD1-like models. A, Transformation of WT MN 3 model to its comparable mSOD1-like (morph) model. B–E, Morphometrical properties of mSOD1-like (morph) models. Data of reconstructed WT (blue traces) and mSOD1 (red traces) motoneurons are plotted versus that of the MN 3 mSOD1-like (morph) model (black traces). All error bars represent SD n = 8 for WT data and n = 6 for mSOD1 data.
In more detail, we measured various morphometrical and topological properties of WT and mSOD1 motoneurons and developed a transformational algorithm guided by those characteristic differences to append new dendritic nodes and branches to the dendrites of WT models. The morphological properties (size and dimension) of the soma and primary dendritic arborizations were not altered by the transformational algorithm as these structures did not exhibit morphological differences experimentally between WT and mSOD1 motoneurons (Amendola and Durand, 2008). Based on the dendritic path distance from the soma, the appropriate number of new dendritic nodes with two daughter branches was added to the WT model. The length and diameter of the new daughter branches matched the characteristic properties of mSOD1 motoneurons (i.e., attempting to approach the red traces of different properties in Fig. 6B–E, below). The diameters of the new daughter branches were always equal and were computed to satisfy a predetermined value of the 3/2 power rule (called Rall ratio). Rall ratio was computed as follows:
where dp, dc1, and dc2 are the parent branch, first and second daughter branch diameters, respectively.
To preserve the length of the longest dendritic branch similar between WT and mSOD1 motoneurons as seen experimentally (Fig. 1B, left), new dendritic branches were not permitted to be longer than the longest original dendritic path distance from the soma. This mechanism increased the total dendritic path length and membrane surface area to create the mSOD1-like (morph) model. The number of algorithm run cycles and the dendritic nodes appended during each cycle determined the number of dendritic terminals, the dendritic branching order, and the number of branch nodes appended to the original morphology. The morphometrical properties of the generated mSOD1-like (morph) model were targeted to have values within the 95% confidence interval of mSOD1 motoneurons experimental data. In that way, the transformational algorithm was used to develop various mSOD1-like (morph) models from the eight reconstructed morphologies of WT motoneurons. In some simulations, in which sensitivity analysis of model properties was conducted, the morphometrical properties of mSOD1-like (morph) models were intentionally examined outside the confidence interval (see models 1, 2, 5, and 7 in Table 2).
Matching passive properties of mSOD1-like (morph) models.
In a tuned WT model, the dendritic morphology was replaced by the mSOD1-like (morph) morphology, while other WT model parameters maintained unchanged (see Fig. 6A). First to assess the effect of the altered morphology on the model's electrical properties, the percentage change in model passive properties (Rin, τ0, τ1, Ct, L, and Vrest) was measured and then compared with experimental data on mSOD1 electrical properties (Table 3, second column). Second, when the percentage change in some or all passive properties of the mSOD1-like (morph) model did not match that seen experimentally in mSOD1 motoneurons, the membrane biophysical parameters (Rm, Cm, and Ra) were optimized until a percentage change in all model passive properties similar to that observed in mSOD1 motoneurons was achieved. This mSOD1-like (morph) model with optimized passive properties is called mSOD1-like (morph + Rm) (Table 3, third column). The optimization procedure has been performed on all mSOD1-like (morph) models and generated mSOD1-like (morph + Rm) models that were comparable to mSOD1 models in morphology and electrical properties. The membrane biophysical parameters of WT and mSOD1-like models were compared and a paired Student's t test was used to check for statistically significant differences between the two groups. The nonparametric Wilcoxon Sign Rank test (ProStat version 5.01, Poly Software International) was also used to check for statistical significance in the limited sample between WT and mSOD1-like (morph) or (morph + Rm) models. All reported significance levels are those of the Wilcoxon Sign Rank test, unless otherwise stated.
Table 3.
Properties of MN 3 mSOD1-like model compared to experimental data
| Property | No Ih current |
Ih current |
Experimental dataa Mean (confidence interval) | ||
|---|---|---|---|---|---|
| morph | morph + Rm | morph | morph + Rm | ||
| Rin | 92% | 66% | 85% | 68% | 70% (63–78%) |
| τ0 | 141% | 108% | 118% | 99% | 130% (88–172%) |
| τ1 | 126% | 124% | 93% | 111% | 117%b (84–149%) |
| Ct | 153% | 163% | 140% | 145% | 193% (86–301%) |
| L | 93% | 111% | 88% | 106% | 100%b (84–116%) |
| Vrest | 100% | 100% | 100% | 100% | 99% (96–103%) |
| Rm | 100% | 70% | 100% | 60% | n/a |
amSOD1 experimental data are presented as percentage of the mean value of the WT measurements. Experimental data of mSOD1 motoneuron electrical properties (Table 1, Fig. 1B, right). The second column (morph) illustrates the percentage change in model properties, relative to WT, when the dendritic morphology was altered and other model parameters were unchanged. The third column (morph + Rm) illustrates the percentage change in the same properties when reduction in Rm was incorporated with the altered morphology. No Ih current was included in these simulations. Fourth and fifth columns, same conditions as the second and third columns, but Ih current was included in the mSOD1-like (morph) and (morph + Rm) models. n/a, not applicable.
bData from Bories et al. (2007).
Models with spatially nonuniform distribution of Rm
In matching model properties to experimental data, we examined models with spatially uniform and nonuniform Rm. In spatially uniform models, the value of Rm was the same throughout the motoneuron. On the other hand, the value of Rm in spatially nonuniform models was low at the soma, but higher and constant over the entire dendrites. In general, models with spatially uniform Rm had lower values of τ0 than experimental data and it was difficult to match τ0 without perturbing the fit of Rin to experimental data. In contrast, varying the ratio between the somatic and dendritic Rm in spatially nonuniform models resulted in a satisfactory fit of both Rin and τ0 to experimental data. These observations are consistent with previous modeling work on morphologically detailed cat motoneurons in which only spatially nonuniform Rm models matched the multiple recordings of passive properties (Fleshman et al., 1988; Rose and Vanner, 1988; Clements and Redman, 1989). The low value of Rm at the soma relative to the dendrites is probably due to the leak current resulting from the penetration of the microelectrode tip at the motoneuronal somata, which will reduce the effective membrane resistance at the penetration site (Shelton, 1985; Fleshman et al., 1988; Rose and Vanner, 1988; Clements and Redman, 1989). Accordingly, we used models with spatially nonuniform Rm throughout our simulations.
The values of Cm and Ra parameters in all models were set to 1 μF/cm2 and 70 Ω · cm, respectively, based on previous published work in spinal motoneurons (Fleshman et al., 1988; Clements and Redman, 1989). For motoneurons whose τ0 was not measured experimentally (one WT and two mSOD1 motoneurons), we used comparable ratios of the somatic to dendritic Rm as in the other reconstructed cells to match experimental data of Rin and get τ0 values within the range of experimental data of the whole sample.
Dendritic synaptic inputs
To simulate the effect of synaptic inputs, excitatory synapses were distributed uniformly per unit area over the dendrites of all WT, mSOD1, and mSOD1-like (morph) models. To ensure full coverage of synapses to model morphologies, one synapse was placed in the middle of each compartment whose conductance was proportional to the area of that compartment. The total synaptic conductance and injected synaptic current were the same among all models. Consequently, the synaptic density (conductance per unit membrane area) varied between models according to the motoneuron surface area. Synapses were modeled as follows:
 |
where gsyn(t) is the time-varying synapse conductance described by an α function with time constant τsyn (0.2 ms), is the maximum conductance, and Esyn is the reversal potential of excitatory synapses (0 mV) (Rall, 1967; Segev et al., 1990).
Types of synaptic inputs and the efficacy of synaptic current
Two types of synaptic inputs were simulated in the present study: slow and fast inputs. Slow synaptic inputs were simulated by steady (15 s) and asynchronous activation of dendritic synapses (see Fig. 4A), whereas fast synaptic inputs were simulated by brief (2 ms) and synchronous activation of all dendritic synapses (see Fig. 4B). In the former, asynchronous activation of synapses was simulated by dividing the dendritic synapses randomly into four groups and activating each group at 180 Hz with a 25% phase shift (ElBasiouny et al., 2005). Overall, the strength of slow and fast inputs was comparable among all models and was adjusted such that the magnitude of effective synaptic current (IN) reaching the soma ranged between 0.8 to 1.5 times the rheobase current for each model when the somatic potential was voltage-clamped at −60 mV. In some simulations, a much stronger fast input was simulated in which IN ranged between 4 and 6 times the rheobase current for each model when the somatic potential was voltage-clamped at −45 mV (see Fig. 9B, last two bars).
Figure 4.

Simulations of efficacy and summation of synaptic inputs. A, The measurement of synaptic efficacy of slow synaptic inputs in a simulation of WT motoneuron. A steady synaptic input was applied (bottom) when the somatic membrane was ramped during voltage clamp from −70 mV to −10 mV at a slow rate of 4 mV/s. Both ΣIsyn and IN were measured simultaneously during the simulation of a passive and an active model. Assessment was done at subthreshold (−60 mV), suprathreshold (−45 mV), and peak potential (−30 mV). B, The measurement of synaptic efficacy of fast inputs in simulation of a WT motoneuron. Synaptic efficacy was computed as the ratio between the maximum amplitude of effective synaptic current (IN max) reaching the soma when the soma is clamped at −60 mV to the maximum amplitude of the total synaptic current injected through individual synapses (ΣIsyn max). The summation of synaptic current was assessed by measuring the ratio between ΣIsyn max and the total synaptic current injected through individual synapses if they would behave as perfect current sources (Iideal).
Figure 9.

Efficacy of slow (A) and fast (B) synaptic currents, and linearity index of slow (C) and fast (D) synaptic currents in active models. For WT, mSOD1-like (morph), and mSOD1-like (morph + Rm) models, n = 8. For mSOD1 models, n = 6. p-values were obtained from the nonparametric Wilcoxon Sign Rank test. *p < 0.05.
To assess the efficacy of synaptic current in reaching the soma, we computed the proportion of synaptic current that reached the soma to the total synaptic current injected through individual synapses when the somatic potential was voltage-clamped (see Fig. 4). Synaptic efficacy was assessed at various membrane potentials (−60 mV, −45 mV, and −30 mV) during voltage-clamp, and was computed in a similar way for slow and fast inputs as follows:
For slow inputs (see Fig. 4A):
 |
For fast inputs (see Fig. 4B):
 |
where IN (for slow inputs) or IN max (for fast inputs) is the effective synaptic current reaching the soma at the clamped potential (V), ΣIsyn (for slow inputs) or ΣIsyn max (for fast inputs) is the total current injected through individual synapses at the clamped potential (V).
Summation of synaptic currents
We also examined the effect of alteration in dendritic morphology on the summation of slow and fast synaptic currents in WT, mSOD1, and mSOD1-like (morph) models. Summation of synaptic currents is dependent on the dendritic distribution of synapses and the change in their driving potentials due to their relative locations on the dendrites (Rose and Cushing, 1999; Cushing et al., 2005). The synapses were distributed uniformly per unit area over the dendrites. Summation of synaptic currents was assessed when the somatic membrane potential was voltage-clamped at −60 mV, −45 mV, or −30 mV and measuring the ratio between two currents: 1) the total synaptic current injected through individual synapses (ΣIsyn) when the driving potential of synapses was determined by the local membrane potential at the site of synapse, and 2) the total synaptic current injected through same synapses when their driving potential was fixed to the clamped potential (Iideal), i.e., synapses were activated independently as constant current sources. The ratio between these currents was called the linearity index, which represents the percentage of the total synaptic current successfully injected through synapses despite the change in their driving potentials. The linearity index was assessed at various membrane potentials (−60 mV, −45 mV, and −30 mV) during voltage-clamp, and was computed for slow and fast inputs as follows:
For slow inputs (see Fig. 4A):
 |
For fast inputs (see Fig. 4B):
 |
Models with dendritic active conductances (active models)
To investigate the effect of dendritic active conductances on the efficacy and summation of synaptic inputs, we included L-type Ca2+ channels over the dendrites of WT, mSOD1, and mSOD1-like (morph) models and compared their behavior to the passive case. The parameters of dendritic L-type Ca2+ channels were based on those used by Carlin et al. (2000b) as follows:
where Ical is the Ca2+ current mediated through the Ca2+ channel, is the density of maximum dendritic conductance (0.00008 S/cm2), l is the activation gating particle, V is the membrane potential, and Ecal is the reversal potential of Ca2+ current (+60 mV). The kinetics of gating particle l was given by the following equations:
 |
where τl is the activation time constant (20 ms), dl/dt is the rate of change of l, and l∞ is the steady-state value of the activation particle l governed by the following relationship:
 |
where θl is the half-activation potential (−30 mV) and kl is the activation curve slope (−6 mV).
L-type Ca2+ channels were distributed uniformly starting from the third branching point in all WT, mSOD1, and mSOD1-like (morph) active models, in accordance with the experimental observations of Carlin et al. (2000b). The density of L-type Ca2+ channels was maintained the same among all models, which resulted in larger Ca2+ persistent inward current (PIC) in mSOD1 and mSOD1-like (morph) models than in WT models because of the increase in their dendritic surface area [leak-subtracted Ca2+ PIC magnitude: 0.55 ± 0.48 nA in WT, 0.93 ± 0.73 nA in mSOD1, and 1.2 ± 0.6 nA in mSOD1-like (morph) models]. These Ca2+ PIC amplitudes are within the experimental measurements obtained by Carlin et al. (2000b) from neonatal (P8-P15) mouse motoneurons in 2 mm extracellular Ca2+. Variability in Ca2+ PIC amplitude was substantial in mSOD1 active models due to the experimental variations among cells in the factors that determine the magnitude of the Ca2+ PIC (e.g., cell size and dendritic surface area available after the third branch point at which the L-type Ca2+ channels were placed). Comparison of WT to mSOD1-like (morph) or (morph + Rm) models eliminated this variability because within-cell comparison maintained these factors.
Simulations of Ih current
To examine whether Ih current had an effect on our simulations results, we incorporated Ih current in some WT and mSOD1-like (morph) models, and compared these simulations to those lacking the Ih current. The Ih current was based on the previous experimental and modeling work in spinal motoneurons (Takahashi, 1990; Manuel et al., 2007) and was represented by relationships similar to Equations 10–12 with reversal potential of −44 mV, activation time constant of 100 ms, half-activation potential of −95 mV, and activation curve slope of 13.5 mV.
When Ih current was included in WT or mSOD1-like (morph) models, it was placed at the soma and the entire dendrites. The dendritic conductance density was twice the somatic density as suggested by Manuel et al. (2007) to match the experimental data of sag ratio and quality factor of large lumbar motoneurons. To confirm that these conditions were met in our simulations, the sag ratio was measured in the WT and mSOD1-like (morph) models as illustrated in the inset of Figure 10 (see below), and was found equal to 1.45 as observed experimentally. In those simulations, Rin was measured at steady-state, i.e., during the sag.
Figure 10.

Simulations of mSOD1-like (morph) and (morph + Rm) models for MN 3 with Ih current included in the model. Rin was measured as the ratio of the change in somatic membrane potential (difference between the steady-state membrane potential and the resting membrane potential, Vss) to the amplitude of the current pulse. Note that the resting membrane potential was affected by Ih. When morphology increase was included in the mSOD1-like (morph) model, Rin was reduced by 15%. To further reduce Rin by nearly 30% similar to experimental data, Rm needed to be reduced in mSOD1-like (morph + Rm) model by 40%. The inset shows how the sag ratio was measured in the simulations.
Results
The anatomical data on the reconstructed morphologies of WT and mSOD1 motoneurons were taken from the Amendola and Durand (2008) study (8 WT and 6 mSOD1, Fig. 1B, left). The electrical properties were measured from 34 WT and 23 mSOD1 motoneurons that include the electrical properties of the reconstructed motoneurons (Table 1, Fig. 1B, right).
Reduced Rin in mSOD1 models is due to changes in dendritic morphology and Rm
In all models, a nonuniform distribution of Rm was required to match models to experimental data (see Materials and Methods). In each WT and mSOD1 model, the Multiple Run Fitter tool was used to vary the somatic and dendritic Rm to fit Rin and τ0 from experimental traces recorded from that motoneuron. The target of the Multiple Run Fitter was to achieve the best possible fit, indicated by the minimum error, to both the transient (the initial 50 ms) and steady-state (the last 100 ms) deflections in the somatic potential in response to injected current. In those tuning procedures, Vrest and initial values of somatic and dendritic Rm were set for each model and Rin, τ0, and τ1 were measured as shown in Figure 2, A and B, followed by estimation of Ct and L (see Materials and Methods). If all measured (Rin, τ0, and τ1) and estimated (Ct and L) model properties did not match experimental data of that motoneuron, both the somatic and dendritic Rm were varied to minimize the error between model properties and the experimental traces. This procedure was repeated until all model properties matched experimental data of that motoneuron. It is important to mention that experimental data were matched by a single set of model parameters in each cell (i.e., no redundancy in model parameters) because detailed motoneuron reconstructed morphologies were used in our simulations along with experimental data (Holmes and Rall, 1992a,b; Holmes et al., 1992; Rall et al., 1992).
The only statistically significant difference in electrical properties between WT and mSOD1 motoneurons was the 30% reduction in Rin (Fig. 1B, right). The models accurately reproduced this difference (Fig. 3). When the dendritic Rm was compared between WT and mSOD1 models, an average reduction of 28% was observed in the mSOD1 models (mean dendritic Rm for WT and mSOD1 models were 35,343 and 25,300 Ω · cm2, respectively). This reduction was statistically significant and was similar when the values of either the somatic or dendritic Rm were compared between the two model groups (p = 0.029 for somatic and dendritic Rm). Thus, the decrease in total input resistance, Rin, was not solely due to the increased dendritic branching but was also due to in part the decrease in specific membrane resistance (Rm). The relative roles of Rm and increased dendritic branching are considered below.
Figure 3.

Simulations of reconstructed WT and mSOD1 motoneuron models. Comparison of Rin measurements of WT and mSOD1 models to experimental recordings of reconstructed motoneurons. Statistical significance in Rin measurements between the WT and mSOD1 models was found similar to experimental data of those reconstructed motoneurons (p = 0.044). Error bars represent SD n = 8 for WT motoneurons and n = 6 for mSOD1 motoneurons.
Synaptic efficacy was reduced in mSOD1 models
The efficacy of synaptic currents depends in part on the dendritic morphology; thus, we hypothesized that the increase in dendritic morphology of mSOD1 motoneurons would reduce the efficacy of synaptic currents. To test this hypothesis, we assessed the efficacy of two types of synaptic inputs, slow and fast inputs, in mSOD1 passive models and compared them to WT (Fig. 4). Dendritic synapses were distributed uniformly per unit area in WT and mSOD1 models and synaptic efficacy was computed as the ratio between IN reaching the soma to the total synaptic current injected through individual synapses (see Materials and Methods). For slow inputs, the efficacy of synaptic current was assessed at −60 mV, a membrane potential 10 mV higher than the resting membrane potential, during ramp voltage-clamp of the somatic potential in WT and mSOD1 models (Fig. 4A, left vertical dotted line). The ΣIsyn trace decreases in magnitude as the membrane potential is increased during voltage-clamp because the driving potential of excitatory synapses decreases as well (Fig. 4A). The magnitude of IN current is lower than that of ΣIsyn due to the attenuation resulting from the passive properties (the axial and transmembrane resistances) of the dendritic membrane. The difference between ΣIsyn and IN currents increases as the membrane potential is increased during voltage-clamp because the leak current through the transmembrane resistance increases (its driving potential is increased). Our results confirmed our hypothesis and showed a statistically significant reduction in synaptic efficacy of slow inputs by 17% in mSOD1 models relative to WT (Fig. 5A, first black bar).
Figure 5.

Efficacy of synaptic currents (A) and linearity index (B) in passive models. In the mSOD1-like (morph) models, only morphology increase was included in the model, whereas in the mSOD1-like (morph + Rm) models morphology increase and Rm reduction were included. For WT, mSOD1-like (morph), and mSOD1-like (morph + Rm) models, n = 8. For mSOD1 models, n = 6. Even though paired Student's t test gave highly statistical p-values (p < 0.001) for comparisons between WT and mSOD1-like (morph), and mSOD1-like (morph + Rm) models, we only reported the p-values obtained from the nonparametric Wilcoxon Sign Rank test. *p < 0.05.
For fast inputs, the somatic membrane potential was also voltage-clamped at −60 mV (Fig. 4B). Similar to slow inputs, synaptic efficacy of fast inputs was reduced by 22% in mSOD1 models relative to WT (Fig. 5A, second black bar). This reduction in synaptic efficacy of slow and fast inputs is due to the increased dendritic branching in mSOD1 models resulting in higher attenuation of synaptic currents and the somatic and dendritic Rm reduction in those models. The effect of the latter would make the membrane leakier and allow more attenuation of the synaptic current as it flows from the dendrites to the soma. Fast inputs had lower synaptic efficacy than slow inputs (Fig. 5A, compare right and left bar sets) due to the low-pass filter properties of the dendritic membrane, which cause a frequency-dependent attenuation of synaptic signals (i.e., higher attenuation of fast signals than slow ones). In sum, synaptic efficacy of slow and fast inputs is reduced in mSOD1 motoneuron models.
Summation of synaptic currents is not changed in mSOD1 models
Summation of synaptic inputs is another property that depends on the dendritic morphology of motoneurons (i.e., linear summation is inversely proportional to the distance between adjacent dendritic synapses, Lev-Tov et al., 1983; Rose and Cushing, 1999; Cushing et al., 2005). Activation of adjacent synapses results in smaller mediated synaptic current than their linear sum (i.e., less-than linear summation) due to the reduction in driving potential of these synapses by membrane depolarization. Given that the morphology of mSOD1 motoneuron dendrites become larger relative to WT, we hypothesized that synaptic inputs would sum more linearly in mSOD1 motoneurons. To test this hypothesis, we assessed summation of synaptic inputs due to the change in driving potential in WT and mSOD1 passive models by measuring the linearity index at −60 mV for slow and fast inputs (see Materials and Methods). Dendritic synapses covered the entire dendrites and were distributed uniformly per unit area in these simulations. Accordingly, low linearity index values would be expected in morphologies dominated by long and/or thick dendritic branches (i.e., having large surface area) because of the existence of numerous synaptic contacts on their branches that would enhance the interactions between them and increase less-than linear summation. Conversely, high linearity index values would be expected in morphologies dominated by short and/or thin dendritic branches.
For slow synaptic inputs, the linearity index in mSOD1 models was not statistically different from WT (Fig. 5B, first black bar). On the other hand, the linearity index for fast synaptic inputs was increased in mSOD1 models at the subthreshold potential by 3% relative to WT models (Fig. 5B, second black bar). Although statistically significant (p = 0.039), this small increase in linear summation of fast inputs in mSOD1 models is probably not biologically significant. The linearity index of slow synaptic currents was in general lower than that for fast currents (Fig. 5B, compare the right and left bar sets), indicating less linear summation of slow inputs than fast ones. This decrease in linearity index of slow inputs is due to the asynchronous and prolonged activation of dendritic synapses, which resulted in maintained depolarization of the dendritic membrane; hence, higher reduction in the driving potentials of adjacent synapses.
Transformation of WT into mutant models required changes in dendritic morphology and Rm
In the foregoing studies, we compared two different sets of models, one for the WT dataset and one for the mSOD1 data set. This comparison does not allow quantification of the relative roles of membrane properties and morphology in generating the decrease in Rin. To quantify these roles, we developed an algorithm that allowed the transformation of each of the 8 modeled WT motoneurons into a typical mSOD1 model. The transformation was done in two stages. First, the dendritic morphology of WT models was transformed to replicate typical morphological experimental data for mSOD1 motoneurons to give a set of 8 mSOD1-like (morph) models, each with branching patterns that fell within the 95% confidence limits of experimental data for mutant SOD1 motoneurons (see Materials and Methods, Fig. 6A). Then, these 8 mSOD1-like (morph) models were further optimized by decreasing Rm in both soma and dendrites to allow full replication of the experimental data on Rin and other passive properties of mSOD1 motoneurons, giving a set of 8 mSOD1-like (morph + Rm) models. The accuracy of the dendritic morphology transformation is illustrated in Figure 6B–E, Table 2, which compares one of the 8 mSOD1-like (morph) models to the range of values for dendritic parameters for the experimental mSOD1 motoneurons. The morphometrical properties of the other seven mSOD1-like (morph) models were also similar to those of mSOD1 motoneurons, and fell within the 95% confidence interval of experimental data (Table 2).
Comparison of the WT, mSOD1-like (morph) and (morph + Rm) models confirmed the above results based on separate populations of modeled WT and modeled mSOD1 motoneurons. Figure 7 shows that changes in both morphology and specific membrane properties contributed to the 30% reduction in Rin, but that the reduction in the somatic and dendritic Rm had a larger role (single cell example in Fig. 7A and Table 3, averages for the 8 cells in Fig. 7B are 10% and 20% contributions of the morphology increase and Rm reduction to Rin decrease). The increase in morphology accounted for one third of the reduction in Rin, whereas the decrease in the somatic and dendritic Rm accounted for the other two thirds (Fig. 7B, see vertical arrows). All passive properties (Rin, Ct, τ0, τ1, and L) of the mSOD1-like (morph + Rm) model matched experimental data satisfactorily with those concurrent alterations in model dendritic morphology and somatic and dendritic Rm (Table 3, third column).
Figure 7.

Simulations of mSOD1-like (morph) models. A, Rin measurement in WT and mSOD1-like (morph) models. The mSOD1-like (morph) morphology merely resulted in 10% reduction in Rin; however, the experimentally observed reduction in Rin was obtained when Rm was simultaneously reduced by 30%. B, Summary of mSOD1-like (morph) and mSOD1-like (morph + Rm) simulation results. For each mSOD1-like (morph + Rm) model, Rin was reduced on average by 10% (second bar) due to morphology increase alone, and by 30% (third bar) when Rm was concurrently reduced in the model, which matched mSOD1 experimental data (fourth bar). Accordingly, the morphology increase contributed one third of the decrease in Rin, whereas Rm reduction contributed the other two thirds (see vertical arrows). Rm was reduced on average by 25% in mSOD1-like (morph + Rm) models to match Rin experimental data (last bar). n = 8 for WT, mSOD1-like (morph), and mSOD1-like (morph+ Rm) models. Error bars represent SD.
We also assessed the role of morphology alone to the changes in efficacy and summation of synaptic inputs within each cell as its dendritic morphology changes from the WT to mSOD1 shape. In general, the conclusion is the same as for Rin: changes in both morphology and somatic and dendritic Rm were required to reproduce the total reduction in efficacy of slow and fast synaptic inputs (Fig. 5A, compare black to gray and light gray bars). For integration of synaptic inputs, the small change in summation linearity (3–4%) became statistically significant in this within-cell analysis and was found to depend primarily on the increased number of short dendritic branches (light and dark gray bars in Fig. 5B are similar indicating that the change in summation linearity depends only on morphology increase, the increase in number of short dendritic branches in mSOD1 motoneurons is evident in Fig. 6B by comparing the red and black traces to the blue trace, see also Filipchuk et al., 2009).
In conclusion, the simulations of mSOD1-like (morph) and (morph + Rm) models confirmed our results from mSOD1 models and indicated that mSOD1 motoneurons experience: 1) alteration in their biophysical properties, 2) reduction in synaptic efficacy of slow and fast inputs, and 3) similar linear summation of slow and fast synaptic inputs.
mSOD1 models with active dendrites also exhibited lower synaptic efficacy
Thus far, we represented WT and mSOD1 motoneurons with passive dendrites (i.e., no dendritic active conductances were present) because neonatal mouse motoneurons do not have fully developed L-type Ca2+ currents at this age (Jiang et al., 1999) (see also Discussion). Nonetheless as dendritic voltage-sensitive channels develop they could compensate for the reduction in synaptic efficacy demonstrated above in passive dendrites. Therefore, we examined the effect of dendritic active conductances on the efficacy and summation of synaptic inputs by including L-type Ca2+ channels over the dendrites of WT, mSOD1, and mSOD1-like (morph) models, and compared their behaviors to the passive case. The L-type Ca2+ channels were distributed uniformly over the dendrites after the third branching point in all models based on the experimental observations of Carlin et al. (2000b) in neonatal mouse motoneurons. To examine the realism of Ca2+ channels dendritic distribution and their electrotonic placement from the soma in our simulations, we measured the dendritic Ca2+ PIC and plateau potential at the soma during voltage- and current-clamp conditions, and compared them to experimental data by Carlin et al. (2009) in neonatal mouse motoneurons. In voltage-clamp, the dendritic Ca2+ PIC in a mSOD1-like (morph) model exhibited staircase-like profile with variable onset times (Fig. 8A) indicating asymmetrical channel location relative to the soma (Carlin et al., 2009). In current-clamp, weak hyperpolarizing pulses in the same model caused partial deactivation of the plateau potential mediated by the Ca2+ PIC indicating proper spatial segregation between the dendritic channel locations (compare the black trace in our Fig. 8B to Fig. 1C,D in the work of Carlin et al., 2009). Strong hyperpolarizing pulses were able to terminate the plateau potential (Fig. 8B, blue trace). Similar behaviors were exhibited in WT and mSOD1 active models (data not illustrated). The accurate match of model behaviors to experimental data confirmed proper spatial arrangement and electrotonic separation of the dendritic Ca2+ channels in our simulations.
Figure 8.

Staircase currents and plateau potentials in active models. A, Generation of staircase currents (top) during voltage clamp of the somatic potential (bottom). The arrows denote the multiple steps during the activation of the Ca2+ PIC in a mSOD1-like (morph) model. B, Partial (black trace) and full (blue) deactivation of plateau potentials (top) by hyperpolarizing pulses (bottom) in the same mSOD1-like (morph) model as in A. In A and B, the model had dendritic L-type Ca2+ channels only, equivalent to the blockade of Na+ and K+ channels in the experiments of Carlin et al. (2009).
Given that synaptic current undergoes substantial amplification due to Ca2+ PIC activation as voltage-clamp holding potential is depolarized (Lee and Heckman, 2000), we assessed synaptic efficacy in the active models at multiple membrane potentials: at subthreshold (−60 mV) and suprathreshold (−45 mV) potentials, and at the Ca2+ PIC peak activation potential (−30 mV; named “peak potential” in Fig. 4A). Similar to the passive case, synaptic efficacy of slow and fast inputs at the subthreshold and suprathreshold potentials was reduced in active mSOD1-like (morph + Rm) models (Fig. 9A,B). This reduction occurred despite the increase in Ca2+ PIC magnitude in mSOD1-like (morph + Rm) active models than in mSOD1 active models (see Materials and Methods). The moderate Ca2+ PIC activation at these potentials could not compensate for the combined effects of somatic and dendritic Rm reduction and morphology increase (see Table 4 for individual contribution of these factors). For fast inputs, the comparable values of synaptic efficacy at the sub- and suprathreshold potentials and the passive case indicated that fast inputs did not activate the Ca2+ PIC because of their brief duration. This was confirmed because fast inputs of higher strength (4–6 times the rheobase current) at the suprathreshold potential exhibited similar value and reduction in synaptic efficacy to the passive condition (Fig. 9B, last bar). Because of the little Ca2+ PIC activation, the increase in morphology remained the main factor in reducing synaptic efficacy of fast inputs at all potentials (Table 4).
Table 4.
Individual contribution of various factors to synaptic efficacy in mSOD1-like (morph) and (morph + Rm) active models
| Slow inputs |
Fast inputs |
||||
|---|---|---|---|---|---|
| Subthreshold (−60 mV) | Suprathreshold (−45 mV) | Peak potential (−30 mV) | Subthreshold (−60 mV) | Suprathreshold (−45 mV) | |
| Total | −12% | −15% | No change | −15% | −17% |
| PIC | +5% | +22% | +126% | +1% | +2% |
| morph | −7% | −14% | −34% | −15% | −14% |
| Rm | −10% | −23% | −72% | −1% | −5% |
| PIC + morph | −2% | +8% | +92% | −14% | −12% |
We compared WT to mSOD1-like (morph) or (morph + Rm) models under different conditions to assess the individual contribution of various factors to synaptic efficacy at various potentials. All values indicate the percentage change relative to WT. The + sign indicates enhancement, whereas the − sign indicates reduction. Total synaptic efficacy was reported from the difference between WT and mSOD1-like (morph + Rm) models in Figure 9, A and B. The contribution of PIC activation alone was estimated from the difference between the active and passive conditions. The contribution of Rm reduction alone was estimated from the difference between mSOD1-like (morph + Rm) and (morph) models (difference between dark and light gray bars in Fig. 9A,B). The contribution of morphology increase alone was estimated from the difference between mSOD1-like (morph) and WT models in the passive case when it is not mixed with Ca2+ PIC activation (difference between light gray and white bars in Fig. 5A). The combined contribution of morphology and PIC was estimated from the difference between mSOD1-like (morph) and WT active models in Figure 9A,B.
At the peak potential, synaptic efficacy of slow inputs in mSOD1-like (morph + Rm) models was not statistically different from WT (Fig. 9A). The strong Ca2+ PIC activation at this potential masked the combined effects of somatic and dendritic Rm reduction and morphology increase, and maintained synaptic efficacy of slow inputs at a similar level to WT (see Table 4 for individual contributions of these factors). It is important to note that interspike potential recorded during firing of WT and mSOD1 motoneurons in the present study ranged between −54 mV to −35 mV in response to current injection of various levels (data not shown) indicating that the peak potential is not encountered during firing. Interestingly, synaptic efficacy of slow inputs at the peak potential was generally less than that at the sub- and suprathreshold potentials in all models due to the strong activation of leak current at that potential (compare the last four bars to the other bars in Fig. 9A). In conclusion, synaptic efficacy of slow and fast inputs is reduced in mSOD1 active models similar to the passive case despite the presence of dendritic active conductances, except at the peak potential.
Active models exhibited similar summation of synaptic currents to WT
Summation of synaptic currents in active models of WT, mSOD1 and mSOD1-like (morph) were generally similar to the passive case. The linearity index of both slow and fast inputs was either increased by a small amount (3–8%, statistically significant) or statistically not different from WT (Fig. 9C,D). For slow inputs, the linearity index was higher on average at the peak and suprathreshold potentials than at the subthreshold potential because of Ca2+ PIC activation. The linearity index of fast inputs was similar at the subthreshold and suprathreshold potentials because they did not activate the Ca2+ PIC as shown in the previous section. Noteworthy, the linearity index never exceeded unity in mSOD1 or mSOD1-like (morph) models for slow or fast inputs at any potential (i.e., no supralinear summation was achieved). In sum, summation of synaptic currents (slow or fast) in mSOD1 active models (at all potentials) is similar to WT despite the presence of dendritic active conductances.
Sensitivity analysis verified Rm reduction
We tested the robustness of our results by conducting sensitivity analysis on the morphometrical parameters of mSOD1-like (morph) and (morph + Rm) models. This process involved varying various morphometrical parameters both within and outside the 95% confidence interval of their experimental values. For instance, the total dendritic surface area, number of branching nodes and terminals, maximum branching order, and the longest dendritic path distance were varied individually or concurrently outside their confidence interval in some mSOD1-like (morph) models (models 1, 2, 5, and 7 in Table 2). On the other hand, the other mSOD1-like (morph) models had their morphometrical parameters varied within their confidence interval (models 3, 4, 6, and 8, Table 2). Under both conditions, our simulation demonstrated similar changes in the passive properties of mSOD1-like (morph + Rm) models. For instance, in mSOD1-like (morph + Rm) models 1, 2, 5, and 7 the decrease in somatic and dendritic Rm needed to match experimental data on Rin ranged between 23% and 34%, whereas it ranged between 20% and 30% for models 3, 4, 6, and 8. The contribution of morphology increase alone in mSOD1-like (morph) models 1, 2, 5, and 7 ranged between 9% and 10%, whereas in models 3, 4, 6, and 8 it ranged between 8% and 12%. Also, the percentage change in other passive properties (τ0, τ1, Ct, and L) of mSOD1-like (morph + Rm) models relative to WT were comparable under these conditions. In sum, our simulation results are valid across the whole range of experimental variations in the morphometrical parameters of mSOD1 motoneurons.
mSOD1 models with Ih current required Rm reduction to match experimental data and exhibited reduction in synaptic efficacy and small increase in linear summation
One could argue that our simulations replicated experimental data of mSOD1 passive properties (Rin, τ0, τ1, Ct, L, and Vrest), which are all sensitive to the activation of Ih current that has not been included in our simulations. Therefore, incorporating Ih currents in the model could change our simulations results and conclusions. Since sag was observed experimentally (Pambo-Pambo et al., 2009), we implemented Ih current in some WT and mSOD1-like (morph) models to verify our results (see Materials and Methods for detail). The WT models with Ih current were tuned to match experimental data of reconstructed motoneurons. That is, the density of Ih channels (somatic and dendritic conductances) and the model Rm (somatic and dendritic) were optimized so that the model had similar values of Rin, τ0, τ1, Ct, L, and Vrest to experimental data. The model Rin was measured at the end of current pulse during which Ih current was fully activated (Fig. 10, thick black trace). Also, the sag ratio was comparable to those reported in large lumbar motoneurons (sag ratio = 1.45, Manuel et al., 2007). When the dendritic morphology was altered from WT to mSOD1-like (morph) and other model parameters were maintained unchanged, Rin was reduced by only 15% and did not match experimental data (Table 3, fourth column, Fig. 10, gray trace). To further reduce Rin toward the mean of experimental data, the somatic and dendritic Rm were needed to be reduced in the mSOD1-like (morph + Rm) by 40% (Fig. 10, thin black trace). These concurrent alterations in the dendritic morphology and the somatic and dendritic Rm of the mSOD1-like (morph + Rm) resulted in satisfactory matches of all model properties to experimental data (Table 3, fifth column). Furthermore, when synaptic efficacy was measured in mSOD1-like (morph) passive models with Ih current included, a reduction of 15% relative to WT was obtained. The linearity index measured in mSOD1-like (morph) passive models with Ih current also showed an increase of 2% relative to WT. Taken collectively, these results confirmed those obtained from models not including the Ih current and demonstrated that our simulations are yet valid in the presence of the Ih current.
Discussion
The present study offers a quantitative analysis of the early alterations in morphology and electrical properties of mSOD1 motoneurons and illustrates the functional consequences of those alterations on the dendritic processing of synaptic inputs. Our results indicate that the aberrant alteration in morphology of mSOD1 motoneurons is probably accompanied by alterations in the membrane biophysical properties (i.e., reduction in Rm) leading to a decrease in synaptic efficacy of inputs at that early stage. Sensitivity analysis of various model parameters under different conditions confirmed our results.
Early abnormalities in spinal motoneurons have been reported in the embryonic and postnatal periods in mouse models of ALS (Raoul et al., 2002; Kieran et al., 2005; Bories et al., 2007; Amendola and Durand, 2008). The alterations in electrical and morphological properties of spinal motoneurons occur early in the G85R model and are specific to large motoneurons (Bories et al., 2007; Amendola and Durand, 2008). Early morphological abnormalities were observed in brainstem motoneurons (P6-P8) in which signs of dendritic remodeling were observed (van Zundert et al., 2008). In a longitudinal study, large motoneurons in the G85R and G93A (high and low expressor lines) models selectively exhibited upregulated endoplasmic reticulum stress markers from birth (Saxena et al., 2009), which may indicate that alterations in motoneuron biochemical and biophysical properties occur once the mutant protein is expressed. In spinal motoneurons, the dendritic morphology becomes larger and develops complex branching pattern (Amendola and Durand, 2008). The increase in morphology was hypothesized to account for the 30% reduction in Rin observed experimentally in mSOD1 motoneurons (Bories et al., 2007). Our results, however, indicate that the increase in morphology accounts for one third of the reduction in Rin (i.e., decreases Rin by 10%) and Rm reduction accounts for the other two thirds (i.e., decreases Rin by an additional 20%). The increase in morphology does not account fully for Rin reduction because the additional dendritic area is electrotonically remote from the soma, the site of Rin measurement. This electrotonic separation reduces the effect of the additional dendritic area at the soma. Our simulations also predict reduction in synaptic efficacy in mSOD1 motoneurons regardless of input type (slow or fast), dendritic conductances (active or passive), and cell firing activity (sub- or suprathreshold potentials). This prediction could be tested experimentally by measuring synaptic currents in WT and mSOD1 motoneurons at various holding potentials during voltage clamp. The reduction in synaptic efficacy results from the increase in dendritic branching, reduction in Rm, and activation of the dendritic PIC. Only at the Ca2+ PIC peak activation potential that synaptic efficacy in mSOD1 models was not reduced relative to WT; however, the membrane potential during firing rarely reaches this potential. Nevertheless, the peak potential simulations could predict the effect of neuromodulators (e.g., 5HT and norepinephrine; NE) on mSOD1 motoneurons. Neuromodulators hyperpolarize the activation of the PIC, hyperpolarize spike threshold (Fedirchuk and Dai, 2004), increase F-I gain, and depolarize the resting membrane potential and reduce input conductance (Hounsgaard et al., 1988; Berger et al., 1992; Elliott and Wallis, 1992; Larkman and Kelly, 1992; Hsiao et al., 1998; Lee and Heckman, 1999). These changes might offset some effects of the mutation but the increased motoneuronal excitability by neuromodulators would cause increased Ca2+ entry, which could lead to excitotoxicity. These are open questions that warrant further investigation.
The functional ramification of Rin and synaptic efficacy reductions is that mSOD1 motoneurons become harder to recruit making the muscles innervated by diseased motoneurons more difficult to activate during movement. This might explain the early deficits in grasping observed during the first postnatal week (Amendola et al., 2004). The reduction in motor unit activity could contribute to the later retraction of large diameter axons from the neuromuscular junction (Frey et al., 2000; Pun et al., 2006; Hegedus et al., 2007, 2008) and motoneuron degeneration (Bruijn et al., 1997, 1998; Williamson and Cleveland, 1999; Pun et al., 2006). Supportively, enforced activation of large motoneurons, through training exercise or functional overload, saved them and extended the life span of transgenic mice (Deforges et al., 2009; Gordon et al., 2010) indicating that avoiding reduction in activity of large motoneurons rescues them.
Experimentally, there is evidence that dendrites of neonatal mouse motoneurons (< P18) do not have fully developed L-type Ca2+ currents (Jiang et al., 1999; Carlin et al., 2000a). Accordingly, we simulated WT and mSOD1 motoneurons with active and passive dendrite models, and the results of efficacy and linear summation of synaptic inputs were similar in these models (except at the peak potential which is not usually encountered during cell firing). Also, we used similar density of L-type Ca2+ channels in WT and mSOD1 models, which resulted in higher Ca2+ PIC magnitude in mSOD1 models. The total PIC estimated from the firing activity of neonatal mSOD1 motoneurons in the G85R model was smaller relative to WT (Pambo-Pambo et al., 2009) indicating that the reduction in synaptic efficacy would be larger than that assessed from our active model simulations. Importantly, the dendritic Ca2+ PIC in our simulations exhibited a staircase-like profile in voltage-clamp and partial deactivation of plateau potential by weak hyperpolarizing pulses in current-clamp, similar to experimental data of Carlin et al. (2009) in neonatal mouse motoneurons. These behaviors support proper dendritic distribution of the Ca2+ channels in our models. The distribution of the Ca2+ channels after the third branching point and the realistic dendritic arborizations provided effectively the electrotonic asymmetry and spatial segregation conditions described by Carlin et al. (2009) for the dendritic channels location relative to soma to exhibit staircase current profile and partial deactivation of plateau potential.
We simulated synaptic inputs by uniform distribution of dendritic synapses that was similar in WT and mSOD1 models. In ALS, there is evidence for loss of specific types of synaptic inputs (Nagao et al., 1998) and interneurons (Stephens et al., 2006) indicating that locations and types of synapses onto mSOD1 motoneurons may vary relative to WT. However, the time course of these changes indicates that neuronal loss starts at symptom onset (Morrison et al., 1998) indicating that these changes in synaptic inputs were not present at the early age of our reconstructed motoneurons. Furthermore, PSPs in neonatal mSOD1 motoneurons evoked using dorsal root stimulation had similar characteristics (time-to-peak, half-width, and duration) supporting that synaptic inputs at this age were probably still similar between WT and mSOD1 motoneurons (Bories et al., 2007). Our results for the reduction in synaptic efficacy are in agreement with those obtained from neonatal mSOD1 motoneurons (<P10) in the subthreshold range in which PSP amplitudes were reduced by ∼17% relative to WT (Bories et al., 2007). This provides further support to the validity of synaptic input simulations in the present study. Our results of the small enhancement in linear summation of synaptic inputs in mSOD1 models are also in accordance with the modeling work in cat motoneurons (Rose and Cushing, 1999; Cushing et al., 2005) and when models with smaller Rin or larger surface area (and constant Rin) exhibited more linear summation of EPSPs (Lev-Tov et al., 1983). The present study predicted similar summation of synaptic inputs in mSOD1 motoneurons to WT regardless of the increase in their morphology. This prediction could be tested experimentally in a similar way to the experiments of Powers and Binder (2000) or Prather et al. (2001) on summation of synaptic inputs in cat motoneurons.
We used two types of computational models to simulate mSOD1 motoneurons: mSOD1 and mSOD1-like (morph) models. In the former, reconstructed morphologies of real WT and mSOD1 motoneurons were used and their electrical properties were compared. This technique has the advantages of exploiting realistic morphologies of WT and mSOD1 motoneurons and detecting global differences in electrical properties between the two groups. On the down side, this technique is incapable of identifying individual changes in model properties or estimating their contributions to the observed differences (because it compares two unrelated sets of cells, WT and mSOD1 motoneurons, making the comparison indirect). In the latter model type, the reconstructed morphologies of real WT motoneurons were converted to mSOD1-like (morph) ones whose morphometrical and topological properties are similar to real mSOD1 motoneurons. This technique has the advantages of detecting and tracing the changes in model properties within each cell (because mSOD1-like (morph) morphologies originate from WT cells) and assessing their contributions directly. Contrary to the first type, mSOD1-like (morph) models employ artificially transformed mSOD1 morphologies. The two techniques are complementary and overcome the limitations of the other. More importantly, our results from both model types were consistent and confirmed each other.
In conclusion, the excitability of mSOD1 motoneurons in the G85R mouse model is reduced relative to WT early in ALS. Computer simulations in the present study showed that changes in morphology and membrane biophysical properties contribute to this reduction in excitability, and cause reduction of synaptic efficacy. Cortical and brainstem motoneurons appear to exhibit morphological changes as well. Our results would help in understanding the functional ramifications of these morphological changes.
Footnotes
Funding for this work was provided by the Canadian Institutes of Health Research and the ALS Society of Canada to S.M.E. (Tim E. Noel fellowship) and the National Institutes of Health–National Institute of Neurological Disorders and Stroke Grant NS051462 to C.J.H. We thank Jenna Schuster and Drs. Marin Manuel and Katharina Quinlan for their comments and reading an early version of the manuscript.
References
- Amendola J, Durand J. Morphological differences between wild-type and transgenic superoxide dismutase 1 lumbar motoneurons in postnatal mice. J Comp Neurol. 2008;511:329–341. doi: 10.1002/cne.21818. [DOI] [PubMed] [Google Scholar]
- Amendola J, Verrier B, Roubertoux P, Durand J. Altered sensorimotor development in a transgenic mouse model of amyotrophic lateral sclerosis. Eur J Neurosci. 2004;20:2822–2826. doi: 10.1111/j.1460-9568.2004.03745.x. [DOI] [PubMed] [Google Scholar]
- Berger AJ, Bayliss DA, Viana F. Modulation of neonatal rat hypoglossal motoneuron excitability by serotonin. Neurosci Lett. 1992;143:164–168. doi: 10.1016/0304-3940(92)90257-8. [DOI] [PubMed] [Google Scholar]
- Bories C, Amendola J, Lamotte d'Incamps B, Durand J. Early electrophysiological abnormalities in lumbar motoneurons in a transgenic mouse model of amyotrophic lateral sclerosis. Eur J Neurosci. 2007;25:451–459. doi: 10.1111/j.1460-9568.2007.05306.x. [DOI] [PubMed] [Google Scholar]
- Bruijn LI, Becher MW, Lee MK, Anderson KL, Jenkins NA, Copeland NG, Sisodia SS, Rothstein JD, Borchelt DR, Price DL, Cleveland DW. ALS-linked SOD1 mutant G85R mediates damage to astrocytes and promotes rapidly progressive disease with SOD1-containing inclusions. Neuron. 1997;18:327–338. doi: 10.1016/s0896-6273(00)80272-x. [DOI] [PubMed] [Google Scholar]
- Bruijn LI, Houseweart MK, Kato S, Anderson KL, Anderson SD, Ohama E, Reaume AG, Scott RW, Cleveland DW. Aggregation and motor neuron toxicity of an ALS-linked SOD1 mutant independent from wild-type SOD1. Science. 1998;281:1851–1854. doi: 10.1126/science.281.5384.1851. [DOI] [PubMed] [Google Scholar]
- Carlin KP, Jiang Z, Brownstone RM. Characterization of calcium currents in functionally mature mouse spinal motoneurons. Eur J Neurosci. 2000a;12:1624–1634. doi: 10.1046/j.1460-9568.2000.00050.x. [DOI] [PubMed] [Google Scholar]
- Carlin KP, Jones KE, Jiang Z, Jordan LM, Brownstone RM. Dendritic L-type calcium currents in mouse spinal motoneurons: implications for bistability. Eur J Neurosci. 2000b;12:1635–1646. doi: 10.1046/j.1460-9568.2000.00055.x. [DOI] [PubMed] [Google Scholar]
- Carlin KP, Bui TV, Dai Y, Brownstone RM. Staircase currents in motoneurons: insight into the spatial arrangement of calcium channels in the dendritic tree. J Neurosci. 2009;29:5343–5353. doi: 10.1523/JNEUROSCI.5458-08.2009. [DOI] [PMC free article] [PubMed] [Google Scholar]
- Clements JD, Redman SJ. Cable properties of cat spinal motoneurones measured by combining voltage clamp, current clamp and intracellular staining. J Physiol. 1989;409:63–87. doi: 10.1113/jphysiol.1989.sp017485. [DOI] [PMC free article] [PubMed] [Google Scholar]
- Cushing S, Bui T, Rose PK. Effect of nonlinear summation of synaptic currents on the input-output properties of spinal motoneurons. J Neurophysiol. 2005;94:3465–3478. doi: 10.1152/jn.00439.2005. [DOI] [PubMed] [Google Scholar]
- Deforges S, Branchu J, Biondi O, Grondard C, Pariset C, Lécolle S, Lopes P, Vidal PP, Chanoine C, Charbonnier F. Motoneuron survival is promoted by specific exercise in a mouse model of amyotrophic lateral sclerosis. J Physiol. 2009;587:3561–3572. doi: 10.1113/jphysiol.2009.169748. [DOI] [PMC free article] [PubMed] [Google Scholar]
- ElBasiouny SM, Heckman CJ. 2008 Abstract Viewer/Itinerary Planner. Washington, DC: Society for Neuroscience; 2008. Upregulation of active conductances and persistent inward currents in mutant SOD1 motoneurons: insights from computer simulations. Online Program number: 445.19. [Google Scholar]
- ElBasiouny SM, Bennett DJ, Mushahwar VK. Simulation of dendritic Cav1.3 channels in cat lumbar motoneurons: spatial distribution. J Neurophysiol. 2005;94:3961–3974. doi: 10.1152/jn.00391.2005. [DOI] [PubMed] [Google Scholar]
- Elliott P, Wallis DI. Serotonin and l-norepinephrine as mediators of altered excitability in neonatal rat motoneurons studied in vitro. Neuroscience. 1992;47:533–544. doi: 10.1016/0306-4522(92)90163-v. [DOI] [PubMed] [Google Scholar]
- Fedirchuk B, Dai Y. Monoamines increase the excitability of spinal neurones in the neonatal rat by hyperpolarizing the threshold for action potential production. J Physiol. 2004;557:355–361. doi: 10.1113/jphysiol.2004.064022. [DOI] [PMC free article] [PubMed] [Google Scholar]
- Filipchuk AA, Durand J, Korogod SM. 2009 Abstract Viewer/Itinerary Planner. Washington, DC: Society for Neuroscience; 2009. Structural transformations caused by the superoxide dismutase 1 mutation in the mouse model of the human familial amyotrophic lateral sclerosis: developmental and electrotonic aspects. Online Program number: 146.20. [Google Scholar]
- Fleshman JW, Segev I, Burke RB. Electrotonic architecture of type-identified alpha-motoneurons in the cat spinal cord. J Neurophysiol. 1988;60:60–85. doi: 10.1152/jn.1988.60.1.60. [DOI] [PubMed] [Google Scholar]
- Frey D, Schneider C, Xu L, Borg J, Spooren W, Caroni P. Early and selective loss of neuromuscular synapse subtypes with low sprouting competence in motoneuron diseases. J Neurosci. 2000;20:2534–2542. doi: 10.1523/JNEUROSCI.20-07-02534.2000. [DOI] [PMC free article] [PubMed] [Google Scholar]
- Gordon T, Tyreman N, Li S, Putman CT, Hegedus J. Functional over-load saves motor units in the SOD1–G93A transgenic mouse model of amyotrophic lateral sclerosis. Neurobiol Dis. 2010;37:412–422. doi: 10.1016/j.nbd.2009.10.021. [DOI] [PubMed] [Google Scholar]
- Harvey PJ, Li Y, Li X, Bennett DJ. Persistent sodium currents and repetitive firing in motoneurons of the sacrocaudal spinal cord of adult rats. J Neurophysiol. 2006;96:1141–1157. doi: 10.1152/jn.00335.2005. [DOI] [PMC free article] [PubMed] [Google Scholar]
- Hegedus J, Putman CT, Gordon T. Time course of preferential motor unit loss in the SOD1G93A mouse model of amyotrophic lateral sclerosis. Neurobiol Dis. 2007;28:154–164. doi: 10.1016/j.nbd.2007.07.003. [DOI] [PubMed] [Google Scholar]
- Hegedus J, Putman CT, Tyreman N, Gordon T. Preferential motor unit loss in the SOD1 G93A transgenic mouse model of amyotrophic lateral sclerosis. J Physiol. 2008;586:3337–3351. doi: 10.1113/jphysiol.2007.149286. [DOI] [PMC free article] [PubMed] [Google Scholar]
- Hines ML, Carnevale NT. The NEURON simulation environment. Neural Comput. 1997;9:1179–1209. doi: 10.1162/neco.1997.9.6.1179. [DOI] [PubMed] [Google Scholar]
- Hochman S, McCrea DA. Effects of chronic spinalization on ankle extensor motoneurons. II. Motoneuron electrical properties. J Neurophysiol. 1994;71:1468–1479. doi: 10.1152/jn.1994.71.4.1468. [DOI] [PubMed] [Google Scholar]
- Holmes WR, Rall W. Electrotonic length estimates in neurons with dendritic tapering or somatic shunt. J Neurophysiol. 1992a;68:1421–1437. doi: 10.1152/jn.1992.68.4.1421. [DOI] [PubMed] [Google Scholar]
- Holmes WR, Rall W. Estimating the electrotonic structure of neurons with compartmental models. J Neurophysiol. 1992b;68:1438–1452. doi: 10.1152/jn.1992.68.4.1438. [DOI] [PubMed] [Google Scholar]
- Holmes WR, Segev I, Rall W. Interpretation of time constant and electrotonic length estimates in multicylinder or branched neuronal structures. J Neurophysiol. 1992;68:1401–1420. doi: 10.1152/jn.1992.68.4.1401. [DOI] [PubMed] [Google Scholar]
- Hounsgaard J, Hultborn H, Jespersen B, Kiehn O. Bistability of alpha-motoneurones in the decerebrate cat and in the acute spinal cat after intravenous 5-hydroxytryptophan. J Physiol. 1988;405:345–367. doi: 10.1113/jphysiol.1988.sp017336. [DOI] [PMC free article] [PubMed] [Google Scholar]
- Hsiao CF, Del Negro CA, Trueblood PR, Chandler SH. Ionic basis for serotonin-induced bistable membrane properties in guinea pig trigeminal motoneurons. J Neurophysiol. 1998;79:2847–2856. doi: 10.1152/jn.1998.79.6.2847. [DOI] [PubMed] [Google Scholar]
- Jiang Z, Rempel J, Li J, Sawchuk MA, Carlin KP, Brownstone RM. Development of L-type calcium channels and a nifedipine-sensitive motor activity in the postnatal mouse spinal cord. Eur J Neurosci. 1999;11:3481–3487. doi: 10.1046/j.1460-9568.1999.00765.x. [DOI] [PubMed] [Google Scholar]
- Kieran D, Hafezparast M, Bohnert S, Dick JR, Martin J, Schiavo G, Fisher EM, Greensmith L. A mutation in dynein rescues axonal transport defects and extends the life span of ALS mice. J Cell Biol. 2005;169:561–567. doi: 10.1083/jcb.200501085. [DOI] [PMC free article] [PubMed] [Google Scholar]
- Kitzman P. Alteration in axial motoneuronal morphology in the spinal cord injured spastic rat. Exp Neurol. 2005;192:100–108. doi: 10.1016/j.expneurol.2004.10.021. [DOI] [PubMed] [Google Scholar]
- Kuo JJ, Schonewille M, Siddique T, Schults AN, Fu R, Bär PR, Anelli R, Heckman CJ, Kroese AB. Hyperexcitability of cultured spinal motoneurons from presymptomatic ALS mice. J Neurophysiol. 2004;91:571–575. doi: 10.1152/jn.00665.2003. [DOI] [PubMed] [Google Scholar]
- Kuo JJ, Siddique T, Fu R, Heckman CJ. Increased persistent Na+ current and its effect on excitability in motoneurones cultured from mutant SOD1 mice. J Physiol. 2005;563:843–854. doi: 10.1113/jphysiol.2004.074138. [DOI] [PMC free article] [PubMed] [Google Scholar]
- Larkman PM, Kelly JS. Ionic mechanisms mediating 5-hydroxytryptamine- and noradrenaline-evoked depolarization of adult rat facial motoneurones. J Physiol. 1992;456:473–490. doi: 10.1113/jphysiol.1992.sp019347. [DOI] [PMC free article] [PubMed] [Google Scholar]
- Lee RH, Heckman CJ. Enhancement of bistability in spinal motoneurons in vivo by the noradrenergic alpha 1 agonist methoxamine. J Neurophysiol. 1999;81:2164–2174. doi: 10.1152/jn.1999.81.5.2164. [DOI] [PubMed] [Google Scholar]
- Lee RH, Heckman CJ. Adjustable amplification of synaptic input in the dendrites of spinal motoneurons in vivo. J Neurosci. 2000;20:6734–6740. doi: 10.1523/JNEUROSCI.20-17-06734.2000. [DOI] [PMC free article] [PubMed] [Google Scholar]
- Lev-Tov A, Miller JP, Burke RE, Rall W. Factors that control amplitude of EPSPs in dendritic neurons. J Neurophysiol. 1983;50:399–412. doi: 10.1152/jn.1983.50.2.399. [DOI] [PubMed] [Google Scholar]
- Li Y, Bennett DJ. Persistent sodium and calcium currents cause plateau potentials in motoneurons of chronic spinal rats. J Neurophysiol. 2003;90:857–869. doi: 10.1152/jn.00236.2003. [DOI] [PubMed] [Google Scholar]
- Manuel M, Meunier C, Donnet M, Zytnicki D. Resonant or not, two amplification modes of proprioceptive inputs by persistent inward currents in spinal motoneurons. J Neurosci. 2007;27:12977–12988. doi: 10.1523/JNEUROSCI.3299-07.2007. [DOI] [PMC free article] [PubMed] [Google Scholar]
- Morrison BM, Janssen WG, Gordon JW, Morrison JH. Time course of neuropathology in the spinal cord of G86R superoxide dismutase transgenic mice. J Comp Neurol. 1998;391:64–77. doi: 10.1002/(sici)1096-9861(19980202)391:1<64::aid-cne6>3.0.co;2-p. [DOI] [PubMed] [Google Scholar]
- Nagao M, Misawa H, Kato S, Hirai S. Loss of cholinergic synapses on the spinal motor neurons of amyotrophic lateral sclerosis. J Neuropathol Exp Neurol. 1998;57:329–333. doi: 10.1097/00005072-199804000-00004. [DOI] [PubMed] [Google Scholar]
- Pambo-Pambo A, Durand J, Gueritaud JP. Early excitability changes in lumbar motoneurons of transgenic SOD1G85R and SOD1G93A-Low mice. J Neurophysiol. 2009;102:3627–3642. doi: 10.1152/jn.00482.2009. [DOI] [PubMed] [Google Scholar]
- Powers RK, Binder MD. Summation of effective synaptic currents and firing rate modulation in cat spinal motoneurons. J Neurophysiol. 2000;83:483–500. doi: 10.1152/jn.2000.83.1.483. [DOI] [PubMed] [Google Scholar]
- Prather JF, Powers RK, Cope TC. Amplification and linear summation of synaptic effects on motoneuron firing rate. J Neurophysiol. 2001;85:43–53. doi: 10.1152/jn.2001.85.1.43. [DOI] [PubMed] [Google Scholar]
- Pun S, Santos AF, Saxena S, Xu L, Caroni P. Selective vulnerability and pruning of phasic motoneuron axons in motoneuron disease alleviated by CNTF. Nat Neurosci. 2006;9:408–419. doi: 10.1038/nn1653. [DOI] [PubMed] [Google Scholar]
- Rall W. Distinguishing theoretical synaptic potentials computed for different soma-dendritic distributions of synaptic input. J Neurophysiol. 1967;30:1138–1168. doi: 10.1152/jn.1967.30.5.1138. [DOI] [PubMed] [Google Scholar]
- Rall W. Time constants and electrotonic length of membrane cylinders and neurons. Biophys J. 1969;9:1483–1508. doi: 10.1016/S0006-3495(69)86467-2. [DOI] [PMC free article] [PubMed] [Google Scholar]
- Rall W, Burke RE, Holmes WR, Jack JJ, Redman SJ, Segev I. Matching dendritic neuron models to experimental data. Physiol Rev. 1992;72:S159–S186. doi: 10.1152/physrev.1992.72.suppl_4.S159. [DOI] [PubMed] [Google Scholar]
- Raoul C, Estévez AG, Nishimune H, Cleveland DW, deLapeyrière O, Henderson CE, Haase G, Pettmann B. Motoneuron death triggered by a specific pathway downstream of Fas: potentiation by ALS-linked SOD1 mutations. Neuron. 2002;35:1067–1083. doi: 10.1016/s0896-6273(02)00905-4. [DOI] [PubMed] [Google Scholar]
- Rose PK, Cushing S. Non-linear summation of synaptic currents on spinal motoneurons: lessons from simulations of the behaviour of anatomically realistic models. Prog Brain Res. 1999;123:99–107. doi: 10.1016/s0079-6123(08)62847-2. [DOI] [PubMed] [Google Scholar]
- Rose PK, Vanner SJ. Differences in somatic and dendritic specific membrane resistivity of spinal motoneurons: an electrophysiological study of neck and shoulder motoneurons in the cat. J Neurophysiol. 1988;60:149–166. doi: 10.1152/jn.1988.60.1.149. [DOI] [PubMed] [Google Scholar]
- Saxena S, Cabuy E, Caroni P. A role for motoneuron subtype-selective ER stress in disease manifestations of FALS mice. Nat Neurosci. 2009;12:627–636. doi: 10.1038/nn.2297. [DOI] [PubMed] [Google Scholar]
- Segev I, Fleshman JW, Jr, Burke RE. Computer simulation of group Ia EPSPs using morphologically realistic models of cat alpha-motoneurons. J Neurophysiol. 1990;64:648–660. doi: 10.1152/jn.1990.64.2.648. [DOI] [PubMed] [Google Scholar]
- Shelton DP. Membrane resistivity estimated for the Purkinje neuron by means of a passive computer model. Neuroscience. 1985;14:111–131. doi: 10.1016/0306-4522(85)90168-x. [DOI] [PubMed] [Google Scholar]
- Stephens B, Guiloff RJ, Navarrete R, Newman P, Nikhar N, Lewis P. Widespread loss of neuronal populations in the spinal ventral horn in sporadic motor neuron disease. A morphometric study. J Neurol Sci. 2006;244:41–58. doi: 10.1016/j.jns.2005.12.003. [DOI] [PubMed] [Google Scholar]
- Takahashi T. Inward rectification in neonatal rat spinal motoneurones. J Physiol. 1990;423:47–62. doi: 10.1113/jphysiol.1990.sp018010. [DOI] [PMC free article] [PubMed] [Google Scholar]
- van Zundert B, Peuscher MH, Hynynen M, Chen A, Neve RL, Brown RH, Jr, Constantine-Paton M, Bellingham MC. Neonatal neuronal circuitry shows hyperexcitable disturbance in a mouse model of the adult-onset neurodegenerative disease amyotrophic lateral sclerosis. J Neurosci. 2008;28:10864–10874. doi: 10.1523/JNEUROSCI.1340-08.2008. [DOI] [PMC free article] [PubMed] [Google Scholar]
- Williamson TL, Cleveland DW. Slowing of axonal transport is a very early event in the toxicity of ALS-linked SOD1 mutants to motor neurons. Nat Neurosci. 1999;2:50–56. doi: 10.1038/4553. [DOI] [PubMed] [Google Scholar]