Abstract
Developing yttria-stabilized tetragonal zirconia polycrystal (Y-TZP) with high strength and translucency could significantly widen the clinical indications of monolithic zirconia restorations. This study investigates the mechanical and optical properties of three Y-TZP ceramics: High-Translucency, High-Strength and High-Surface Area. The four-point bending strengths (mean ± standard error) for the three Y-TZP ceramics (n = 10) were 990 ± 39, 1416 ± 33 and 1076 ± 32 MPa for High-Translucency, High-Strength and High-Surface Area, respectively. The fracture toughness values (mean ± standard error) for the three zirconias (n = 10) were 3.24 ± 0.10, 3.63 ± 0.12 and 3.21 ± 0.14 MPa m1/2 for High-Translucency, High-Strength and High-Surface Area, respectively. Both strength and toughness values of High-Strength zirconia were significantly higher than High-Surface Area and High-Translucency zirconias. Translucency parameter values of High-Translucency zirconia were considerably higher than High-Strength and High-Surface Area zirconias. However, all three zirconias became essentially opaque when their thickness reached 1 mm or greater. Our findings suggest that there exists a delicate balance between mechanical and optical properties of the current commercial Y-TZP ceramics.
Keywords: Y-TZP, edge chipping, mechanical properties, optical properties, monolithic zirconia
1. Introduction
In recent years, ceramics restorative materials have attracted considerable interest in dental applications [1-4]. Zirconia-based all-ceramics restorations exhibit excellent mechanical properties, good biocompatibility, and potentially, superior aesthetics [5-8]. These properties ensure that zirconia-based restorations present clinical performance comparable to porcelain-fused-to-metal [9].
Unalloyed Zirconia assumes three crystallographic forms depending on the temperature: monoclinic, tetragonal and cubic phases [5]. Zirconia in tetragonal form offers the best mechanical properties among the three forms. To obtain stable tetragonal zirconia, many kinds of oxides such as CaO, MgO, Y2O3 or CeO2 were used to stabilize the tetragonal phase in zirconia at room temperature [5, 10]. The amount of stabilizer was controlled to determine the phase stability, transformability and mechanical properties [11]. 3 mol% yttria-stabilized tetragonal zirconia polycrystal (3Y-TZP) possesses superior mechanical properties due to its relatively fine grain size coupled with the tetragonal to monoclinic phase transformation. This leads to an increase in volume of 4 – 5% [10, 12], which causes closure of the crack tip, inhibiting crack propagation [11]. 3Y-TZP is currently widely used in the fabrication of dental crowns and fixed dental prostheses [5, 11].
Fracture toughness is one of the most important properties of brittle materials; it determines the resistance of a material to crack propagation. The conventional methods for measuring fracture toughness of ceramics, such as the single-edge V-notched beam (SEVNB) [13-15] and chevron notch beam methods [13], rely on the introduction of a sharp, through-thickness crack prior to quasi-static fracture testing [16]. These methods are highly sensitive to the radius of the notch crack tip, especially in fine-grained ceramics. As a result, most fracture toughness values of Y-TZP reported in the literature were grossly overestimated. It is necessary to explore novel test procedures to measure the critical fracture properties of Y-TZP ceramics.
The aesthetic appearance of Y-TZP-based restorations is achieved by veneering porcelains, as zirconia cores are essentially white and opaque [17]. However, the bilayer systems of veneered Y-TZP have several drawbacks, such as the multistep fabrication process, veneer chipping and delamination [6]. Monolithic Y-TZP restorations may offer remedy to these shortcomings [18-20]. The primary clinical deficiency of monolithic zirconia is the poor translucency. There have been considerable efforts to improve zirconia translucency via microstructural tailoring [21-24]. Only few studies have examined translucency of Y-TZP in relation to its mechanical properties [12, 25].
The stability of tetragonal zirconia has been a focal point for 3Y-TZP in biomechanical applications. External influences, such as applied stresses, moderate temperatures, and wet environments, are known to exacerbate the hydrothermal degradation of 3Y-TZP [5, 26, 27]. Various strategies, including utilizing ultra-fine starting zirconia powders with evenly distributed Y2O3 dopant and relatively low sintering temperatures to produce a fine-grained microstructure, have been employed to enhance the resistance to hydrothermal degradation of 3Y-TZP. In addition, heat-treatments, such as the porcelain veneering process, at temperatures greater than 900 °C can cause the monoclinic-to-tetragonal ‘reverse’ phase transformation [28, 29]. However, the effect of the veneer firing treatment on the mechanical properties of Y-TZP still remains elusive.
Accordingly, the objective of the current study was to elucidate the structure–function–property (microstructure–translucency–mechanical properties) relation of three commercial Y-TZP materials with distinctive properties: High-Translucency, High-Strength, and High-Surface Area (for resistance to hydrothermal degradation).
2. Materials and Methods
2.1 Specimens preparation
Pre-sintered tiles with dimensions of 76 × 60 × 16 mm were fabricated from three commercial Y-TZP powders: High-Translucency (Zpex), High-Strength (TZ-3YS-E) and High-Surface Area (TZ-3Y-E) (Tosoh Corporation, Tokyo, Japan). The properties of the three kinds of Y-TZP powders are shown in Table 1. Zirconia plates and bars were cut from these tiles using a low-speed diamond saw, and then ground with a silicon carbide abrasive paper (30 μm, Grit 600/P1200, CarbiMet, Buehler, IL, USA). The specimens were sintered in a box furnace (Lindberg/Blue M, Thermo Fisher Scientific Inc., MA, USA) according to the manufacturer's recommendations. The final sintering temperature was 1350 °C for High-Surface Area specimens, and 1450 °C for High-Translucency and High-Strength specimens. The heating rate was 8 °C/min and the holding time at the final sintering temperature was 2 h for all specimens. After sintering, the plate-shaped specimens, with their lateral surfaces ground and polished with 15, 9, 6, 3 and 1 μm diamond grits in sequence, were prepared for the evaluation of microstructure and determination of the optical and physical properties. The final dimension of these plates was 1.2 × 1.2 × (0.3, 0.5, 1.0, 1.5 and 2.0) mm. Bar specimens of 4 × 4 × 30 mm in dimension were prepared for edge chipping studies; the orthogonal surfaces of these bars were ground and polished down to a 3 μm diamond suspension finish. Bar specimens of 2 × 3 × 25 mm in dimension were prepared for the four-point bending strength measurement; the surfaces of these bars were ground with 15 μm diamond grits. For reference, lithium disilicate glass-ceramics (LiDi), IPS Empress, Alfa, Vision and VMK porcelain plates were polished to a 1 μm diamond suspension finish for the determination of optical properties.
Table 1.
The properties of the three kinds of Y-TZP powders.
| Samples | High-Translucency | High-Strength | High-Surface Area |
|---|---|---|---|
| Y2O3 (mol%) | 3 | 3 | 3 |
| Particle Size (nm) | 40 | 90 | 40 |
| Al2O3 (wt%) | ≤ 0.1 | 0.1 – 0.4 | 0.1 – 0.4 |
| Specific Surface Area (m2/g) | 13 ± 3 | 7 ± 2 | 16 ± 3 |
2.2 Simulated veneer firings
The effect of veneering process on the flexural strength of zirconia was also investigated. One group of High-Strength bars sintered at 1450 °C for 2 h was treated in a Programat CS furnace (Ivoclar Vivadent Inc.), using a firing schedule for veneering porcelain on zirconia core recommended by Vita Zahnfabrik (Bad Säckingen, Germany). Four firing cycles were applied, simulating the application of opaque porcelain, body porcelain, enamel porcelain, and glazing/staining. The maximum heat treatment temperatures for the 4 firing cycles were 950 °C, 910 °C, 900 °C, and 900 °C, respectively. The corresponding heating rates were 60 °C, 55 °C, 55 °C, and 80°C. The holding time at the maximum firing temperature was 1 min. The furnace door was opened immediately at the end of the firing cycle.
2.3 Microstructural analysis
After sintering and polishing, the Y-TZP plates were thermally etched at 1200 °C for 20 min with a heating rate of 30 °C/min to reveal the grain boundary networks. To prevent any significant grain growth during the thermal etching process, a relatively low heat treatment temperature (1200 °C) and fast heating rate (30 °C/min) were utilized. The morphologies of zirconia polycrystals were observed by scanning electron microscopy (SEM, S-3500N, HITACHI), operated at 20 kV. The average grain size of the three kinds of zirconia was determined using a linear intercept method (American Society for Testing and Materials E112) [30] and corrected by a shape factor 1.775 [31]. About 500 intercepts in each specimen were taken into account for the average grain size measurement.
2.4 X-ray diffraction analysis
The crystalline phases of the polished plates and ground bars were characterized by X-ray diffraction analysis (XRD) using a PANalytical X'Pert powder diffractometer operated at 45 kV and 40 mA, with a scan rate of 0.2°/min. The volume fraction of the monoclinic phase, Xm, was calculated according to the formula of Toraya et al. [32], in which the influence of yttria doping on the lattice parameters was corrected by factor 1.311. It was difficult to separate the tetragonal and cubic (111) peaks; the sum of the It(004) and It(220) tetragonal peaks and the Ic(400) cubic peak were used to estimate the proportions of these two phases by the formula of Mochales et al. [33].
2.5 Physical and mechanical characterization
The density of sintered zirconia plates was determined by Archimedes' principle, using the formula of Enoiu et al. [34].
Flexural strength of the bars was measured using a four-point bending fixture (20 mm outer span, 10 mm inner span) attached to a universal testing machine (Instron 5566, Norwood, MA). Load was applied at a rate of 1 mm/min. Flexural strength was calculated by the formula of Fischer et al. [35].
Hardness of Y-TZP plates was measured on polished surfaces (1 μm diamond grits) using a Vickers hardness tester at a peak load of 10 N with a holding time of 15 s.
Fracture toughness was measured by the edge chipping method. The edge chipping test was performed using a Vickers (136°) diamond indenter mounted in the crosshead of a universal testing machine (Instron 5566). Bar specimens were glued onto an X-Y table; load was applied on the specimen edge at a rate of 0.1 mm/min. For each specimen, at least 20 chips were made at various distances from the specimen edge. To assist positioning the Vickers indenter, a magnifier camera (USB 400× digital microscope) was attached to the indenter holder. Edge distance was defined as the center point of load application to the specimen edge and was measured from stereomicroscopy (Leica) images using Adobe Photoshop CS5. The maximum load to cause the fracture versus edge distance data were plotted and a power law trend was calculated by the following equation [36]:
| (1) |
where Kc is the ceramic toughness; PF is the critical load; β = 9.3 is a dimensionless constant; h is the edge distance.
In an edge chipping test using a Vickers indenter, median cracks initiate from the plastically deformed zone directly beneath the tip of the indenter and on the plans containing the diagonals of the indentation impression. Previous study on fine-grained Y-TZP and dental porcelains has revealed that, when the edge distance was relatively “large”, chipping fracture was not abrupt, rather the crack extended steadily downward with increasing load prior to instability [36, 37]. Thus, edge chipping can be considered a special case of stable extension of indentation induced median cracks, in which the stable fracture phase provides crucial information on the resistance to crack propagation (fracture toughness) of brittle materials [36].
2.6 Optical characterization
The transmittance of the three kinds of Y-TZP plates with different thicknesses was measured with an ultraviolet-visible spectrophotometer (Lambda 950 UV/VIS Spectrometer, PerkinElmer, Inc, MA, USA) in the wavelength range 350 – 800 nm.
The CIE L*, a* and b* parameters of the Y-TZP plates referring to the brightness, redness to greenness and yellowness to blueness coordinates were measured with a dental colorimeter (SpectroShade™ Micro, MHT Optic Research AG, Switzerland). The translucency parameter (TP) values of each specimen on black and white backgrounds were calculated [38].
2.7 Statistical analysis
The data of three kinds of zirconia groups were analyzed with the one-way analysis of variance (ANOVA) and multiple comparisons were performed using the Tukey test. The bending strength of High-Strength bars with and without the simulated veneer firing treatment was evaluated by the Student's t-test. A significance level of 5% was selected for all tests.
3. Results
3.1 Microstructural analysis
The SEM images of the three polished and thermally etched Y-TZP plates are shown in Figure 1. The grain boundaries in these specimens were clearly visible, and the grain size was not uniform. After sampling a large number of grains, it became apparent that the grain size of High-Surface Area zirconia was smaller than that of High-Strength and High-Translucency zirconias. The measured average grain sizes of High-Translucency, High-Strength and High-Surface Area were 0.67, 0.84 and 0.47 μm, respectively. Furthermore, it was found that many large grains (d > 1 μm) were well distributed in High-Strength specimens.
Figure 1.
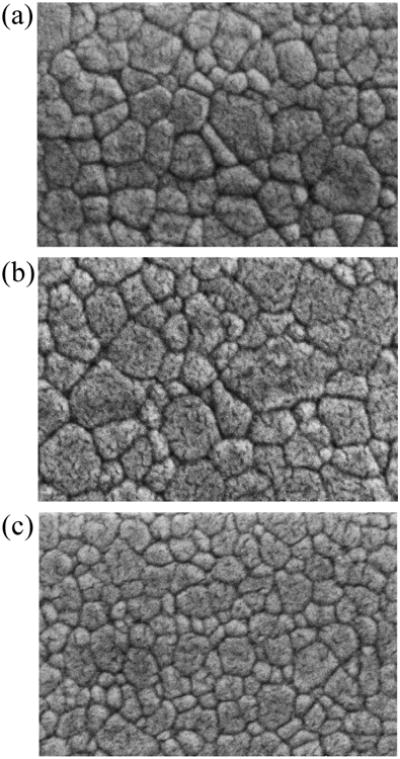
SEM images of three Y-TZP ceramics: (a) High-Translucency, (b) High-Strength, and (c) High-Surface Area.
3.2 X-ray diffraction analysis
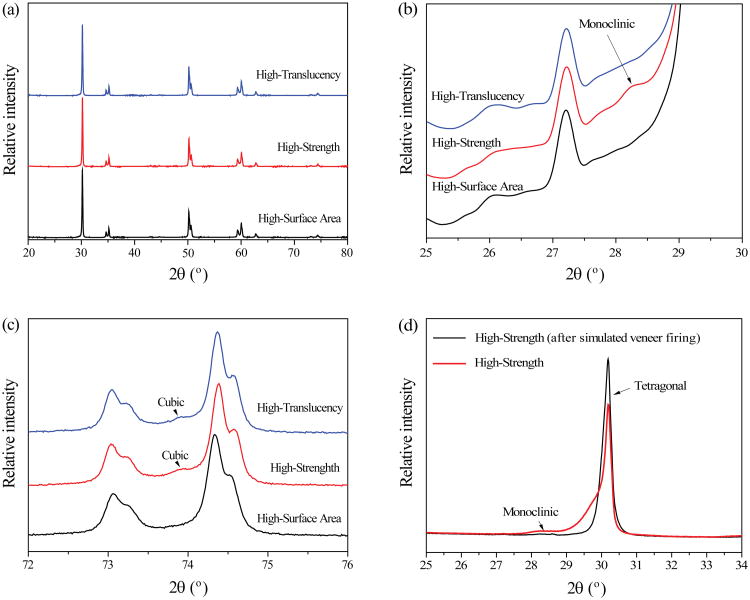
The XRD patterns of the three polished Y-TZP plates are shown in Figure 2a. Typical Y-TZP ceramic peaks were observed in the 2θ range from 20° to 80°. The main peak of the patterns was detected at about 30.2°, indicative of a predominant tetragonal phase of all three Y-TZP ceramics. The peaks ranging from 25° to 30° were very weak, and the XRD curves were smoothed to obtain a better resolution (Figure 2b). A trace of monoclinic phase was detected at about 28.2° only in High-Strength zirconia; the estimated volume fracture of the monoclinic phase was 0.02%. In Figure 2c, a weak diffraction peak was detected at about 73.9° in the High-Strength and High-Translucency zirconias. This is a characteristic peak of cubic zirconia; the estimated volume fractions of the cubic phase were 1.94% and 2.13% in High-Strength and High-Translucency zirconias, respectively.
Figure 2.
XRD patterns of three Y-TZP ceramics: High-Translucency, High-Strength and High-Surface Area. (a) Raw XRD spectral scans revealing major peaks of tetragonal, monoclinic, and cubic phases (20 to 80 degree). (b) XRD patterns in the region that consists of coexisting monoclinic and tetragonal phases (25 to 30 degree). Note: the curves were smoothed out to improve the resolution; (c) XRD patterns in the region that consists of coexisting cubic and tetragonal phases (72 to 76 degree). (d) XRD patterns of High-Strength bars fractured by the four-point bending test, with and without the simulated veneer firing treatment.
High-Strength bars with and without the simulated veneer firing treatment were fractured using the four-point bending test. Specimens from the broken half of the original bars were also subjected to XRD analysis. The volume fraction of the monoclinic phase in the fractured half-bars (15 μm grinding) was 1.47%, which was significantly higher than that (0.02%) in its high-polish (1 μm diamond suspension) counterpart. After a 4-cycle firing treatment, the reverse phase transformation from monoclinic to tetragonal occurred. It was found that the main peak of the tetragonal phase became stronger following the firing treatment, while the monoclinic peak almost disappeared (Figure 2d).
3.3 Density measurement
The density of the three kinds of Y-TZP ceramics is shown in Table 2. The green density of High-Translucency zirconia was the largest among the three kinds of Y-TZP ceramics, which was 25% and 27% higher than that of High-Strength and High-Surface Area zirconias, respectively (Materials data sheet, Tosoh Corporation). After sintering, the density of the three Y-TZP ceramics all increased. The density of High-Translucency zirconia was still the largest; it attained 99.84% of the theoretical density of zirconia. The measured density values were similar to that reported in the material data sheet from Tosoh Corporation.
Table 2.
The density and mechanical properties of the three kinds of Y-TZP ceramics.
| Samples | High-Translucency | High-Strength | High-Surface Area |
|---|---|---|---|
| Grain size (μm) | 0.67 ± 0.02 | 0.84 ± 0.03 | 0.47 ± 0.04 |
| Density (g/cm3) | 6.09 | 6.05 | 6.06 |
| Relative density | 99.84% | 99.18% | 99.34% |
| Density* (g/cm3) | 6.09 | 6.05 | 6.05 |
| Green density* (g/cm3) | 3.25 | 2.61 | 2.55 |
| Bending Strength (MPa) | 990 ± 39a | 1416 ± 33Ab | 1076 ± 32a |
| Bending Strength* (MPa) | 1100 | 1500 | 1000 |
| Bending Strength (MPa) (after simulated veneer firing) | – | 1412 ± 31A | – |
| Vickers Hardness (GPa) | 13.11 ± 0.03a | 12.88 ± 0.02b | 13.20 ± 0.04a |
| Fracture toughness (MPa m1/2) | 3.24 ± 0.10a | 3.63 ± 0.12b | 3.21 ± 0.14ab |
| Fracture toughness* (MPa m1/2) | 5 | 5 | 5 |
Capital letters refer to statistical groupings in the column, while lowercase letters denote to statistical groupings in a row. Different letters indicate statistical differences amongst the groups (p < 0.05).
Data from Tosoh Corporation, Tokyo, Japan. Bending Strength was measured by the three-point bending test; fracture toughness was measured by the single edge pre-cracked beam method.
3.4 Mechanical properties
The measured mechanical properties of the three kinds of Y-TZP ceramics were summarized in Table 2. High-Strength zirconia exhibited the best bending strength, which was 32% and 43% higher than that of High-Surface Area and High-Translucency zirconias, respectively (p < 0.001, n = 10). There was no significant difference in bending strength between High-Surface Area and High-Translucency zirconias (p = 0.208). Our bending strength test results were similar to the data provided by Tosoh Corporation.
One group of High-Strength bars was heat-treated by the same procedure used in the porcelain veneering process. After the firing treatment, the bending strength of High-Strength bars was 1412 ± 31 MPa, which was almost identical to that of their untreated counterparts, 1416 ± 33 MPa (p = 0.930, n = 10).
Vickers hardness of the three kinds of Y-TZP plates was also measured. The average hardness of High-Strength plates was the smallest among the three kinds of Y-TZP plates (p < 0.001, n = 10). There was no significant difference in hardness between High-Surface Area and High-Translucency zirconias (p = 0.053).
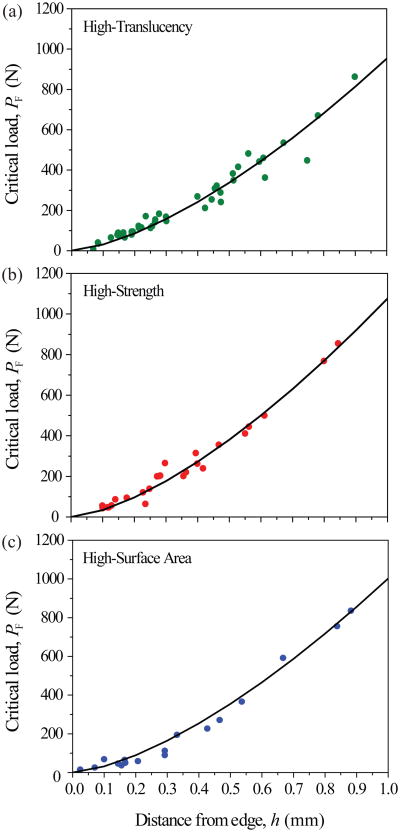
To determine the fracture toughness value of the three kinds of Y-TZP ceramics, edge chipping load versus distance from edge are plotted in Figure 3. Solid curves are the theoretical predictions of the PF – h relation for each material by Eq. 1, with the Kc value adjusted to fit each experimental data set. The predicted PF – h contours show good agreement with the experimental data points.
Figure 3.
Chipping load versus distance from edge for (a) High-Translucency, (b) High-Strength, and (c) High-Surface Area Y-TZP ceramics.
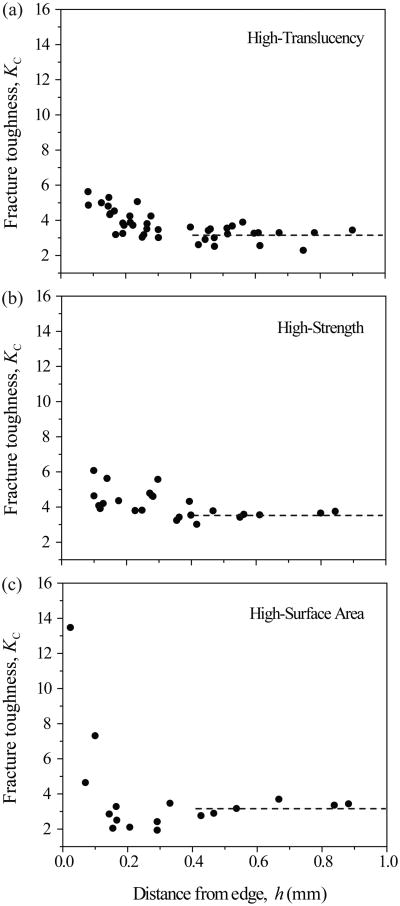
To validate our method, fracture toughness for each data point was calculated using Eq. 1 and plotted in Figure 4 as a function of the edge distance. It is apparent that Kc approached a constant value for h > 0.4 mm in all cases, suggesting that the critical edge distance for Y-TZP is h ≈ 0.4 mm. The measured edge chipping fracture toughness values, i.e. the mean and standard error of Kc values for h > 0.4 mm, are shown in Table 2. There was no significant difference in fracture toughness between High-Surface Area and the other two zirconias: High-Strength (p = 0.112) and High-Translucency (p = 0.988). However, statistical difference was observed between High-Strength and High-Translucency zirconias (p = 0.048). Compared with the fracture toughness data from Tosoh Corporation, our measured fracture toughness values of the three Y-TZP ceramics were much smaller.
Figure 4.
Edge-chipping toughness versus distance from edge for (a) High-Translucency, (b) High-Strength, and (c) High-Surface Area Y-TZP ceramics.
3.5 Transmittance measurement
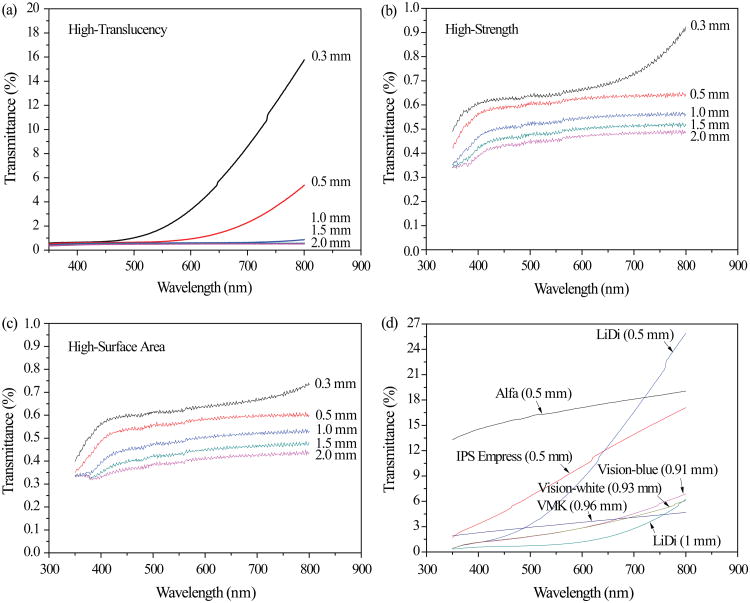
Transmittance curves of the three kinds of Y-TZP ceramics with different thicknesses (0.3, 0.5, 1.0, 1.5 and 2.0 mm) are shown in Figure 5. The transmittance increased with an increase in wavelength and decreased with an increase in plate thickness. It was found that the transmittance of the High-Strength and High-Surface Area zirconias was very low. At 550 nm wavelength, the transmittance values were 0.65% and 0.62% for High-Strength and High-Surface Area plates, respectively, at a small thickness of 0.3 mm; the transmittance value of the High-Translucency zirconia was higher, 1.83% at the thickness of 0.3 mm. However, the transmittance of all three kinds of zirconias diminished to below 0.60% at 550 nm wavelength when the thickness was above 1 mm. In Figure 5d, the transmittance of porcelain and glass-ceramic plates (LiDi, Alfa, Empress, Vision and VMK) was much higher than that of Y-TZP plates with similar thicknesses.
Figure 5.
The dependence of transmittance on wavelength and specimen thickness for (a) High-Translucency, (b) High-Strength, and (c) High-Surface Area Y-TZP ceramics relative to (d) porcelain and glass-ceramics. Note: different scales on the axis transmittance in (a) – (d).
The photographs of the three kinds of Y-TZP plates with different thicknesses (0.3, 0.5, 1.0, 1.5 and 2.0 mm) are shown in Figure 6. It can be seen that when the thickness of Y-TZP was 0.3 mm, the words were clearly visible; when the thickness increased to 0.5 mm, the words became vaguely visible. High-Translucency plates seemed more transparent than the other two zirconias when the thickness was below 0.5 mm. However, when the thickness was above 1.0 mm, the words were barely visible in all cases.
Figure 6.
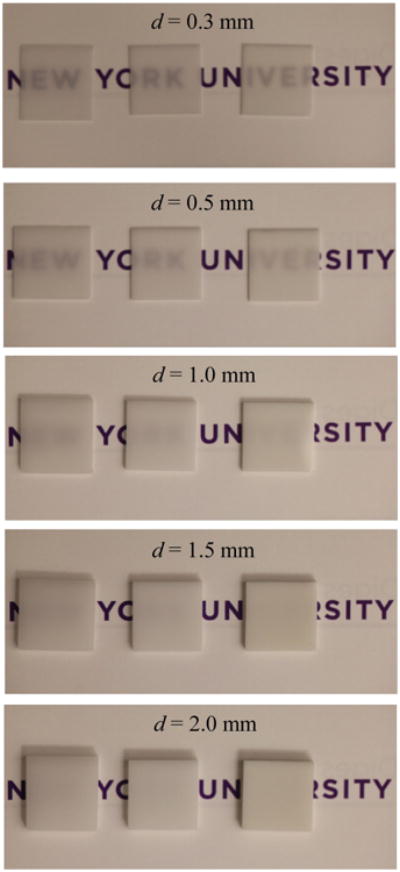
Digital photographs of three Y-TZP plates with different thicknesses, d. (From left to right: High-Translucency, High-Strength, and High-Surface Area).
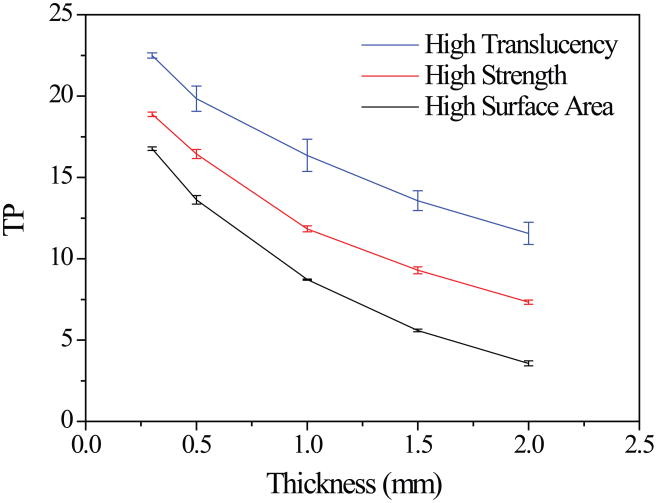
TP curves of the three kinds of Y-TZP ceramics with different thicknesses (0.3, 0.5, 1.0, 1.5 and 2.0 mm) are shown in Figure 7. The TP values of different kind of Y-TZP ceramics were in the range of 11.56-22.49 (High-Translucency), 7.33-18.88 (High-Strength) and 3.57-16.76 (High-Surface Area), and all increased with a decrease in plate thickness. For a given thickness, the High-Translucency Y-TZP plates had the highest TP values (p < 0.001, n = 3), whereas the High-Surface Area plates had the lowest TP values (p < 0.001, n = 3).
Figure 7.
TP values of three Y-TZP plates as a function of thickness.
4. Discussion
High-Strength zirconia exhibited superior flexural strength and fracture toughness relative to High-Surface Area and High-Translucency zirconias. The superior mechanical properties of High-Strength zirconia may be attributed to two reasons. Firstly, the tetragonal to monoclinic phase transformation occurred in coarse grains (d > 1 μm) during the sintering process. The average grain size of High-Strength zirconia was about 0.84 μm; many grains with a size above 1 μm were uniformly dispersed throughout the specimen. It has been reported that, beyond a critical grain size (∼ 1 μm), 3Y-TZP particles become less stable and more susceptible to spontaneous phase transformation [5]. Indeed, our XRD analysis revealed a weak but distinctive monoclinic peak in finely polished High-strength specimens. The local compressive stresses associated with the transformed coarse grains in High-Strength zirconia can result in increased flexural strength and fracture toughness. For High-Surface Area and High-Translucency specimens, most grains were well below 1 μm, which in turn lowered the transformation rate [39]. This is supported by the absence of monoclinic peaks in the XRD spectra of High-Surface Area and High-Translucency zirconias. Secondly, the relatively larger grains of High-Strength zirconia are more prone to stress-induced phase transformation during the crack propagation process [39]. The volume expansion associated with the tetragonal to monoclinic phase transformation creates compressive stresses behind the crack tip, thereby closing the tip and improving the flexural strength and fracture toughness of High-Strength zirconia.
In order to elucidate the effect of the veneer firing process on the flexural strength of zirconia restorative materials, the resistance of the High-Strength zirconia bars to multiple rapid heating and cooling treatments was also investigated. It was found that the flexural strength value of High-Strength zirconia was not affected by the rapid heating and cooling cycles. XRD patterns showed that the firing process induced reverse phase transformation from monoclinic to tetragonal. These results indicated that the mechanical properties were not affected by limited phase transformation on the surface of zirconia bars induced by 15 μm grinding. This further indicated that phase transformation during the crack growth process is the main reason for the superior flexural strength and fracture toughness of the High-Strength zirconia.
Determination of fracture toughness using the edge-chipping method warrants further discussion. The proper way is to measure the chipping load over a wide range of edge distances. The edge-chipping fracture toughness value for each data point can then be calculated using Eq. 1, and plotted as a function of edge distance. Two edge distance regimes become apparent. At a “large” h, Kc approaches a constant value―this value represents the fracture toughness of a brittle solid. At a “small” h, Kc tends to increase with the diminishing h, suggesting that chip fracture occurs immediately after the onset of median cracks without a stable crack propagation phase. Thus, the edge-toughness obtained in the small h regime is often greater than the fracture toughness of ceramics.
The edge-chipping method is particularly suited for measuring the fracture toughness of ceramics with high modulus and high hardness (e.g. alumina and zirconia). The notion of minimum edge distance is firmly based on the elastic-plastic theory of indentation. At a sufficiently large edge distance h, the volume of the indentation impression and its associated plastic zone become relatively small compared with the crack dimensions [36, 37, 40]. In other words, the indentation energy needed to create the volume of the indentation impression and in plastic work is small relative to that for crack propagation [40]. The key for accurately evaluating the fracture toughness is to ensure that the edge chipping event is dominated by the fracture phenomenon rather than the deformation process [41, 42].
Optical properties of the three kinds of Y-TZP plates were also studied. When the thickness of the plates was small (0.3 and 0.5 mm), the transmittance of High-Translucency plates was much higher than that of High-Strength and High-Surface Area plates. It is because the density of High-Translucency specimens was higher than that of the High-Strength and High-Surface Area specimens. Porosity is one of the main factors that influences the transparency of a ceramic [43]. The difference in refractive indices between zirconia and pores is relatively large, which increases the light scattering [44, 45]. Translucency can be improved by increasing the density of the specimens. However, for any kinds of zirconia plates with a thickness larger than 1.0 mm, the transmittance was quite low, below 0.6% at 550 nm wavelength. This is because (1) the grain sizes of these 3Y-TZPs are relatively large, resulting in light scattering at the grain boundaries owing to the large birefringence of tetragonal zirconia crystals [21, 22]; and (2) all the zirconia specimens contain a small amount of Al2O3 additives, which act as light scattering centers [23].
Among the three ceramics, High-Translucency Y-TZP comes closest to the requirements for monolithic dental crowns. However, in order to further improve the translucency of zirconia, it is necessary to increase the density, reduce the grain size and pore size to the nanometric range, and eliminate alumina additives [43, 46].
5. Conclusions
High-strength Y-TZP exhibited the best mechanical properties.
High-translucency Y-TZP possessed the best translucency properties, but the worst mechanical properties.
Among the three kinds of Y-TZP ceramics, High-translucency Y-TZP could be the best candidate for monolithic dental restorations.
To achieve aesthetic excellence, further development of zirconia restorative materials with both desirable translucency and superior mechanical properties is needed.
Acknowledgments
This investigation was sponsored by funding from the United States National Institute of Dental & Craniofacial Research, National Institutes of Health (Grant 2R01 DE017925, P.I. Y. Zhang).
Footnotes
Conflict of Interest: All authors declare no conflict of interest.
Publisher's Disclaimer: This is a PDF file of an unedited manuscript that has been accepted for publication. As a service to our customers we are providing this early version of the manuscript. The manuscript will undergo copyediting, typesetting, and review of the resulting proof before it is published in its final citable form. Please note that during the production process errors may be discovered which could affect the content, and all legal disclaimers that apply to the journal pertain.
References
- 1.Zhang Y, Sailer I, Lawn BR. Fatigue of dental ceramics. J Dent. 2013;41:1135–1147. doi: 10.1016/j.jdent.2013.10.007. [DOI] [PMC free article] [PubMed] [Google Scholar]
- 2.Kelly JR. Dental ceramics: current thinking and trends. Dental Clinics of North America. 2004;48:513–530. doi: 10.1016/j.cden.2004.01.003. [DOI] [PubMed] [Google Scholar]
- 3.Rekow D, Thompson VP. Engineering long term clinical success of advanced ceramic prostheses. J Mater Sci Mater Med. 2007;18:47–56. doi: 10.1007/s10856-006-0661-1. [DOI] [PubMed] [Google Scholar]
- 4.Giordano R, McLaren EA. Ceramics overview: classification by microstructure and processing methods. Compend Contin Educ Dent. 2010;31:682–684. 686, 688 passim; quiz 698, 700. [PubMed] [Google Scholar]
- 5.Denry I, Kelly JR. State of the art of zirconia for dental applications. Dent Mater. 2008;24:299–307. doi: 10.1016/j.dental.2007.05.007. [DOI] [PubMed] [Google Scholar]
- 6.Zhang Y, Lee JJ, Srikanth R, Lawn BR. Edge chipping and flexural resistance of monolithic ceramics. Dent Mater. 2013;29:1201–1208. doi: 10.1016/j.dental.2013.09.004. [DOI] [PMC free article] [PubMed] [Google Scholar]
- 7.Kim B, Zhang Y, Pines M, Thompson VP. Fracture of porcelain-veneered structures in fatigue. J Dent Res. 2007;86:142–146. doi: 10.1177/154405910708600207. [DOI] [PubMed] [Google Scholar]
- 8.Lawn BR, Bhowmick S, Bush MB, Qasim T, Rekow ED, Zhang Y. Failure modes in ceramic-based layer structures: a basis for materials design of dental crowns. J Am Ceram Soc. 2007;90:1671–1683. [Google Scholar]
- 9.Larsson C, Wennerberg A. The Clinical Success of Zirconia-Based Crowns: A Systematic Review. International Journal of Prosthodontics. 2014;27:33–43. doi: 10.11607/ijp.3647. [DOI] [PubMed] [Google Scholar]
- 10.Stawarczyk B, Ozcan M, Hallmann L, Ender A, Mehl A, Hammerlet CH. The effect of zirconia sintering temperature on flexural strength, grain size, and contrast ratio. Clin Oral Investig. 2013;17:269–274. doi: 10.1007/s00784-012-0692-6. [DOI] [PubMed] [Google Scholar]
- 11.Shah K, Holloway JA, Denry IL. Effect of coloring with various metal oxides on the microstructure, color, and flexural strength of 3Y-TZP. J Biomed Mater Res B Appl Biomater. 2008;87:329–337. doi: 10.1002/jbm.b.31107. [DOI] [PubMed] [Google Scholar]
- 12.Chen YM, Smales RJ, Yip KH, Sung WJ. Translucency and biaxial flexural strength of four ceramic core materials. Dent Mater. 2008;24:1506–1511. doi: 10.1016/j.dental.2008.03.010. [DOI] [PubMed] [Google Scholar]
- 13.Gogotsi GA. Fracture toughness of ceramics and ceramic composites. Ceramics International. 2003;29 [Google Scholar]
- 14.Triwatana P, Srinuan P, Suputtamongkol K. Comparison of two fracture toughness testing methods using a glass-infiltrated and a zirconia dental ceramic. J Adv Prosthodont. 2013;5:36–43. doi: 10.4047/jap.2013.5.1.36. [DOI] [PMC free article] [PubMed] [Google Scholar]
- 15.Fischer H, Waindich A, Telle R. Influence of preparation of ceramic SEVNB specimens on fracture toughness testing results. Dent Mater. 2008;24:618–622. doi: 10.1016/j.dental.2007.06.021. [DOI] [PubMed] [Google Scholar]
- 16.Gogotsi GA, Galenko VI, Mudrik SP, Ozersky BI, Khvorostyany VV, Khristevich TA. Fracture behaviour of Y-TZP ceramics: New outcomes. Ceramics International. 2010;36:345–350. [Google Scholar]
- 17.Luo XP, Zhang L. Effect of veneering techniques on color and translucency of Y-TZP. J Prosthodont. 2010;19:465–470. doi: 10.1111/j.1532-849X.2010.00610.x. [DOI] [PubMed] [Google Scholar]
- 18.Zhang Y, Kim JW. Graded zirconia glass for resistance to veneer fracture. J Dent Res. 2010;89:1057–1062. doi: 10.1177/0022034510375289. [DOI] [PMC free article] [PubMed] [Google Scholar]
- 19.Griffin JD., Jr Tooth in a bag: same-day monolithic zirconia crown. Dent Today. 2013;32:124, 126–131. [PubMed] [Google Scholar]
- 20.Christensen R. Focus on: monolithic crowns. Dent Today. 2013;32:22. [PubMed] [Google Scholar]
- 21.Zhang Y. Making yttria-stabilized tetragonal zirconia translucent. Dent Mater. 2014;30:1195–1203. doi: 10.1016/j.dental.2014.08.375. [DOI] [PMC free article] [PubMed] [Google Scholar]
- 22.Klimke J, Trunec M, Krell A. Transparent Tetragonal Yttria-Stabilized Zirconia Ceramics: Influence of Scattering Caused by Birefringence. Journal of the American Ceramic Society. 2011;94:1850–1858. [Google Scholar]
- 23.Zhang HB, Li ZP, Kim BN, Morita K, Yoshida H, Hiraga K, Sakka Y. Effect of Alumina Dopant on Transparency of Tetragonal Zirconia. Journal of Nanomaterials. 2012:269065. Article ID 269064. [Google Scholar]
- 24.Zhang HB, Li ZP, Kim BN, Morita K, Yoshida H, Hiraga K, Sakka Y. Highly Infrared Transparent Nanometric Tetragonal Zirconia Prepared by High-Pressure Spark Plasma Sintering. Journal of the American Ceramic Society. 2011;94:2739–2741. [Google Scholar]
- 25.Wang Y, Huang H, Gao L, Zhang F. Investigation of a new 3Y-stabilized zirconia with an improved optical property for applications as a dental ceramic. Journal of Ceramic Processing Research. 2011;12:473–476. [Google Scholar]
- 26.Kim JW, Covel NS, Guess PC, Rekow ED, Zhang Y. Concerns of hydrothermal degradation in CAD/CAM zirconia. J Dent Res. 2010;89:91–95. doi: 10.1177/0022034509354193. [DOI] [PMC free article] [PubMed] [Google Scholar]
- 27.Chevalier J, Cales B, Drouin JM. Low-Temperature Aging of Y-YZP Ceramics. Journal of the American Ceramic Society. 1999;82:2150–2154. [Google Scholar]
- 28.Guazzato M, Quach L, Albakry M, Swain MV. Influence of surface and heat treatments on the flexural strength of Y-TZP dental ceramic. J Dent. 2005;33:9–18. doi: 10.1016/j.jdent.2004.07.001. [DOI] [PubMed] [Google Scholar]
- 29.Denry IL, Peacock JJ, Holloway JA. Effect of heat treatment after accelerated aging on phase transformation in 3Y-TZP. J Biomed Mater Res B Appl Biomater. 2010;93:236–243. doi: 10.1002/jbm.b.31580. [DOI] [PubMed] [Google Scholar]
- 30.ASTM. E112-110, Standard Test Methods for Determining Average Grain Size. 2011 [Google Scholar]
- 31.Han JH, Kim DY. Analysis of the proportionality constant correlating the mean intercept length to the average grain size. Acta Metall Mater. 1995;43:3185–3188. [Google Scholar]
- 32.Y M, Toraya H, Somiya S. Calibration Curve for Quantitative Analysis of the Monoclinic-Tetragonal Zr02 System by X-Ray Diffraction. 1984:C119–121. [Google Scholar]
- 33.Mochales C, Maerten A, Rack A, Cloetens P, Mueller WD, Zaslansky P, Fleck C. Monoclinic phase transformations of zirconia-based dental prostheses, induced by clinically practised surface manipulations. Acta Biomater. 2011;7:2994–3002. doi: 10.1016/j.actbio.2011.04.007. [DOI] [PubMed] [Google Scholar]
- 34.V A, Enoiu C, Volceanov E, Gavrila R. Nanostructured Zirconia Composites Stabilized with CeO2 for Biomedical Applications.pdf. Rom J Phys. 2004;49:777–787. [Google Scholar]
- 35.Fischer J, Stawarczyk B, Hammerle CH. Flexural strength of veneering ceramics for zirconia. J Dent. 2008;36:316–321. doi: 10.1016/j.jdent.2008.01.017. [DOI] [PubMed] [Google Scholar]
- 36.Chai H, Lawn BR. A universal relation for edge chipping from sharp contacts in brittle materials: A simple means of toughness evaluation. Acta Materialia. 2007;55:2555–2561. [Google Scholar]
- 37.Zhang Y, Chai H, Lee JJ, Lawn BR. Chipping resistance of graded zirconia ceramics for dental crowns. J Dent Res. 2012;91:311–315. doi: 10.1177/0022034511434356. [DOI] [PMC free article] [PubMed] [Google Scholar]
- 38.Wang F, Takahashi H, Iwasaki N. Translucency of dental ceramics with different thicknesses. The Journal of Prosthetic Dentistry. 2013;110:14–20. doi: 10.1016/S0022-3913(13)60333-9. [DOI] [PubMed] [Google Scholar]
- 39.C N, Heuer AH, Kriven WM, Ruhle M. Stability of Tetragonal Zr02 Particles in Ceramic Matrices. Journal of the American Ceramic Society. 1982;65:642–650. [Google Scholar]
- 40.Quinn GD, Giuseppetti AA, Hoffman KH. Chipping fracture resistance of dental CAD/CAM restorative materials: Part 2. Phenomenological model and the effect of indenter type. Dent Mater. 2014 doi: 10.1016/j.dental.2014.02.014. [DOI] [PMC free article] [PubMed] [Google Scholar]
- 41.Quinn J, Su L, Flanders L, Lloyd I. “Edge toughness” and material properties related to the machining of dental ceramics. Machining Science and Technology. 2000;4:291–304. [Google Scholar]
- 42.Quinn GD, Giuseppetti AA, Hoffman KH. Chipping fracture resistance of dental CAD/CAM restorative materials: Part I - Procedures and results. Dent Mater. 2014 doi: 10.1016/j.dental.2014.02.010. [DOI] [PMC free article] [PubMed] [Google Scholar]
- 43.Wang SF, Zhang J, Luo DW, Gu F, Tang DY, Dong ZL, Tan GEB, Que WX, Zhang TS, Li S, Kong LB. Transparent ceramics: Processing, materials and applications. Progress in Solid State Chemistry. 2013;41:20–54. [Google Scholar]
- 44.Zhang Y, Griggs JA, Benham AW. Influence of powder/liquid mixing ratio on porosity and translucency of dental porcelains. The Journal of Prosthetic Dentistry. 2004;91:128–135. doi: 10.1016/j.prosdent.2003.10.014. [DOI] [PubMed] [Google Scholar]
- 45.Jiang L, Liao Y, Wan Q, Li W. Effects of sintering temperature and particle size on the translucency of zirconium dioxide dental ceramic. J Mater Sci Mater Med. 2011;22:2429–2435. doi: 10.1007/s10856-011-4438-9. [DOI] [PubMed] [Google Scholar]
- 46.Anselmi-Tamburini U, Woolman JN, Munir ZA. Transparent Nanometric Cubic and Tetragonal Zirconia Obtained by High-Pressure Pulsed Electric Current Sintering. Advanced Functional Materials. 2007;17:3267–3273. [Google Scholar]


