Abstract
Background
MicroRNAs expression profiling of prostate cancer is becoming increasingly used due to its usefulness in diagnosis, staging, prognosis, and response to treatment. The aim of this study was to screen differentially expressed miRNAs in prostate cancer and analyze the functions and signal pathways of their target genes.
Material/Methods
High-throughput data of miRNAs were downloaded from The Cancer Genome Atlas (TCGA) database. A total of 551 samples (52 normal and 499 prostate cancer cases) and 1046 miRNAs expression values were selected for further analysis. Differentially expressed miRNAs between normal and prostate cancer tissues were identified using SAMR. StarBase and TargetScan software were used to predict the miRNAs’ target group and target genes, respectively. GO functional and KEGG pathway analysis was conducted on up/down-regulated expressed miRNA with DAVID. Finally, survival analysis was performed to evaluate the association of differently expressed miRNAs signature and overall survival of prostate cancer patients.
Results
A total of 162 miRNAs were differentially expressed between normal and prostate cancer samples, including 128 up-regulated and 38 down-regulated ones; hsa-mir-153-2, hsa-mir-92a-1, and hsa-mir-182 (up-regulated); and hsa-mir-29a, hsa-mir-10a, and hsa-mir-221 (down-regulated) were identified as good biomarkers. In GO and KEGG analysis, target genes of down-regulated miRNAs were significantly enriched in positive ion combination and JAK-STAT pathway annotation, respectively; the ones with up-regulated miRNAs were significantly enriched in the function of plasma membrane and MARK signaling pathway annotation, respectively. Patients were categorized into low- or high-score groups according to their risk scores from each miRNA. The patients in the low-score group had better overall survival compared with those in high-score group.
Conclusions
The 6 differentially expressed miRNAs and their target genes were used to define important molecular targets that could serve as prognostic and predictive markers in the treatment of prostate cancer. Further research on the function of the target genes in the MAPK signal pathway could provide references for treatment of prostate cancer.
MeSH Keywords: Critical Pathways, MAP Kinase Kinase Kinases, Prostatic Neoplasms
Background
Prostate cancer, the second leading cause of cancer-related deaths in men, is a complex and multifactorial disease, including genetic variation, daily habits, and environmental factors. The presence of prostate cancer may be indicated by symptoms, a physical examination, serum prostate-specific antigen (PSA), or biopsy [1]. However, as the most common tool used to detect prostate cancer, PSA testing increases cancer detection but does not decrease prostate cancer-associated mortality rates [2]. Therefore, identification and development of new potential biomarkers could be beneficial for the diagnosis and prognosis of prostate cancer patients [3].
MicroRNAs, a class of small non-coding RNAs, regulate protein-coding gene expression by repressing translation or cleaving RNA transcripts in a sequence-specific manner [4]. miRNAs could play important roles in various processes such as cell development, differentiation, proliferation, cell-cycle control, apoptosis, and metabolism [5]. Aberrantly expressed miRNAs (i.e., up-regulated and down-regulated miRNAs) are known to disrupt the expression of several mRNAs and proteins, and can be involved in the pathogenesis of various human cancers [6–8]. A growing body of evidence suggests that microRNAs expression profiling of prostate cancer is increasing in importance due to its usefulness in diagnosis, staging, progression, prognosis, and response to treatment. In 2010, Szczyrba et al. [9] demonstrated that 33 miRNAs in prostate cancer tissues were either up-regulated or down-regulated by more than 1.5-fold compared to that found in normal tissues. They suggested that miR-143 and miR-145 could be involved in the development of prostate cancer. Recently, Song et al. [10] showed that 20 abnormal prostate cancer-related miRNAs, including hsa-miR-26a, hsa-miR-152, hsa-miR-19a, hsa-miR-30c, hsa-miR-19b, and hsa-miR-146b-5p, could be used to predict the clinical behavior of prostate cancer by using their high-throughput miRNA expression profiling. Consequently, miRNAs are being regarded as new oncogenes or tumor suppressor genes and new prognostic and predictive biomarkers for prostate cancer prognosis and treatment [11].
The main purpose of this work is to identify specific miRNAs that are closely associated with prostate cancer by analyzing significantly altered miRNAs in a large dataset, and to investigate the signal pathway and function of their target genes, which might provide evidence that these miRNAs can serve as prognostic and predictive biomarkers for early diagnosis and treatment for prostate cancer.
In this study, we identified differentially expressed miRNAs between normal and prostate cancer tissues, then ROC curves were generated to determine the accuracy for miRNAs in the diagnosis of cancer. Besides, StarBase, and TargetScan software were used to predict the miRNA’s target group and target genes, respectively. GO functional and KEGG pathway analyses were conducted on up/down-regulated expressed miRNAs. Eventually, we found that 6 miRNAs – hsa-mir-153-2, hsa-mir-92a-1, hsa-mir-182, hsa-mir-29a, hsa-mir-10a, and hsa-mir-221 – could function as prognostic and predictive markers for use in treatment of prostate cancer.
Material and Methods
TCGA miRNA dataset and patient information
Expression data of miRNAs and the corresponding clinical data for patients were downloaded from The Cancer Genome Atlas (TCGA, http://cancergenome.nih.gov/) database. Expression levels of miRNAs were detected using Illumina HiSeq system. As the third stage data in TCGA, standardized miRNAs data (consisting of 1046 annotation miRNAs expression values) were extracted with zero expression data removed. Because the interior standardization of each downloaded miRNAs data were completed, we used Limma package of R language to achieve standardization between samples to remove experimental error.
Screening of miRNAs differentially expressed
We screened differentially expressed miRNAs between normal prostate tissue samples and prostate cancer tissue samples using SAMR [12] of R software, in a condition of FC=2 and FDR<0.05. To discriminate the normal prostate tissue samples and prostate cancer tissue samples, principal component analysis of the differentially expressed miRNAs was used.
Receiver operating characteristic analyses
ROC analysis for 6 significantly differentially expressed miRNAs related to patients was performed using MedCalc software [13]. Corresponding expression levels of miRNAs were sorted, and then displayed the status case-by-case (sicken for 1, survival for 0). The AUC under binomial exact confidence interval was calculated to generate the ROC curve.
Analysis of target genes of the differentially expressed miRNAs on lncRNA, circRNA, pseudogene, and sncRNA
The most differentially expressed miRNAs were illustrated, and target sites of miRNAs on lncRNA, circRNA, pseudogene, and sncRNA were predicted by using the StarBase website. One experiment was at set up to prove that the miRNAs could bind to the corresponding RNAs.
Functional analyses of the target miRNAs
Putative targets of miRNAs were predicted by TargetScan software. Then the Functional Gene Ontology (GO) biological processes terms of the putative targets of candidate miRNAs, as well as the KEGG pathway analysis, were performed by DAVID [14]. For each GO score, the P value of the function enrichment and P value of Benjamini correction were calculated. The role of the MAPK pathway in prostate cancer was analyzed by BioChart and KEGG [15].
Network analysis of correlation between miRNAs and target genes
High aggregation is an internal property of the biological network; it reflects a highly modular gene network. One method that can be used to distinguish those module groups with different scales and specific function is to decompose into relatively independent modules before analyzing the network containing a large number of genes.
Network topological property of proteins was analyzed by Network Analyzer [16], a software package of Cytoscape. Then Clusterone was used to modularize the network functions. The first 5 modules with enrichment P value <1.0e-05 were selected for functional analysis.
Identification of candidate prognostic markers by Kaplan-Meier method
We randomly divided the dataset into training and testing datasets, and applied the Cox regression model to the training dataset to determine the survival association markers (p<0.01). We then used this model to predict the testing dataset and risk score for each patient. According to this model, a high score means weak survival ability and the low score means strong survival ability. Finally, we used Kaplan-Meier analysis to identify the survival time distribution, and used log-rank analysis to judge the significance.
Results
Different miRNA expression level between samples
There were a total of 1041 miRNA expression values in the dataset of 551 samples, including 52 normal individuals and 499 prostate cancer patients (418 patients had clinical information). Expression levels of 494 human miRNAs were collected and discrepancies of miRNA levels between groups were tested by principal component analysis and cluster analysis (Figure 1).
Figure 1.
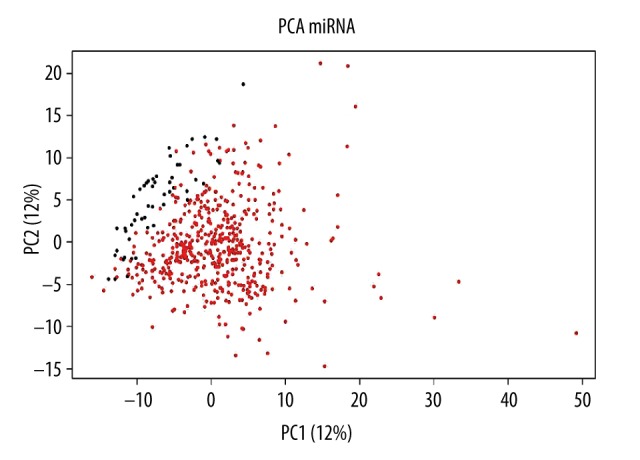
Principal component analysis of miRNA expression value. Principal component analysis is based on differences in miRNA expression level between normal samples and cancer samples. The horizontal axis shows that the first principal component accounted for 21%, the vertical axis represents the second principal component and accounted for 12%, red dots represent cancer samples, and black dots represent normal samples. It clearly shows the normal samples gathered in the upper left, and cancer samples gathered in the lower right, suggesting obvious differences between these 2 kinds of samples.
Differential expression analysis of miRNAs
A total of 162 miRNAs were differentially expressed between normal samples and prostate cancer samples, of which 128 were up-regulated and 38 were down-regulated. The up-regulated miRNAs – hsa-mir-153-2, hsa-mir-92a-1, and hsa-mir-182 – accounted for 77.1% of the differentially expressed miRNAs, while the down-regulated miRNAs – hsa-mir-29a, hsa-mir-10a, and hsa-mir-221 – accounted for 22.9%.
Estimation for the accuracy of miRNAs in the diagnosis of prostate cancer as biomarker
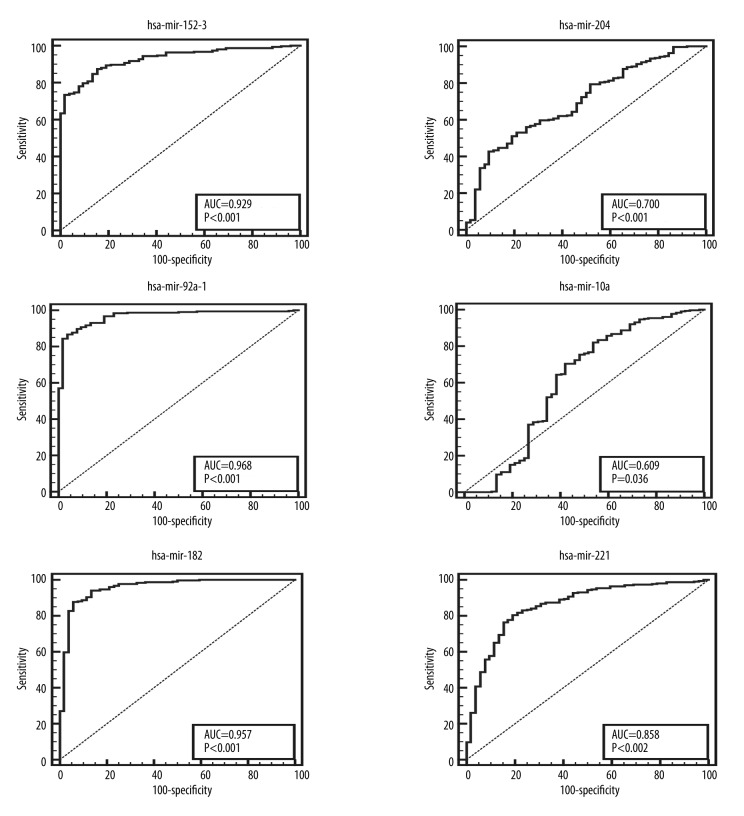
AUC analysis of the top 6 differentially expressed miRNAs showed that 3 miRNAs were up-regulated and the other 3 were down-regulated (Figure 2). miRNAs with AUC greater than 0.5 could serve as biomarkers in the diagnosis and prognosis of prostate cancer. The AUC of the first 3 up-regulated miRNAs – hsa-mir-153-2, hsa-mir-92a-1, and hsa-mir-182 – were 0.929, 0.968, and 1.000 and the AUC of the first 3 down-regulated miRNAs – hsa-mir-29a, hsa-mir-10a, and hsa-mir-221 – were 0.700, 0.609, and 0.858 (Table 1).
Figure 2.
ROC curve analysis of miRNAs. The vertical axis is sensitivity, the horizontal axis is specificity. AUC is a parameter to measure whether miRNAs could serve as biomarkers.
Table 1.
Six significant differentially expressed miRNA.
| Type | miRNA ID | logFC | P value | FDR |
|---|---|---|---|---|
| Up-regulated miRNA | hsa-mir-153-2 | 2.792626 | 4.09E-34 | 5.03E-33 |
| hsa-mir-92a-1 | 2.506774 | 8.95E-49 | 4.67E-47 | |
| hsa-mir-182 | 2.37112 | 4.80E-47 | 1.67E-45 | |
| Down-regulated miRNA | hsa-mir-204 | −1.76802 | 4.54E-39 | 8.63E-38 |
| hsa-mir-10a | −1.23821 | 6.66E-21 | 3.40E-20 | |
| hsa-mir-221 | −1.13834 | 1.11E-24 | 7.23E-24 |
First column – regulated type; Second column – miRNA’s name; Third column – logFC score represent different expression of miRNA in cancer samples and normal samples; Fourth column – significant degree of P values; Fifth column – corrected P values FDR.
Prediction for the putative targets of the differentially expressed miRNAs
The most significantly differentially expressed miRNAs – hsa-mir-153-2, hsa-mir-92a-1, hsa-mir-182, hsa-mir-204, hsa-mir-10a, and hsa-mir-221 – could serve as biomarkers in the prediction of prostate cancer. Therefore, the putative targets of these 6 miRNAs were further analyzed (Figure 3, Table 2). Through use of the StarBase website, target sites of miRNAs on lncRNA, circRNA, pseudogene, and sncRNA were predicted.
Figure 3.
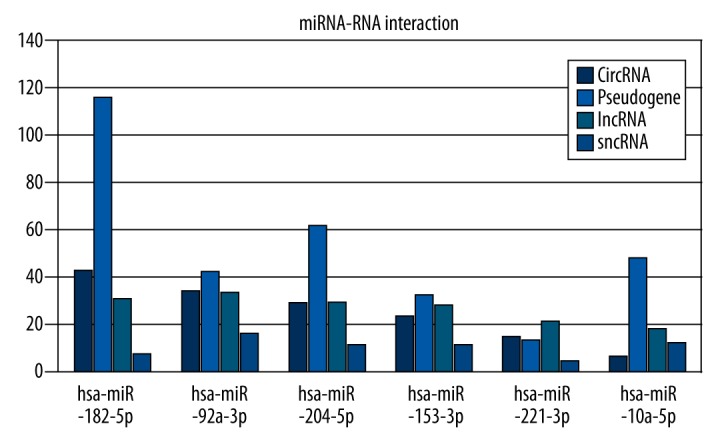
Target group RNAs analysis of miRNAs. The horizontal axis is the name of miRNAs, the vertical axis is the target group RNAs.
Table 2.
Target group RNAs of the six most significant differentially expressed.
| Target | miRNA | Gene name | # | Target | miRNA | Gene name | # |
|---|---|---|---|---|---|---|---|
| lncRNA | hsa-miR-204-5p | XIST | 4 | Pesudogene | hsa-miR-92a-3p | ZNF271 | 2 |
| hsa-miR-92a-3p | hsa-miR-221-3p | ||||||
| hsa-miR-182-5p | |||||||
| hsa-miR-153-3p | |||||||
|
|
|
||||||
| hsa-miR-204-5p | DCP1A | 3 | hsa-miR-204-5p | RP11-632C17__A.1 | 2 | ||
| hsa-miR-182-5p | hsa-miR-182-5p | ||||||
| hsa-miR-153-3p | |||||||
|
|
|
||||||
| hsa-miR-204-5p | CTA-204B4.6 | 2 | hsa-miR-221-3p | RNF216P1 | 2 | ||
| hsa-miR-221-3p | hsa-miR-153-3p | ||||||
|
|
|
||||||
| circRNA | hsa-miR-10a-5p | ZNF264_hsa_circ_001634 | 4 | hsa-miR-92a-3p | MAP2K4P1 | 2 | |
| hsa-miR-92a-3p | hsa-miR-10a-5p | ||||||
| hsa-miR-182-5p | |||||||
| hsa-miR-153-3p | |||||||
|
|
|
||||||
| hsa-miR-204-5p | PLCL2_hsa_circ_001828 | 3 | hsa-miR-10a-5p | HNRNPKP4 | 2 | ||
| hsa-miR-92a-3p | hsa-miR-153-3p | ||||||
| hsa-miR-182-5p | |||||||
|
|
|
||||||
| hsa-miR-182-5p | ISY1_hsa_circ_001859 | 3 | hsa-miR-10a-5p | HNRNPKP1 | 2 | ||
| hsa-miR-153-3p | hsa-miR-153-3p | ||||||
| hsa-miR-221-3p | |||||||
|
|
|
||||||
| sncRNA | hsa-miR-153-3p | U2 | 3 | hsa-miR-204-5p | HIN1L | 2 | |
| hsa-miR-221-3p | hsa-miR-153-3p | ||||||
| hsa-miR-204-5p | |||||||
|
|
|
||||||
| hsa-miR-92a-3p | Y_RNA | 2 | hsa-miR-204-5p | GAPDHP40 | 2 | ||
| hsa-miR-204-5p | hsa-miR-10a-5p | ||||||
|
|
|
||||||
| hsa-miR-182-5p | SNORD46 | 2 | hsa-miR-204-5p | AL139819.1 | 2 | ||
| hsa-miR-182-5p | hsa-miR-92a-3p | ||||||
|
|
|
||||||
| hsa-miR-10a-5p | SNORA65 | 2 | hsa-miR-204-5p | AFG3L1P | 2 | ||
| hsa-miR-92a-3p | hsa-miR-10a-5p | ||||||
|
|
|
||||||
| hsa-miR-10a-5p | SCARNA13 | 2 | hsa-miR-92a-3p | AC008738.1 | 2 | ||
| hsa-miR-92a-3p | hsa-miR-182-5p | ||||||
|
| |||||||
| hsa-miR-153-3p | RNA5-8SP3 | 2 | |||||
| hsa-miR-92a-3p | |||||||
|
| |||||||
| hsa-miR-10a-5p | MT-RNR2 | 2 | |||||
| hsa-miR-221-3p | |||||||
This table is divided into two parts, the left part is the target for lncRNA, circRNA, sncRNA, and the right part is the target for pseudogene. The first column is the type of the target, the second column is the corresponding miRNAs, the third column is the name of the target and the fourth column is the amount of the target.
Functional analysis of the target genes of miRNAs of interest
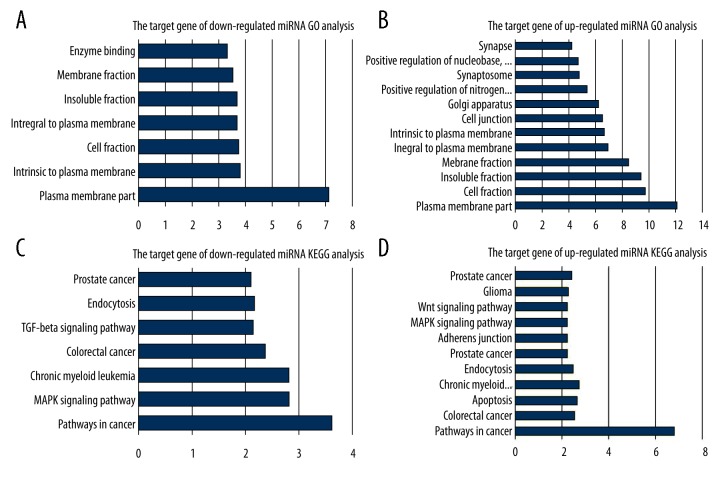
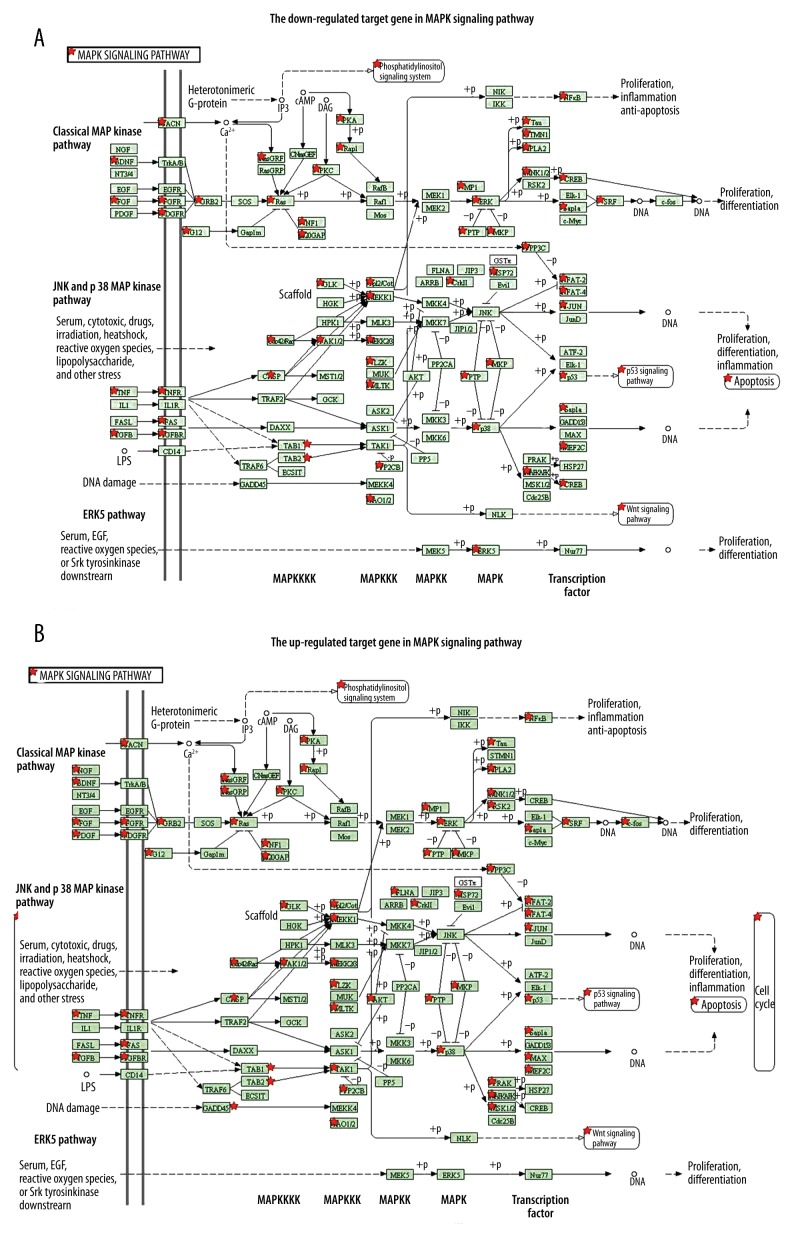
Putative targets of the differentially expressed miRNAs were created by software, of which 7992 were down-regulated miRNAs and 35483 were up-regulated miRNAs. In gene ontology and KEGG-enrichment analysis (Figure 4), 7 GO annotations and 7 KEGG annotations showed significant enrichment of the down-regulated miRNAs’ target genes. Positive ion combination and JAK-STAT pathway were the most obvious annotation of GO and KEGG, respectively. There were 12 GO annotations and 11 KEGG annotations that showed significant enrichment of up-regulated miRNAs’ target genes. The function of plasma membrane and MARK signaling pathway was the most obvious annotation of GO and KEGG, respectively. Obviously, GO and KEGG annotations showed that both target genes of up/down-regulated miRNAs were mainly enriched in function of plasma membrane and the pathways in cancer. The other KEGG enrichment annotations for the target genes of up-/down-regulated miRNAs were also associated with prostate cancer and MARK signaling pathway. In addition, the KEGG network analysis showed that 72 target genes among the down-regulated ones were enriched in the MAPK signal pathway and 111 target genes among the up-regulated ones were also enriched in the MAPK signal pathway (Figure 5).
Figure 4.
GO (A, B) and KEGG (C, D) analysis of target genes of differentially expressed miRNAs. The horizontal axis is the significance degree, the vertical axis is the functional annotation. A larger value of degree of significance corresponds to a stronger correlation between the target genes and annotation.
Figure 5.
A, B) Functional analyses of target genes of the differentially expressed miRNAs in MAPK signal pathway. KEGG analyses show that target genes of the differentially expressed miRNAs participate in the MAPK signal pathway. Red stars indicate the target genes involved in this signal pathway, green boxes represent the molecules in the signal pathway of molecules, and arrows indicate the interaction between them.
The network analysis of the interactions between the miRNAs and their target genes
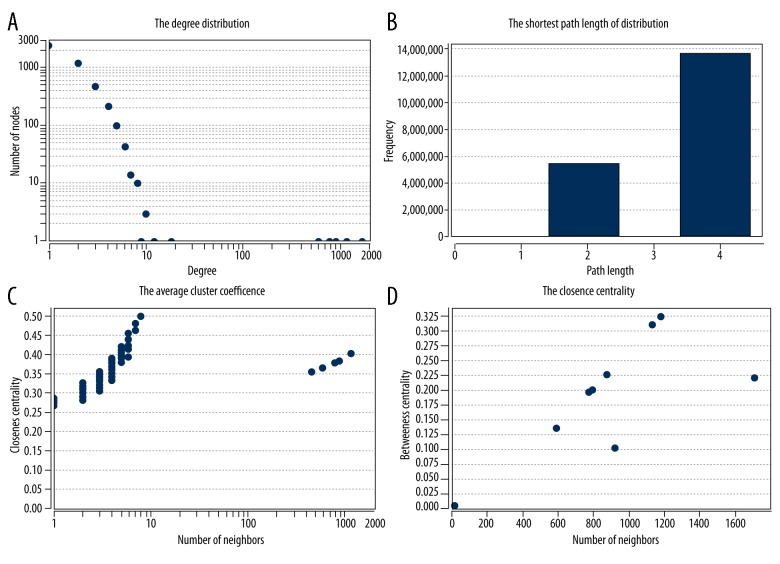
Network topology calculation is shown in the following figures: the degree distribution (Figure 6A), the shortest path length distribution (Figure 6B), the average cluster coefficient degree (Figure 6C), and the intimate centrality (Figure 6D). These parameters showed that the network node degree distribution for the interaction between proteins encoded by the differentially expressed genes was consistent with the power-law distribution of the network and had structural properties.
Figure 6.
Network analysis of the topological structure. (A) the degree distribution; (B) the shortest path length distribution; (C) the average cluster coefficient; (D) the topological structure analysis.
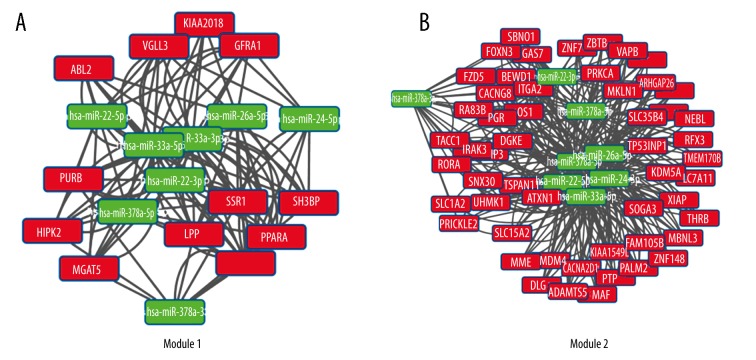
Applying the Cluster one in Cytoscape software, the sub-modules in the interactional network of the proteins, which were correlated with differentially expressed genes, were screened. Two modules under the condition of more than 5 nodes were screened and modular significance P value less than 0.05 were obtained. Figure 7 describes the analysis of the function module in network. Module 1 was enriched in pathway in cancer, indicating these genes were mainly involved in cancers. The abnormally expressed genes caused diseases when the miRNAs combined with them. Module 2 was enriched in the Wnt signal pathway, and abnormal activation of the Wnt signaling pathway played a very important role in the pathogenesis and development of prostate cancer. Androgen receptor (AR) was the key in the transformation between the occurrence and development of prostate cancer and androgen-independent prostate cancer (AIPC). The AR signal pathway has been a major target for prostate cancer research and the Wnt signal pathway played an important role in the target therapy of tumors. Therefore, studies on the Wnt signal pathway contributed importantly to the treatment of disease.
Figure 7.
A,B) Analysis of the function module in network. Red indicates genes, green represents miRNAs. Ligatures demonstrate the interaction between miRNAs and mRNAs.
Survival analysis of each miRNA
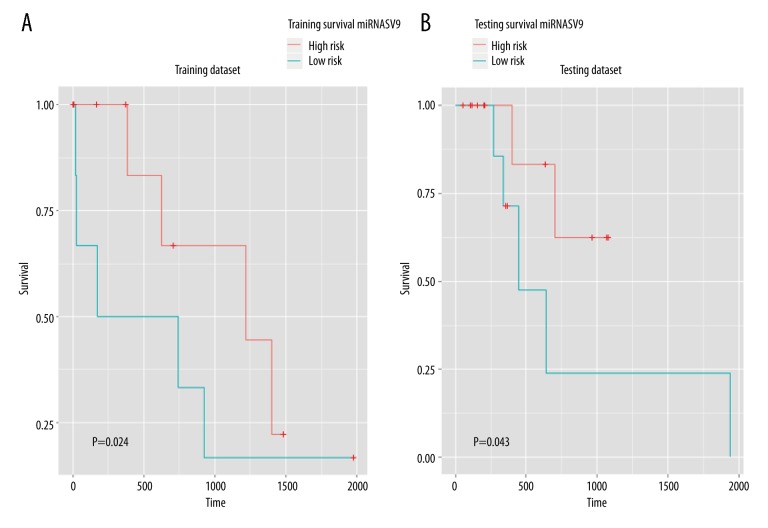
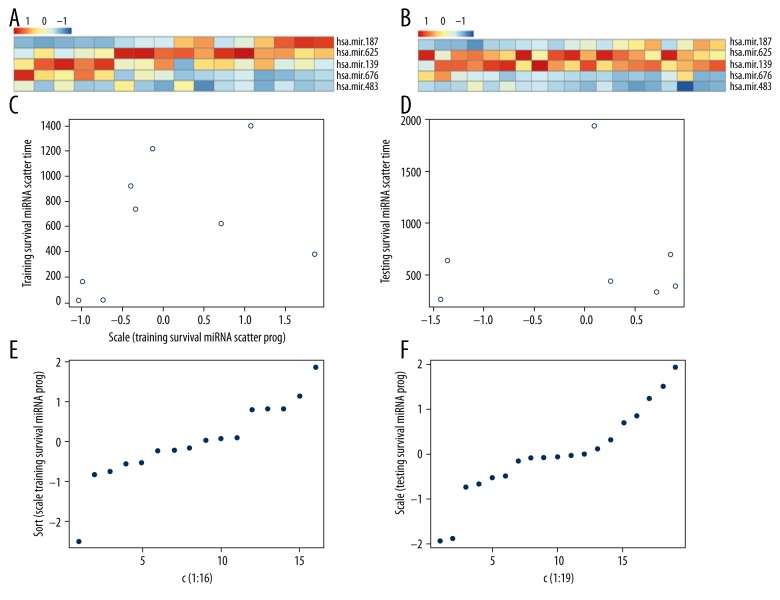
We used a training dataset to construct a Cox multiple variance regression model; the prognostic function is Prognostic score=(−4.722× expression level of hsa-mir-483)+( −4.449× expression level of hsa-mir-675)+( −2.745× expression level of hsa-mir-139)+(4.866× expression level of hsa-mir-625)+(5.602× expression level of hsa-mir-187). In the model, 3 miRNAs were risky, and 2 miRNAs were protective. After divide the patients into high- and low-risk groups, we used the log-rank test model to test the difference between the 2 groups (Figure 8). The training dataset showed a very large difference between high- and low-risk patients and the result of Kaplan-Meier analysis and heatMap showed miRNA expression in high- and low-risk patients (Figure 9).
Figure 8.
A, B) Kaplan Meier survival analysis to judge the survival risk. The horizontal axis is the survival time, the vertical axis is the survival rate. The p value indicates the difference between 2 groups.
Figure 9.
The analysis of the risk score of prognostic miRNA. A and B are risk score analysis in training and testing dataset. C and D are the relation between survival times and risk score. E and F are the risk score distribution.
Discussion
At present, early diagnosis of cancer and timely detection of disease progression following either radical prostatectomy or radiation therapy are crucial for the effective treatment of prostate cancer and for a beneficial clinical outcome. Although several prognostic and predictive markers or models, such as PSA, have been proposed or developed, there remain limitations, such as a the low detection rate in the so-called gray zone (PSA, 4–10 ng/mL), as well as a lack of advantage of PSA screening for a control group and the fact that PSA screening is often associated with over-diagnosis [17,18]. Thus, there has been extensive investigation and exploration of alternative biomarkers.
miRNAs, as a family of small non-coding RNAs post-transcriptionally involved in gene regulations, have been recognized as important intervention targets and predictive tools for various human cancers because of the stability and convenience of miRNA detection [19,20]. Several study groups have identified disease-specific miRNA expression profiles for clinical outcome prediction. Through investigating the associations of miRNA expression and clinicopathological data in 76 prostate cancer tissue samples, 10 miRNA expressions were correlated with Gleason score and the tumor stage, which is incorporated into a strategy to predict prognosis and help guide therapy [21]. Penney et al. [23] found that 157 mRNA expression signatures in prostate cancer tissues could be used to predict both the Gleason score and the relative risk of lethality, which was helpful in the avoidance of overtreatment. However, different uses of approaches or pre-selections of target miRNAs may identify totally different miRNAs.
In this study, we identified 6 differentially expressed miRNAs from the significantly altered miRNAs using data from the TCGA dataset. Principal component analysis confirmed that the expression of hsa-mir-153-2, hsa-mir-92a-1, hsa-mir-182, hsa-mir-29a, hsa-mir-10a, and hsa-mir-221 could distinguish prostate cancer patients from normal controls. Moreover, the target genes of the 6 miRNAs were mainly involved in MAPK signal pathways in prostate cancer. In addition, the availability and rationality of these interactions among these 6 miRNAs as independent prognostic and predictive indicators in prostate cancer were supported by integrated analysis of network and correlation analysis. Our results suggest a potential application of these 6 miRNA profiles and their interactions in development and improvement of prognostic tools and treatments. The candidate miRNAs in the present study were convincing and feasible for further potential application in clinical practice.
Among the 6 miRNAs of interest, hsa-mir-29a and hsa-mir-221were reported to inhibit prostate cancer cell growth as candidate tumor suppressors [24,25], possibly because their target genes were mostly related with cell proliferation and differentiation. TRIM68, the target genes of hsa-mir-29a could functionally interact with co-activators of androgen receptor (AR) and promote the transactivation of AR [26], while BMI-1, the target genes of hsa-mir-221, was a crucial regulator of prostate stem cell self-renewal and malignant transformation [27]. Moreover, several studies, both in vivo and in vitro, indicated hsa-mir-153-2, hsa-mir-92a-1, and hsa-mir-182 function as oncogenes. Overexpression of miR-182 significantly promoted the proliferation, increased the invasion, promoted the G1/S cell cycle transition, and reduced early apoptosis of PC-3 cells by directly suppressing the tumor suppressor gene NDRG1 [28]. In a xenograft mantle cell lymphoma mouse model, down-regulation of miR-92a-1, a member of the miR-92a family, could inhibit the growth of tumors [29]. miR-153-2, one copy of miR-153, was reported to be evolutionarily conserved and partly co-regulated with IA-2β expression in an in vitro rodent glucose stimulation [30]. However, we are not aware of any study reporting interactions between these miRNAs and their target genes, which might be more reasonable to unveil their biological functions. The nature of cancer is multifactorial, and the average miRNA has approximately 100 target sites and regulate a large fraction of protein-coding genes, which form a regulatory network [31,32]. Our result for the first time showed that target genes of these 6 up-/down-regulated miRNAs were mainly involved in function of plasma membrane and the MAPK pathways in prostate cancer. The MAPK pathway is an input point of multiple signals, and the abnormal secretion of polypeptide growth factors involved will change the signal transduction, which can result in cancer of prostate cells and generation of androgen-independence (Figure 7A, 7B) [33]. Therefore, it becomes the new target for cancer therapy. Raf, as effector molecules in RAS proteins that participate in the MAPK pathway and bind GTP followed by phosphorylation, activates a series of downstream reactions to affect the biological process of the cancer cells. We believe corresponding drugs will be developed soon. Likewise, although a preliminary study revealed that 10 microRNAs, including hsa-mir-10a, with statistically significant differential expression between risk prostate cancer risk groups and healthy controls can act as biomarkers to identify risk groups by using array technology by real-time PCR [34], we found down-regulated hsa-mir-10a was linked with prostate cancer. Through network analysis of the correlation between miRNAs and target genes, we found it was involved in the MAKP signal pathway in prostate cancer. Therefore, the interaction analysis of miRNAs may be useful in diagnosis and prognosis of prostate cancer patients.
Conclusions
In summary, we identified hsa-mir-153-2, hsa-mir-92a-1, hsa-mir-182, hsa-mir-29a, hsa-mir-10a, and hsa-mir-221 and determined interactions between their target genes as more specific and accurate prognostic and predictive indicators to clinical outcome of prostate cancer patients, implying their utility as diagnostic and prognostic tools and treatments. However, further research is needed to investigate the individual role of these abnormal prostate cancer-related candidate miRNAs in the process of malignant progression of prostate cancer.
Footnotes
Source of support: Departmental sources
References
- 1.Siegel R, Ward E, Brawley O, et al. The impact of eliminating socioeconomic and racial disparities on premature cancer deaths. Cancer J Clin. 2011;61:212–36. doi: 10.3322/caac.20121. [DOI] [PubMed] [Google Scholar]
- 2.Baade PD, Youlden DR, Krnjacki LJ. International epidemiology of prostate cancer: geographical distribution and secular trends. Mol Nutr Food Res. 2009;53:171–84. doi: 10.1002/mnfr.200700511. [DOI] [PubMed] [Google Scholar]
- 3.Qiu S, Lin S, Hu D, et al. Interactions of miR-323/miR-326/miR-329 and miR-130a/miR-155/miR-210 as prognostic indicators for clinical outcome of glioblastoma patients. J Transl Med. 2013;11(10):10–1186. doi: 10.1186/1479-5876-11-10. [DOI] [PMC free article] [PubMed] [Google Scholar]
- 4.Goto Y, Kurozumi A, Enokida H, et al. Functional significance of aberrantly expressed microRNAs in prostate cancer. Int J Urol. 2015;22(3):242–52. doi: 10.1111/iju.12700. [DOI] [PubMed] [Google Scholar]
- 5.Bartel DP. MicroRNAs: genomics, biogenesis, mechanism, and function. Cell. 2004;116(2):281–97. doi: 10.1016/s0092-8674(04)00045-5. [DOI] [PubMed] [Google Scholar]
- 6.Calin GA, Croce CM. MicroRNA signatures in human cancers. Nat Rev Cancer. 2006;6:857–66. doi: 10.1038/nrc1997. [DOI] [PubMed] [Google Scholar]
- 7.Chen CZ. MicroRNAs as oncogenes and tumor suppressors. N Engl J Med. 2005;353:1768–71. doi: 10.1056/NEJMp058190. [DOI] [PubMed] [Google Scholar]
- 8.Caldas C, Brenton JD. Sizing up miRNAs as cancer genes. Nat Med. 2005;11:712–14. doi: 10.1038/nm0705-712. [DOI] [PubMed] [Google Scholar]
- 9.Szczyrba J, Löprich E, Wach S, et al. The microRNA profile of prostate carcinoma obtained by deep sequencing. Mol Cancer Res. 2010;8(4):529–38. doi: 10.1158/1541-7786.MCR-09-0443. [DOI] [PubMed] [Google Scholar]
- 10.Song H, Liu Y, Pan J, et al. Expression profile analysis reveals putative prostate cancer-related microRNAs. Genet Mol Res. 2013;12(4):4934–43. doi: 10.4238/2013.October.24.4. [DOI] [PubMed] [Google Scholar]
- 11.Kim WT, Kim WJ. MicroRNAs in prostate cancer. Prostate Int. 2013;1(1):3. doi: 10.12954/PI.12011. [DOI] [PMC free article] [PubMed] [Google Scholar]
- 12.Tan H, Tian Y, Yang H, et al. A novel Streptomyces gene, samR, with different effects on differentiation of Streptomyces ansochromogenes and Streptomyces coelicolor. Arch Microbiol. 2002;177:274–78. doi: 10.1007/s00203-001-0382-2. [DOI] [PubMed] [Google Scholar]
- 13.Devarakonda S, Morgensztern D, Govindan R. Clinical applications of The Cancer Genome Atlas project (TCGA) for squamous cell lung carcinoma. Oncology (Williston Park) 2003;27:899–906. [PubMed] [Google Scholar]
- 14.Dennis G, Jr, Sherman BT, Hosack DA, et al. DAVID: Database for Annotation, Visualization, and Integrated Discovery. Genome Biol. 2003;4:P3. [PubMed] [Google Scholar]
- 15.Wixon J, Kell D. The Kyoto encyclopedia of genes and genomes-KEGG. Yeast. 2000;17:48–55. doi: 10.1002/(SICI)1097-0061(200004)17:1<48::AID-YEA2>3.0.CO;2-H. [DOI] [PMC free article] [PubMed] [Google Scholar]
- 16.Nersisyan L, Samsonyan R, Arakelyan A. CyKEGGParser: tailoring KEGG pathways to fit into systems biology analysis workflows. F1000Res. 2014;3:145. doi: 10.12688/f1000research.4410.1. [DOI] [PMC free article] [PubMed] [Google Scholar]
- 17.Andriole GL, Crawford ED, Grubb RL, III, et al. Mortality results from a randomized prostate-cancer screening trial. N Engl J Med. 2009;360(13):1310–19. doi: 10.1056/NEJMoa0810696. [DOI] [PMC free article] [PubMed] [Google Scholar]
- 18.Schröder FH, Hugosson J, Roobol MJ, et al. Screening and prostate-cancer mortality in a randomized European study. N Engl J Med. 2009;360(13):1320–28. doi: 10.1056/NEJMoa0810084. [DOI] [PubMed] [Google Scholar]
- 19.Kong YW, Ferland-McCollough D, Jackson TJ, et al. MicroRNAs in cancer management. Lancet Oncol. 2012;13(6):e249–58. doi: 10.1016/S1470-2045(12)70073-6. [DOI] [PubMed] [Google Scholar]
- 20.Corsini LR, Bronte G, Terrasi M, et al. The role of microRNAs in cancer: diagnostic and prognostic biomarkers and targets of therapies. Expert Opin Ther Tar. 2012;16(S2):S103–9. doi: 10.1517/14728222.2011.650632. [DOI] [PubMed] [Google Scholar]
- 21.Schaefer A, Jung M, Mollenkopf HJ, et al. Diagnostic and prognostic implications of microRNA profiling in prostate carcinoma. Int J Cancer. 2010;126(5):1166–76. doi: 10.1002/ijc.24827. [DOI] [PubMed] [Google Scholar]
- 22.Tong AW, Fulgham P, Jay C, et al. MicroRNA profile analysis of human prostate cancers. Cancer gene Ther. 2009;16(3):206–16. doi: 10.1038/cgt.2008.77. [DOI] [PubMed] [Google Scholar]
- 23.Penney KL, Sinnott JA, Fall K, et al. mRNA expression signature of Gleason grade predicts lethal prostate cancer. J Clin Oncol. 2011;29(17):2391–96. doi: 10.1200/JCO.2010.32.6421. [DOI] [PMC free article] [PubMed] [Google Scholar]
- 24.Li Y, Kong D, Ahmad A, et al. Epigenetic deregulation of miR-29a and miR-1256 by isoflavone contributes to the inhibition of prostate cancer cell growth and invasion. Epigenetics. 2012;7(8):940–49. doi: 10.4161/epi.21236. [DOI] [PMC free article] [PubMed] [Google Scholar]
- 25.Xuan H, Xue W, Pan J, et al. Downregulation of miR-221, -30d, and -15a Contributes to Pathogenesis of Prostate Cancer by Targeting Bmi-1. Biochemistry. 2015;80(3):276–83. doi: 10.1134/S0006297915030037. [DOI] [PubMed] [Google Scholar]
- 26.Miyajima N, Maruyama S, Bohgaki M, et al. TRIM68 regulates ligand-dependent transcription of androgen receptor in prostate cancer cells. Cancer Res. 2008;68(9):3486–94. doi: 10.1158/0008-5472.CAN-07-6059. [DOI] [PubMed] [Google Scholar]
- 27.Lukacs RU, Memarzadeh S, Wu H, Witte ON. Bmi-1 is a crucial regulator of prostate stem cell self-renewal and malignant transformation. Cell Stem Cell. 2010;7:682–93. doi: 10.1016/j.stem.2010.11.013. [DOI] [PMC free article] [PubMed] [Google Scholar]
- 28.Liu R, Li J, Teng Z, et al. Overexpressed microRNA-182 promotes proliferation and invasion in prostate cancer PC-3 cells by down-regulating N-myc downstream regulated gene 1 (NDRG1) PloS One. 2013;8(7):e68982. doi: 10.1371/journal.pone.0068982. [DOI] [PMC free article] [PubMed] [Google Scholar]
- 29.Li M, Guan X, Sun Y, et al. MiR-92a family and their target genes in tumorigenesis and metastasis. Exp Cell Res. 2014;323(1):1–6. doi: 10.1016/j.yexcr.2013.12.025. [DOI] [PubMed] [Google Scholar]
- 30.Mandemakers W, Abuhatzira L, Xu H, et al. Co-regulation of intragenic microRNA miR-153 and its host gene Ia-2 β: identification of miR-153 target genes with functions related to IA-2β in pancreas and brain. Diabetologia. 2013;56(7):1547–56. doi: 10.1007/s00125-013-2901-5. [DOI] [PMC free article] [PubMed] [Google Scholar]
- 31.Brennecke J, Stark A, Russell RB, et al. Principles of microRNA – target recognition. PLoS Biol. 2005;3(3):e85. doi: 10.1371/journal.pbio.0030085. [DOI] [PMC free article] [PubMed] [Google Scholar]
- 32.Ebert MS, Sharp PA. Roles for microRNAs in conferring robustness to biological processes. Cell. 2012;149(3):515–24. doi: 10.1016/j.cell.2012.04.005. [DOI] [PMC free article] [PubMed] [Google Scholar]
- 33.Nykamp K, Lee MH, Kimble J. C. elegans La-related protein, LARP-1, localizes to germline P bodies and attenuates Ras-MAPK signaling during oogenesis. RNA. 2008;14:1378–89. doi: 10.1261/rna.1066008. [DOI] [PMC free article] [PubMed] [Google Scholar]
- 34.Medina-Villaamil V, Martínez-Breijo S, et al. Circulating MicroRNAs in blood of patients with prostate cancer. Actas Urol Esp. 2014;38(10):633–39. doi: 10.1016/j.acuro.2014.02.008. [DOI] [PubMed] [Google Scholar]


