Abstract
In dual energy CT (DECT), noise amplification during signal decomposition significantly limits the utility of basis material images. Since clinically relevant objects typically contain a limited number of different materials, we propose an Image-domain Decomposition method through Entropy Minimization (IDEM) for noise suppression in DECT. Pixels of decomposed images are first linearly transformed into 2D clusters of data points, which are highly asymmetric due to strong signal correlation. An optimal axis is identified in the 2D space via numerical search such that the projection of data clusters onto the axis has minimum entropy. Noise suppression is performed on each image pixel by estimating the center-of-mass value of each data cluster along the direction perpendicular to the projection axis. The IDEM method is distinct from other noise suppression techniques in that it does not suppress pixel noise by reducing spatial variation between neighboring pixels. As supported by studies on Catphan©600 and anthropomorphic head phantoms, this feature endows our algorithm with a unique capability of reducing noise standard deviation on DECT decomposed images by approximately one order of magnitude while preserving spatial resolution and image noise power spectra (NPS). Compared with a filtering method and recently developed iterative method at the same level of noise suppression, the IDEM algorithm obtains high-resolution images with less artifacts. It also maintains accuracy of electron density measurements with less than 2% bias error. The IDEM method effectively suppresses noise of DECT for quantitative use, with appealing features on preservation of image spatial resolution and NPS.
Index Terms: dual-energy CT, noise suppression, entropy minimization
I. Introduction
Dual-Energy Computed Tomography (DECT) has improved capability of differentiating between different materials compared to conventional CT [1]. For decades, the clinical implementations of DECT have been hindered mainly by inconsistent CT density values and long scan time [1]. Recent advances in CT technologies, especially the launch of dual-source CT, significantly improve the CT image quality and scan speed. DECT has been increasingly used for automatic bone removal [2], [3], iodine quantification [4], [5], material characterization [6]–[8], creating monochromatic images [9], [10], and virtual non-enhanced imaging [11]–[13]. The clinical applications have a continuously growing list, including diagnosis of aortic pathologies [14], lung perfusion and ventilation imaging [15], neurological and cerebral vascular imaging [16], [17], and kidney stone characterization [6]–[8]. Despite the clinical success, significant noise amplification on decomposed images remains as a fundamental limitation of DECT in quantitative applications [18]–[21]. We propose to suppress noise in DECT by utilizing the entropy property of decomposed images instead of spatial distributions of image pixels, allowing preservation of spatial resolution and noise power spectrum (NPS).
The x-ray photon attenuation of a material resulting from one interaction mechanism can be described by a universal energy-dependent function. Therefore, the total photon attenuation of an object is a weighted summation of several known energy-dependent functions for different interactions, with weights determined by the material composition of the object [22]. In the diagnostic energy range, x-ray photon interactions with matter are dominated by photoelectric absorption and Compton scattering. Thus, we can decompose the contributions from the two interaction modes using two CT scans with different x-ray spectra - a technique commonly known as DECT. As compared to conventional CT, DECT provides a more complete characterization of an object’s attenuation properties and aids material differentiation.
In the practical implementation of DECT, signal decomposition is commonly performed using two known basis materials in either the projection domain [22]–[25] or image domain [9], [26], [27]. Projection domain decomposition has the advantage of effective beam hardening correction if a non-linear decomposition is used, but it requires access to raw projection data [22], [25]. Image domain decomposition directly operates upon CT images [9], [26], [27], and its implementation is more convenient on clinical CT scanners [9], [26]. DECT on a dual-source CT scanner is one particular example where image-domain decomposition is considered advantageous. Due to the orthogonal direction of the two x-ray beams of different energies, it is difficult to accurately obtain two measurements for the same projection ray for projection-domain decomposition [1], [9], [28]. In this paper, we focus on DECT with image domain decomposition.
The decomposition procedure of DECT is highly sensitive to noise mainly because x-ray spectra at different tube voltages and energy distributions of linear attenuation coefficients of basis materials both have significant overlap in the diagnostic x-ray energy range. It has been shown that if a primitive decomposition method is employed, the signal-to-noise ratios (SNR) on decomposed images of basis materials are significantly lower than those on the original CT images [29], [30]. Noise amplification, a well-known issue since the invention of DECT [18], [19], has become the last hurdle toward quantitative use of DECT in clinical applications.
Existing low-dose CT techniques, including both hardware and software improvements, reduce noise of DECT. More sophisticated algorithms consider redundant structural information and signal statistics of dual-energy scans and embed noise suppression into the signal processing chain of DECT. For example, Warp et al. used the low-energy CT image to determine edge locations and then adaptively smoothed the high energy CT image while preserving bone edges at the predetermined locations [20]. Kalendar et al. proposed to minimize the noise of decomposed images based on its negative correlation [18]. Balda et al. developed a joint intensity statistical method on CT images prior to decomposition [21]. Recently, we have improved an iterative CT reconstruction algorithm [31] for enhanced noise suppression performance in DECT, by combining iterative CT reconstruction with the decomposition of DECT [29]. We have developed another iterative algorithm for DECT noise suppression, which is applied directly on CT images to avoid the computationally intensive reconstruction [30]. The algorithm fully explores the noise statistical properties of the decomposition process by combining noise suppression and material decomposition into an iterative process.
A common feature of most existing algorithms, including those previously developed in our group, is that they aim to reduce noise of one pixel by limiting signal variation compared with adjacent pixels. Prior knowledge or estimation of noise statistics and edge constraints help to selectively suppress the noise in a small neighborhood to avoid errors on true signals. However, in using spatial distributions, these methods inevitably sacrifice spatial resolution and alter image NPS by preferentially suppressing high-frequency noise, as shown in the results section of this paper. Shifting the NPS towards low-frequency noise leads to different image texture with the appearance of coarser noise [32] and potentially degrades object detectability [33], [34]. We aim to break the tradeoff between noise suppression and spatial resolution in the signal processing of DECT and to substantially reduce DECT noise without altering image NPS. Toward this goal, we abandon the design principle of denoising algorithms that attempt to reduce signal variations between neighboring pixels. Instead, we aim to limit signal variation within the same material. We improve material differentiation of DECT on noisy decomposed images via a new technique of entropy minimization. The image noise is effectively reduced by exploiting noise correlation properties. The performance of the proposed method, henceforth referred to as IDEM (Image-domain Decomposition through Entropy Minimization), is assessed using phantom studies. Electron density calculations are used to quantify its accuracy. The results are compared to those without noise suppression, with a filtering method [35], and with an iterative method developed in our group [30].
II. Method
A. Noise Propagation in DECT Decomposition
In this section, we first analyze noise amplification in DECT decomposition. The property of strong noise correlation on decomposed images is then investigated.
We study DECT in the diagnostic energy range with image domain decomposition. Each DECT dataset contains two CT images at different energy levels, henceforth referred to as high and low energy images. We assume that the two CT images are acquired independently and therefore have independent noise. Thus, each pixel location has a pair of corresponding values, one from the high energy image (μh) and the other from the low energy image (μl). We consider a pair of attenuation coefficients (μh, μl) to be a linear combination of two known basis materials, yielding the following relationship:
| (1) |
where μ⃗ = [μh μl]T, x⃗ = [x1 x2]T, and
| (2) |
μ1h, μ2h, μ1l, and μ2l represent the high and low energy attenuation coefficients for basis materials 1 and 2, and x1 and x2 are the unitless densities of basis materials 1 and 2, respectively. Directly solving Eqn. (1) gives the pixel values of the decomposed images as:
| (3) |
Signal SNR significantly drops on the decomposed images obtained by Eqn. (3). To see this, we note that:
| (4) |
The factor can be ignored in the SNR calculation. Eqns. (4) and (3) show that the noise variance of the decomposed images is the summation of noise variances of CT images weighted by the square of linear attenuation coefficients of the basis materials. On the other hand, the signals in decomposed images become μhμ2l − μlμ2h or −μhμ1l + μlμ1h. Therefore, with clinically relevant values of linear attenuation coefficients, decomposition using Eqn. (3) often results in large signal cancellations. A scenario for relatively small signal cancellation is when decomposing a pixel onto the basis image of its own material. However, even these best-case scenarios lead to large SNR degradation after image decomposition.
Besides noise boost, one property of decomposed images is that their noise is highly correlated [18]. For analysis simplicity, we assume that the noise of one pixel on the high and low energy CT images is Gaussian, i.e. , where is the mean value and the covariance matrix, W, is defined as follows:
| (5) |
σh and σl are the standard deviations (STDs) of independent noise associated with the high and low energy images, respectively. Based on Eqn. (3), we obtain the probability density distribution of the decomposed images: [30]. This shows that the decomposed images are jointly Gaussian, with an elliptical and highly asymmetric (i.e., highly correlated) distribution as specified by the covariance matrix A−1W (A−1)T.
To see this, we first note that:
| (6) |
where,
| (7) |
Singular value decomposition (SVD) gives:
| (8) |
where U and V are unitary matrices, and Σ is a diagonal matrix whose entries are eigenvalues of A′. Therefore, we can rewrite the covariance matrix as:
| (9) |
As such, the condition number of the covariance matrix, or the eccentricity of the joint Gaussian distribution, is totally determined by Σ.
Exerting SVD on A′, we obtain the eigenvalues of A−1W (A−1)T as:
| (10) |
where
| (11) |
Using Taylor’s expansion, we simplify Eqn. (10) via the following approximation:
| (12) |
where f is positive and Δ is a small value compared to f. The condition number of A−1W (A−1)T is finally approximated as:
| (13) |
For practical values in DECT, the denominator of the first term of Eqn. (13) is close to zero, which drives to be much greater than 1. For example, since σl and σh are typically on the same order of magnitude, the above approximation gives values on the order of 103 if we assign the values for epoxy and aluminum (i.e., two basis materials used in the presented studies of this paper) at tube potentials of 75 kVp and 125 kVp, i.e., {0.024, 0.084, 0.022, 0.065} mm−1, to the linear attenuation coefficients used in the material decomposition, {μ1l, μ2l, μ1h, μ2h}. The estimated condition number is consistent with the measured values in our experiments.
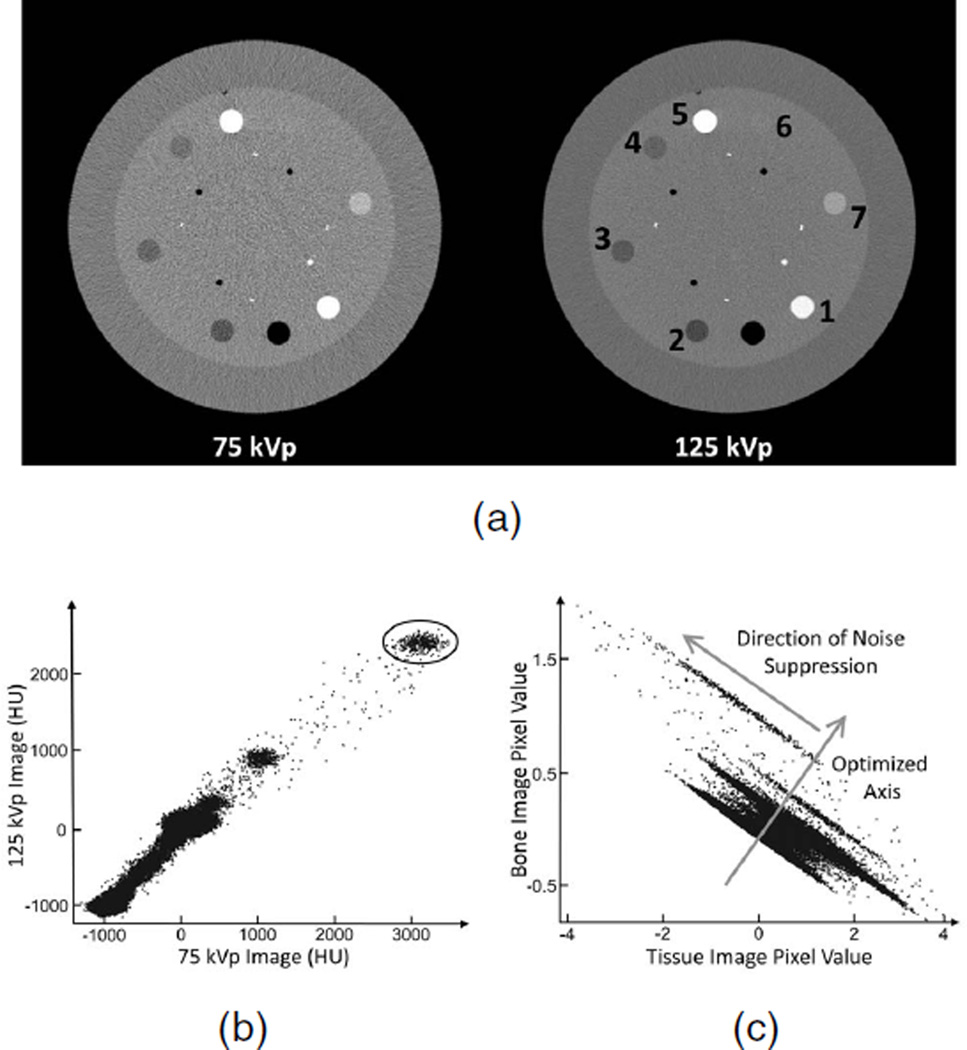
To better demonstrate the effect that a large condition number has on decomposed image noise, Fig. 1 shows low and high energy CT images as well as 2D scatter plots of pixel values before and after DECT decomposition. Each pixel pair in Fig. 1a corresponds to one data point in the plots of Figs. 1b and 1c. Due to independent noise in CT images, the image pixels of one material form an elliptical cluster in a 2D scatter plot of pixel values as seen in Fig. 1b. Note, the pixel values of CT images are in Hounsfield Units (HU), which is converted from the linear attenuation coefficient μ as:
| (14) |
where μwater is the linear attenuation coefficient of water in the CT image. As illustrated in Fig. 1c, DECT decomposition forces the material clusters into a highly asymmetric shape, dramatically prolonging them in the direction of signal correlation. In this paper, we aim to suppress noise on decomposed material images by utilizing the eccentric statistical distribution.
Fig. 1.
(a) CT images of the contrast-rod slice of the Catphan©600 phantom accompanied by 2D scatter plots of pixels (b) before and (c) after DECT decomposition. The numbered materials are: [1] Teflon, [2] polymethylpentene (PMP), [3] low density polyethylene (LDPE), [4] Polystyrene, [5] aluminum, [6] acrylic, and [7] Delrin. The circled area in (b) indicates a group of data points from the aluminum rod. The arrows in (c) show the optimized axis and the direction of noise suppression in the IDEM algorithm. Display window for (a) is [−500 1000] HU.
B. Noise Suppression through Entropy Minimization
Noise suppression is possible when redundant information is explored on the measurements. Existing algorithms reduce noise in data of a single measurement by implicitly assuming similar noise statistics for neighboring pixels. Novel methods have been developed to exclude pixels (e.g., edges) with highly different statistics from noise suppression. However, as long as a method relies on the spatial relationship of signals, it is difficult, if not impossible, to eliminate all associated errors, including spatial resolution loss and degraded NPS [36].
Since the accuracy of CT imaging has been significantly improved by recent advances on CT hardware, reconstruction algorithms, and correction algorithms, pixels representing the same material have consistent values and noise statistics on CT images and thus on DECT decomposed images. We propose using the material, or entropy property, of the imaged object for noise reduction on DECT, i.e., the IDEM method. Pixels representing similar materials are first estimated and grouped. Noise suppression is then carried out on these pixels by utilizing the noise correlation between the decomposed images.
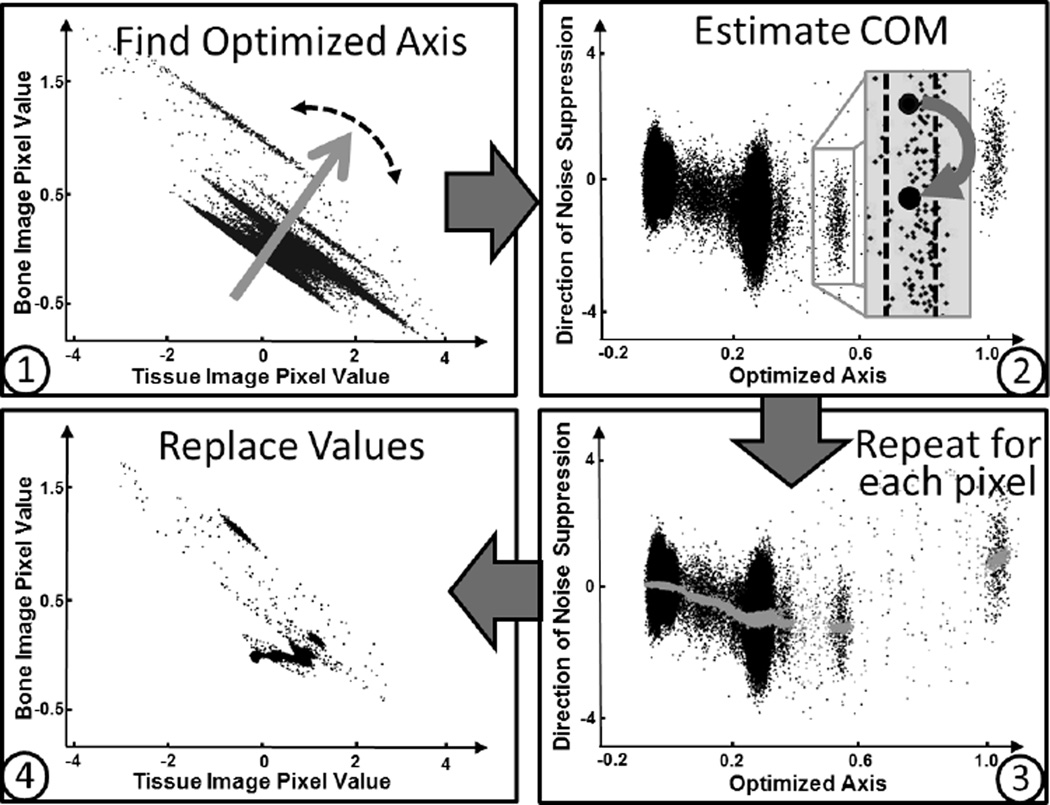
Here we describe the design principle and workflow of the IDEM algorithm. More implementation details will be included in the next section. If decomposed images were to contain negligible noise, the 2D scatter plot of these decomposed images should reveal tight clusters about different centers-of-mass (COM) for different materials. Based on this concept, to reduce noise boost during decomposition, we propose an entropy-minimization based algorithm, outlined in Fig. 2. We first search for an axis passing through the origin in the 2D scatter plot of decomposed images, on which the projection of all data points has minimal entropy. This optimized axis specifies the direction that the magnified noise minimally increases the image entropy. Next, we implement an empirical noise suppression procedure in the direction perpendicular to the axis of minimum entropy as indicated in Steps 2 and 3 of Fig. 2. For each pair of pixels on decomposed images at the same location, x⃗, we project the data point in the scatter plot onto the optimized axis. Pixels of similar materials are identified if their projections onto the optimized axis are within a small neighborhood around the projection of x⃗. We then calculate the COM value, , for this pixel group. x⃗ is finally replaced by for noise suppression. The optimal axis in the 2D scatter plot and the direction of noise suppression are indicated in Fig. 1c.
Fig. 2.
Outline of the IDEM method. The plot in Step 2 depicts the same data points as those in Step 1 rotated about the origin so that the optimized axis is horizontal. Note that different scales are used on the axes of the subfigures for improved clarity. In Step 3, the grey points are the COM estimates that will replace the black points.
Signal bias appears on the noise-suppressed images if pixels of different materials are grouped together for the COM calculation. Generally, including more pixels in the COM calculation increases the strength of noise suppression but also the possible bias. This tradeoff can be likened to those in other noise suppression techniques, such as filtering or gradient-based iterative methods, where stronger noise suppression typically leads to poorer image spatial resolution. As discussed in detail in the next section, two strategies are proposed to improve the accuracy of material differentiation and thus to reduce image bias. We differently weight the contribution of each pixel to the COM calculation such that pixels with CT values close to (or far from) the CT values at the location of x⃗ have high (or low) influence. A spatial weighting technique is also designed as an option in the IDEM algorithm to further alleviate error for pixels that have close CT values but are spatially distant.
C. Implementation Details
In this section, we provide a detailed explanation for each step of the IDEM algorithm shown in Fig. 2, with examples of pseudo codes for two-dimensional images.
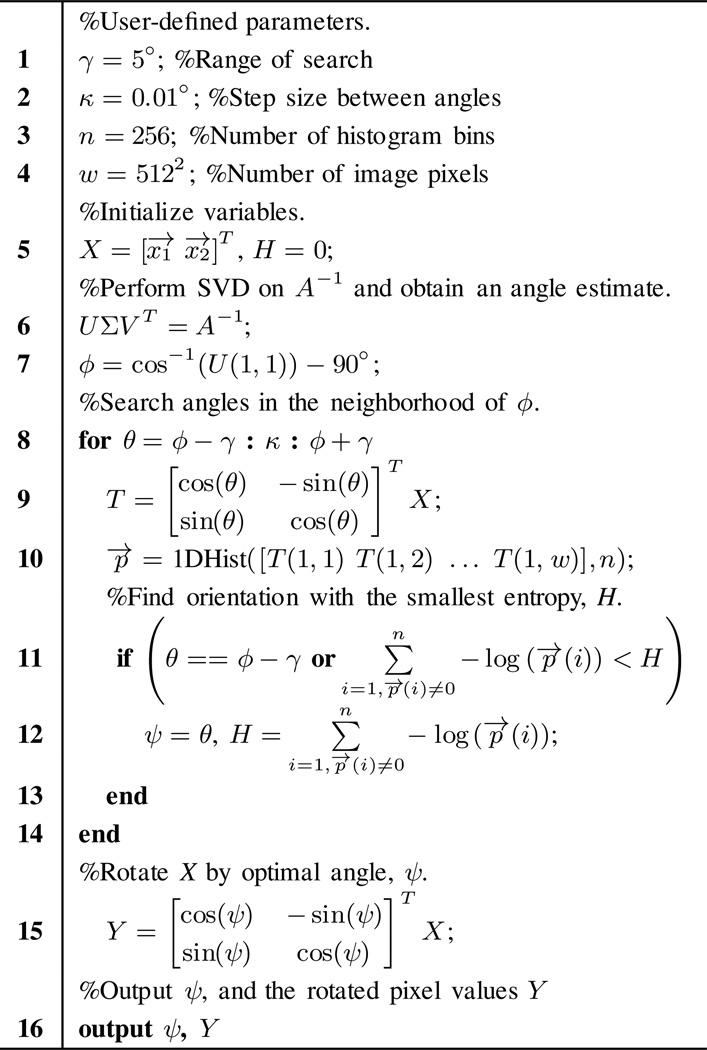
Fig. 3 shows the pseudo code for Step 1 (i.e., finding the optimal axis onto which the projection of data clusters has minimum entropy) with parameter values used in our implementations. The orientation of the optimal axis is primarily determined by the unitary matrix U in Eqn. (9), which depends on both the decomposition matrix A and the covariance matrix W. However, W is determined by the unknown noise STDs of the high and low energy CT images. To provide an initial estimate of the angle of the optimal axis, we assume that noise STDs in the high and low energy images are approximately equal, which changes Eqn. (7) to:
| (15) |
where σ is a scalar and does not affect the unitary matricies determined through SVD. Thus, we can estimate the optimal angle via SVD on A−1. We then refine this value using a brute-force algorithm to search amongst neighboring angles for the value achieving minimum entropy (lines 8–14 in Fig. 3). The entropy of a histogram, p⃗, with n bins is calculated as shown in line 12. The angle onto which the projection of all data points has the minimum entropy is selected as the optimal, and all data points in the scatter plot are rotated by that angle.
Fig. 3.
Pseudo code for Step 1 of Fig. 2. In line 10, 1DHist(T⃗, n) is a function that converts a vector T⃗ into a histogram normalized by the total number of points, with n histogram bins.
Step 1 outputs a 2-by-w matrix Y, where w is the total number of image pixels. The majority of noise amplification from decomposition is now confined to the second row of Y, y⃗2, while the first row of Y, y⃗1, can be used as an indicator of different materials. We therefore use y⃗1 for material classification and perform noise suppression on y⃗2.
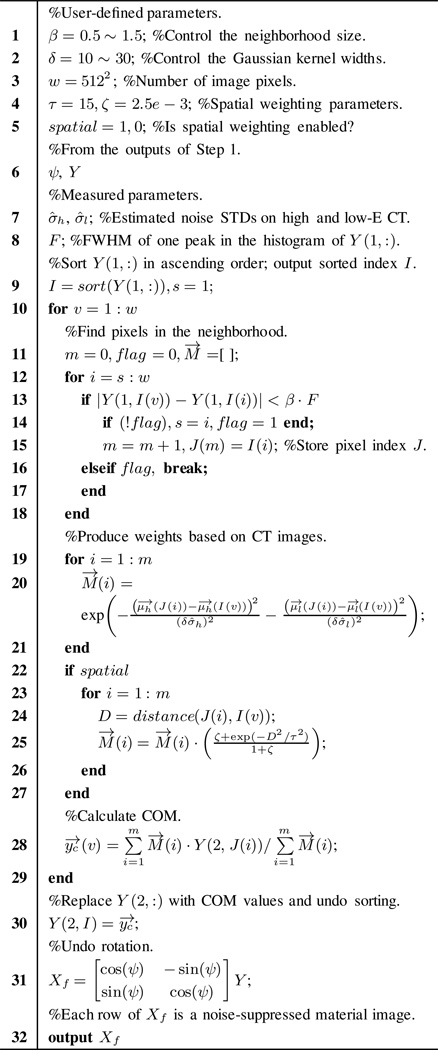
Fig. 4 shows the pseudo code for Steps 2–4 of the IDEM algorithm. To improve computation efficiency, we first sort y⃗1 in ascending order (line 9). For each image pixel, a group of pixels is selected such that their y⃗1 values are in a small neighborhood (lines 12–18). The neighborhood size is set to be β · F, where β is a user-defined parameter (0.5 ~ 1.5 in our implementations) and F is the measured full-width-at-half-maximum (FWHM) of one major peak in the histogram of y⃗1. Note that, since y⃗1 values are pre-sorted, the search range for neighboring pixels is small and is adaptively changed for each search. We suppress image noise by calculating the COM in the direction perpendicular to the optimal axis using the y⃗2 values of all pixels identified as one group. To improve algorithm accuracy in the presence of material classification errors, we weight each value of y⃗2 differently in the COM calculation (line 28). The weight assigned to one pixel (with index a) inside the neighborhood of a different pixel (with index b) is calculated using two schemes shown in lines 19–27. The first weight is calculated in line 20, using a Gaussian function of CT value differences for pixels a and b on the high and low-energy CT images. The width of Gaussian kernel is controlled by δ · σ̂, where δ is a user-defined parameter and σ̂ is the estimated or measured noise STD in a CT image. Line 25 calculates a second and optional weight, which uses an empirical function of geometric distance, D, between pixels a and b. Pixels with close CT values and geometric distance (if the spatial weighting is enabled) are considered more likely to be of the same material and therefore contribute more to the COM calculation. The calculated COM value then replaces the value of y⃗2(b) (line 30). Noise suppressed images of decomposed materials are finally obtained after undoing the operations of sorting and rotation (lines 30–32).
Fig. 4.
Pseudo code for Steps 2 through 4 of Fig. 2. Line 24 calculates the geometric distance between two pixels with indices of J(i) and I(υ).
D. Selection of Algorithm Parameters
All the control parameters of the IDEM algorithm and their values in our implementations are shown in the pseudo codes of Figs. 3 and 4. In this paper, most parameter values are fixed and the method performance is controlled by tuning only two parameters: β and δ.
The β value determines the size of the neighborhood used to group pixels for COM calculations. As including more pixels in a COM calculation increases the strength of noise suppression, β is strongly correlated with the level of noise suppression. Stronger noise suppression, however, increases potential errors of image bias. In our studies, we find that β values in the range of 0.5 ~ 1.5 well balance the strength of noise suppression and the induced image bias errors. The selection of δ balances the same tradeoff by controlling the joint-Gaussian function used to weight a pixel’s contribution in the COM calculation based on its CT values. The δ value is inversely correlated with the reliance on CT values for material classification. We find that our method performance is relatively insensitive to the choice of δ values in the range of 10 ~ 30.
E. Evaluation
We have assessed method performance using an evaluation phantom, Catphan©600 (The Phantom Laboratory: Salem, NY), and an anthropomorphic head phantom. Projection data were acquired using a tabletop CT system at Georgia Institute of Technology [37], whose geometry matches that of the onboard imager system of a Varian radiation therapy machine. Phantom data were acquired for 655 projection views using tube potentials of 75 kVp and 125 kVp and a tube current of 80 mA. To limit photon scatter, the phantoms were imaged with a narrowly opened collimator, i.e., a fan-beam equivalent geometry. High and low energy CT images were reconstructed using filtered backprojection (FBP), with an image size of 512 by 512 pixels and pixel resolution of 0.5 by 0.5 mm2. The x-ray tube (Varian RAD-94) has inherent filtration of 0.5 mm Al. Beam hardening effects due to the poly-energetic spectrum of the x-ray source introduce CT errors and therefore bias on the decomposed images. Our algorithm for noise suppression via entropy minimization typically takes 10 to 20 minutes using MATLAB on a 2.66 GHz CPU workstation. It is worth noting that, although based on the same physical principle, the DECT studies presented in this paper use experimental configurations different from those of a clinical DECT scanner.
We compared the IDEM algorithm with a filtering method [35] and an iterative method recently developed in our group by Niu et al. [30]. All three methods perform decomposition in the image domain after a standard CT reconstruction using FBP. The filtering method applies a median filter to the high and low energy images prior to material decomposition. This decreases noise in the initial CT images and thus limits the amount of amplified noise in the resultant basis material images. The iterative method formulates the material decomposition of DECT as a least-squares estimation problem, with a regularization term to preserve structural edges and with the inverse of the estimated variance-covariance matrix of the decomposed images as the penalty weight in the least-squares term. We used image noise, NPS, and spatial resolution as image quality metrics in the comparisons. The accuracy of electron density measurements with and without the proposed noise suppression was also investigated.
One slice of the Catphan©600 phantom, which contains high contrast line pairs, was used to evaluate performance on spatial resolution. The line pairs with spatial frequency from 1 to 21 line pairs/cm are made of aluminum, surrounded by epoxy, a water-equivalent material. In the study, basis materials of aluminum and epoxy were chosen to create “bone” and “tissue” images, respectively. A uniform area was selected as the region of interest (ROI) for noise analysis. In addition, the 2D NPS was calculated for an area of uniform material as:
| (16) |
where f is the image ROI with pixel values offset to achieve a zero mean value, and DFT2{f} denotes the 2D discrete Fourier transform of the image [38]–[40].
A different slice of the Catphan©600 phantom, which contains rods of different materials, was used to assess the accuracy of electron density measurements. We used epoxy and aluminum as basis materials to create “tissue” and “bone” images, respectively. Contrast rods were used as ROIs for electron density measurement, calculated as:
| (17) |
where xb and xt are pixel values of decomposed bone and tissue images, and ρe,b and ρe,t are the electron densities of the bone and tissue materials, respectively. Note that the decomposed images are unitless and indicate the normalized densities of equivalent basis materials contained inside one pixel. For each rod, the average percent error of associated pixels was determined using the equation:
| (18) |
where is the true electron density of a rod, which is provided in the Catphan©600 phantom’s user manual, and is the mean value of measured electron density inside the rod. The accuracy of our method as compared to that achieved without noise suppression was assessed using the root-mean-square (RMS) of the E(%) of all the rods.
The head phantom was used for comprehensive evaluations of different methods on an object with complicated structures. The head phantom is composed of epoxy mimicking soft tissue and a calcium compound mimicking bone. Note that, the calcium compound has a spatially varying density, producing relatively large entropy in the proposed data processing even if image noise is low. The calcium compound (“bone”) and epoxy (“tissue”) were chosen as basis materials.
In the presented DECT results, errors in material decomposition stem from sources including beam-hardening effects on the CT images and the proposed signal processing. In this work, we focus our research on noise suppression in DECT material decomposition. Beam-hardening correction is therefore considered beyond our scope and is not implemented on the resultant images. The results obtained by direct decomposition via Eqn. (3) with no noise suppression are used as the ground truth in our investigations on decomposition accuracy of the IDEM algorithm.
III. Results
A. Catphan Study on Spatial Resolution and NPS
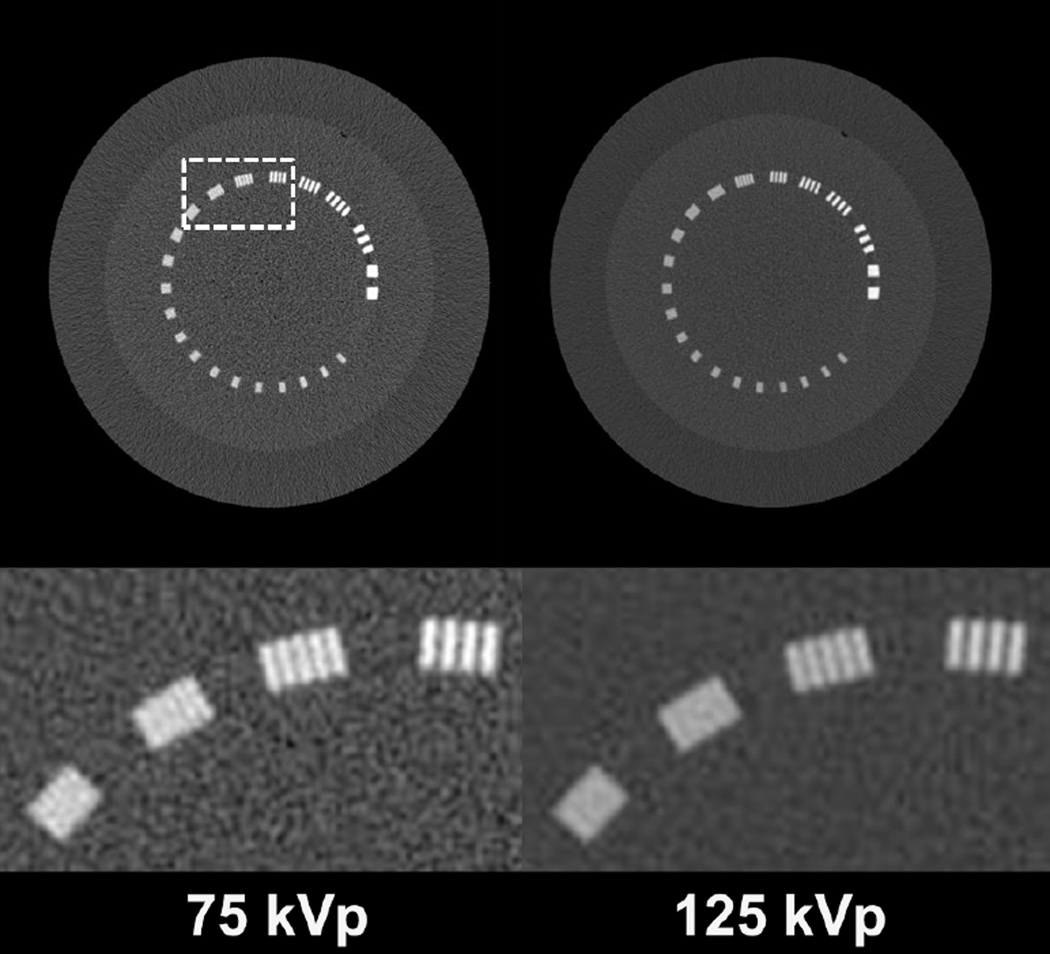
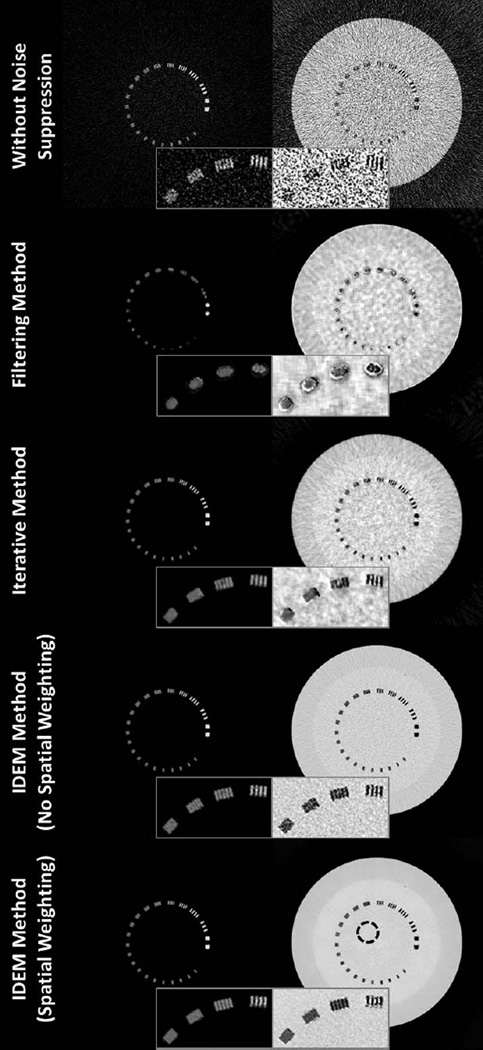
Fig. 5 shows the 75 kVp and 125 kVp CT images of the line-pair slice of Catphan©600 phantom. The decomposed images using different methods are shown in Fig. 6. As indicated by Eqn. (3), since the CT images and the elements of the decomposition matrix have the same units, the decomposed images are unitless density maps of the basis materials. Direct decomposition via Eqn. (3) results in severe noise amplification, as seen in the first row of Fig. 6. SVD on the inverse of the decomposition matrix estimates the angle of the optimal axis for noise suppression to be 73.13°. The proposed entropy minimization refines this value to 72.24°. All three methods, including the filtering method [35], the iterative method [30], and the IDEM algorithms, i.e., with and without spatial weighting (SW and NSW, respectively), effectively reduce noise on the decomposed images. Table I summarizes the mean pixel values and noise STDs of each basis material image within the ROI depicted by the dashed circle in Fig. 6. For a fair comparison of performance on spatial resolution, we tune the algorithm parameters such that all the methods achieve similar levels of noise suppression, with reduction of noise STD on both “bone” and “tissue” images by a factor of around 8.5. By inspecting the line-pair images, especially the zoom-in images contained in Figs. 5 and 6, we conclude that the proposed entropy minimization based method (both with and without spatial weighting) achieves the best performance on preservation of spatial resolution in both decomposed images. The spatial resolution of the decomposed image via the IDEM method is close to that of the initial CT images.
Fig. 5.
Low and high energy CT images of the line-pair slice of Catphan©600 phantom. Zoom-in images of the line pairs are shown in the second row, with spatial frequencies from 5 to 8 line pairs/cm, moving from right to left. The dashed box in the top left image indicates the location where the zoom-in images are taken. Display window: [−500 2500] HU.
Fig. 6.
Decomposed images of the line-pair slice of Catphan©600 phantom. Within each image set, the “bone” image precedes the “tissue” image. The inserts are zoom-in images of line pairs with spatial frequencies from 5 to 8 line pairs/cm. In the bottom-right image, the dashed circle indicates the ROI used for the mean and noise STD calculations shown in Table I. The tuning parameters of the IDEM algorithm, (β,δ), are set to (1.27,9.5) when spatial weighting is not implemented and (1.32, 11.3) with spatial weighting employed. Display windows are [0.1 1.2].
TABLE I.
Mean and STD within the ROI (indicated by the dashed circle in Fig. 6) of Catphan© line pair basis material images.
| “Bone” Image | “Tissue” Image | |
|---|---|---|
| Without Noise Suppression | −0.002 ± 0.3 | 1.00 ± 0.8 |
| Filtering Method | −0.004 ± 0.04 | 1.01 ± 0.1 |
| Iterative Method | −0.004 ± 0.04 | 1.01 ± 0.09 |
| IDEM Method (NSW) | 0.003 ± 0.04 | 0.99 ± 0.09 |
| IDEM Method (SW) | −0.002 ± 0.04 | 1.00 ± 0.09 |
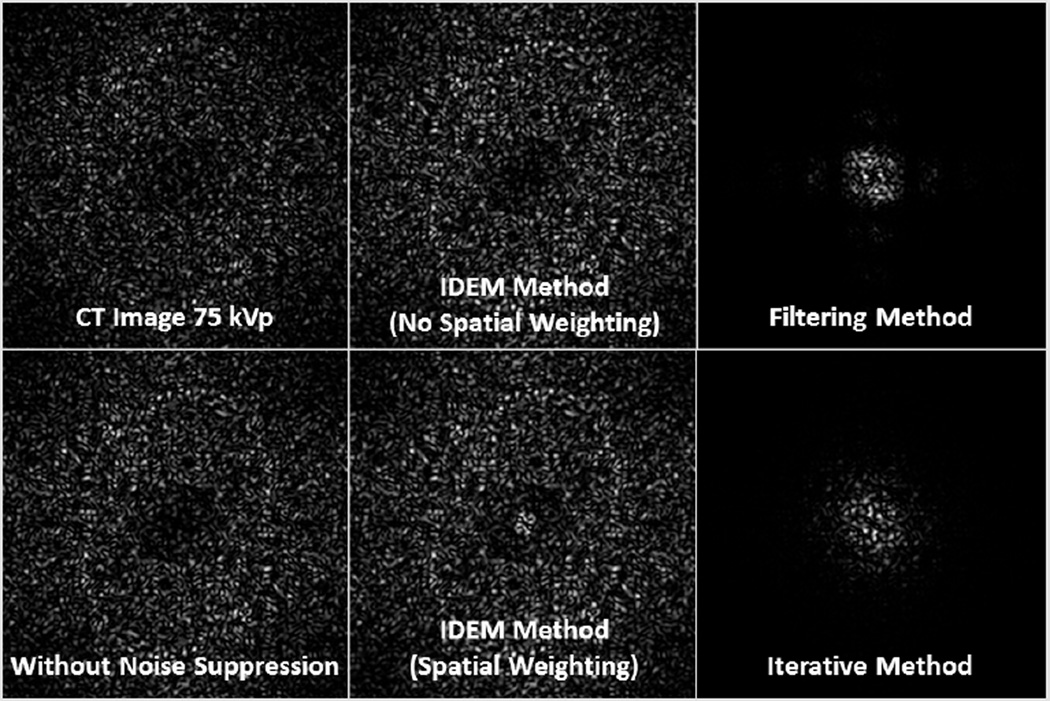
It is worth noting that, although the decomposed images produced by the different noise suppression algorithms have approximately the same noise STD, the image quality differs greatly. This phenomenon is due to different noise correlation characteristics in these images. Fig. 7 shows the NPS measured within an ROI of 100 by 100 pixels centered in the CT and “tissue” images. It is seen that decomposition without noise suppression and the IDEM method without spatial weighting both maintain the overall structure of NPS in the original CT image. The filtering method and the iterative method, however, preferentially suppress high frequency noise, which alters the texture of the decomposed images. Similar performance on NPS is expected with other existing methods, as long as they suppress noise by reducing spatial variations of neighboring signals. When the IDEM method uses spatial weighting, the same type of NPS degradation appears (i.e., increase of NPS signals in the low-frequency region). The overall NPS performance, however, is still superior to those of the filtering or iterative methods as shown in Fig. 7.
Fig. 7.
Measured NPS on the 75 kVp CT image and the “tissue” images generated by different algorithms. Zero frequency is at the center of NPS images. Each NPS was produced from an ROI of 100 by 100 pixels centered in the respective image. The images are displayed with a window of [min max].
B. Catphan Study on Electron Density Accuracy
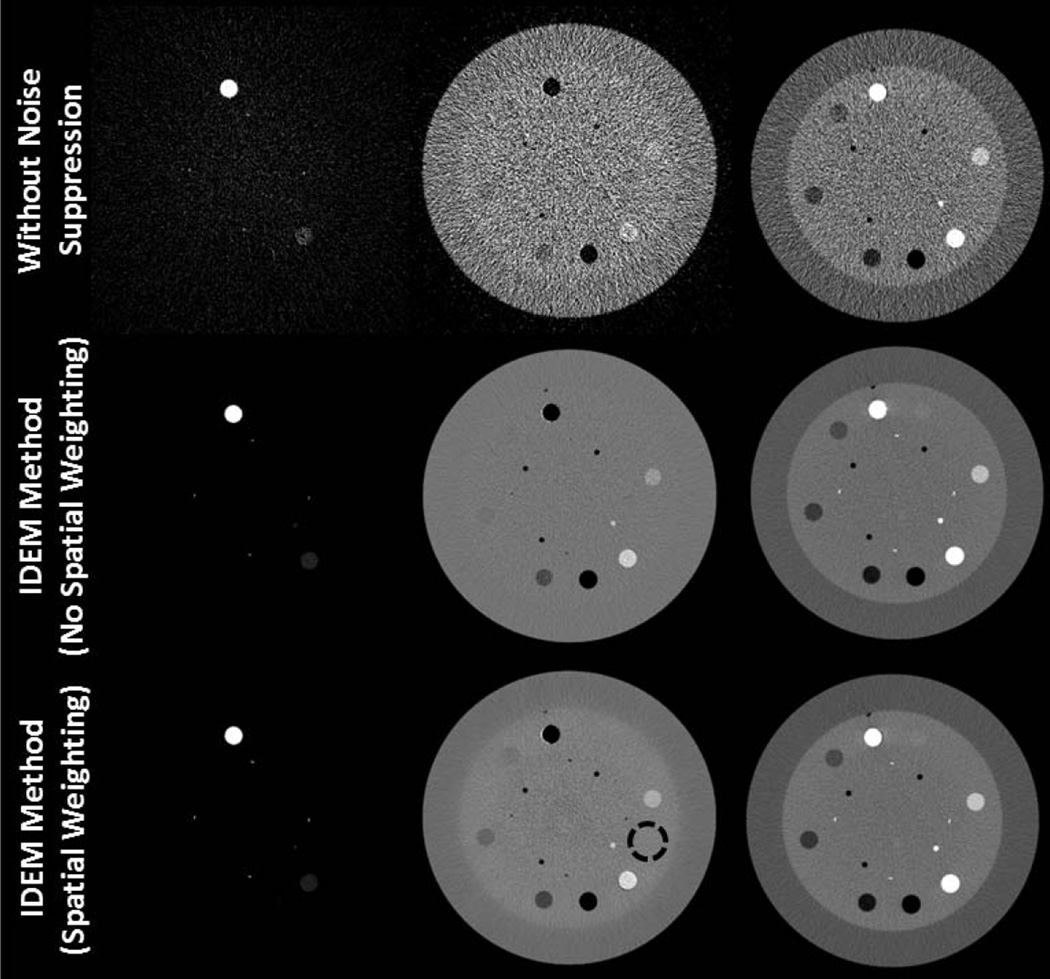
In this study, we aim to investigate possible adverse effects of the IDEM method on decomposition accuracy. Fig. 1a shows the low and high energy CT images from a slice of Catphan©600 phantom that contains several contrast rods. Using these images, we perform material decomposition via Eqn. (3) with no noise suppression and the IDEM method. The decomposed images are shown in Fig. 8. For these results, the proposed search algorithm for minimum entropy refines the angle of the optimal axis for noise suppression obtained through SVD from 73.13° to 72.21°. Algorithm parameters are tuned for strong noise suppression with noise STD reduction by a factor of around 13 on decomposed images. Fine structures are still well preserved in the images obtained by the proposed noise suppression. By applying Eqn. (17), electron densities are calculated from the decomposed images, generating the images shown in the third column of Fig. 8. The measured electron densities for different contrast rod materials and the RMS of the average percent errors for different materials are summarized in Table II. An RMS error of 1.61% is observed on the results with direct decomposition and no noise suppression, mainly due to the uncorrected beam hardening artifacts in the CT images and possibly limitations of a linear DECT approach to electron density measurements. The IDEM method introduces an extra small bias of 1.16% and 0.38% when implemented without and with spatial weighting, respectively. These results indicate that our method substantially reduces the noise in decomposed images with limited effect on decomposition accuracy and that the inclusion of spatial weighting reduces most bias errors. It is worth emphasizing that, to fully investigate the capability of the IDEM algorithm on noise suppression, we have tuned algorithm parameters for very strong noise suppression. If less strong noise suppression is implemented, the bias from our algorithm is expected to decrease.
Fig. 8.
Decomposed and electron density images of the contrast-rod slice of the Catphan©600 phantom. The first, second, and third columns are “bone,” “tissue,” and electron density images, respectively. In the “tissue” image of the last row, the dashed circle indicates the ROI used for noise STD calculations. The tuning parameters of the IDEM algorithm, (β,δ), are set to (0.57, 15.0) when spatial weighting is not implemented and (0.80, 14.7) with spatial weighting employed. Display windows are [0.1 0.7] for the bone images, [0.6 1.4] for the tissue images, and [2.75 5] × 1023 e/cm3 for the electron density images.
TABLE II.
Electron density (1023 e/cm3) for Catphan© contrast rods. The last column is the root-mean-square of material percent errors.
| Teflon | PMP | LDPE | Polystyrene | Aluminum | Acrylic | Delrin | RMS of Percent Errors |
|
|---|---|---|---|---|---|---|---|---|
| Actual Electron Density | 6.24 | 2.85 | 3.16 | 3.34 | 7.83 | 3.83 | 4.56 | |
| Without Noise Suppression | 6.04 ± 0.8 | 2.89 ± 0.6 | 3.19 ± 0.6 | 3.38 ± 0.7 | 7.87 ± 0.9 | 3.84 ± 0.7 | 4.49 ± 0.6 | 1.61 ± 16.15% |
| IDEM Method (NSW) | 5.99 ± 0.2 | 2.92 ± 0.2 | 3.25 ± 0.1 | 3.40 ± 0.1 | 7.95 ± 0.2 | 3.78 ± 0.1 | 4.38 ± 0.2 | 2.77 ± 3.28% |
| IDEM Method (SW) | 6.03 ± 0.2 | 2.89 ± 0.1 | 3.21 ± 0.2 | 3.40 ± 0.1 | 7.92 ± 0.2 | 3.81 ± 0.1 | 4.45 ± 0.1 | 1.99 ± 2.78% |
C. Anthropomorphic Head Phantom Study
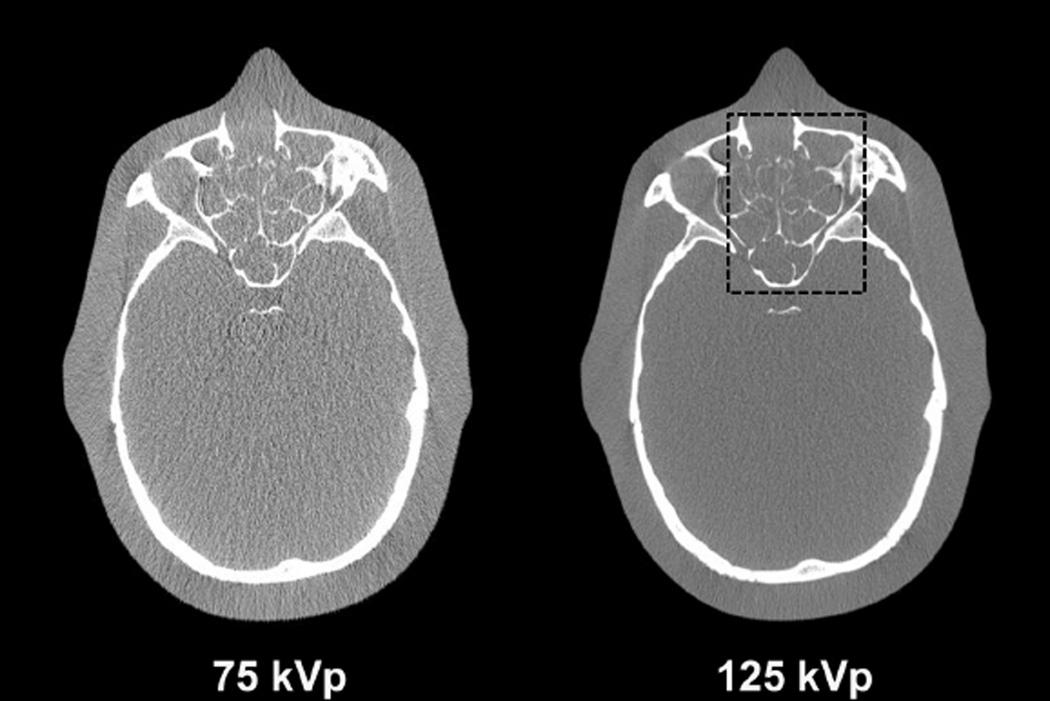
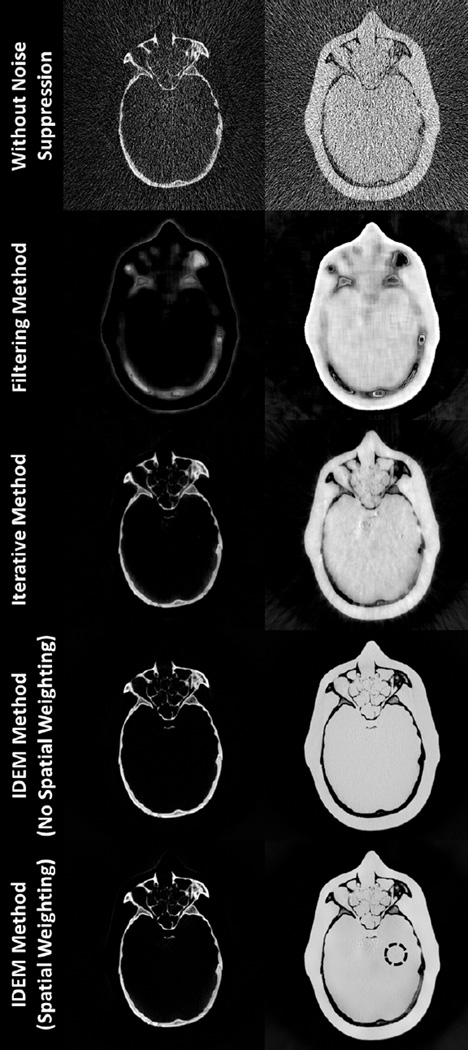
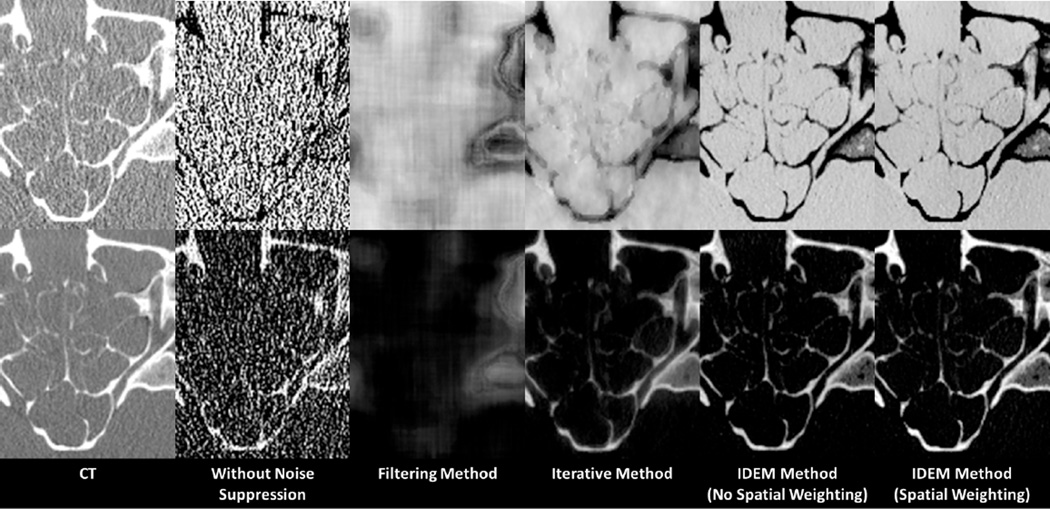
The CT images and the decomposed images of the anthropomorphic head phantom are shown in Figs. 9 and 10, respectively. Prior to noise suppression, the IDEM method refines the angle of the optimal axis from 67.40° to 66.52°. Table III summarizes the mean pixel values and noise STDs within an ROI (indicated by the dashed circle in Fig. 10) of the decomposed images. Once again, we tune the algorithm parameters so that all the methods achieve similar levels of noise suppression. Method performances similar to those in the Catphan©600 studies are observed in the image comparison. All three methods reduce the average noise STD by a factor of about 24 on the decomposed images. The entropy minimization based methods best preserve the image spatial resolution, which is obvious on the image comparison of sinus area shown in Fig. 11. The fine, intricate structures shown in the initial CT images are still clearly differentiable on the images obtained by the IDEM method, while other approaches generate image blur. Furthermore, since our method has less effect on the image NPS, the resultant image quality appears more natural. The images obtained by other methods contain noise artifacts due to the increased noise correlation between neighboring pixels. By comparing the results with and without the proposed noise suppression in Table III, we find that the IDEM algorithm with no spatial weighting introduces small bias on the decomposed material images and this small bias is effectively removed by the proposed spatial weighting scheme. In Fig. 10, it is interesting to note that the reduced image bias achieved by spatial weighting causes the images to match more closely the mean values of the images without noise suppression, which contain non-uniform beam hardening artifacts. As a result, the decomposed material images by the IDEM method with spatial weighting appear less uniform than those without spatial weighting.
Fig. 9.
Low and high energy CT images of the anthropomorphic head phantom. The dashed box in the 125 kVp image indicates the location of the zoom-in images shown in Fig. 11 relative to the complete image. Display windows are [−500 1000] HU.
Fig. 10.
Decomposed images of the anthropomorphic head phantom. Within each image set, the “bone” image precedes “tissue” image. In the bottom-right image, the dashed circle indicates the location of the ROI used for mean and noise STD calculations. The tuning parameters of the IDEM algorithm, (β,δ), are set to (0.72, 28.1) when spatial weighting is not implemented and (1.00, 27.2) with spatial weighting employed. Display windows are [0.01 1.4].
TABLE III.
Mean and STD values within the ROI (indicated by the dashed circle in Fig. 10) of the decomposed images on the anthropomorphic head phantom.
| “Bone” Image | “Tissue” Image | |
|---|---|---|
| Without Noise Suppression | 0.00 ± 0.6 | 1.00 ± 2 |
| Filtering Method | −0.04 ± 0.03 | 1.10 ± 0.06 |
| Iterative Method | −0.03 ± 0.03 | 1.07 ± 0.05 |
| IDEM Method (NSW) | −0.02 ± 0.04 | 1.05 ± 0.04 |
| IDEM Method (SW) | 0.00 ± 0.04 | 1.00 ± 0.04 |
Fig. 11.
Zoom-in images of the anthropomorphic head phantom in the area indicated by the dashed box in Fig 9. The top-left and bottom-left images are 75 kVp and 125 kVp CT images, respectively. Within each set of decomposed images, the “tissue” image is shown in the top row, and the “bone” image is shown in the bottom row. CT images have a display window of [−500 1000] HU. Basis material images have a display window of [0.01 1.4].
IV. Discussion and Conclusions
Noise amplification has been a well-known issue of DECT since its invention [18], [19]. In this work, we propose a new algorithm for improving DECT image quality by reducing the noise on decomposed images, namely the IDEM method. Our approach is distinct from other existing methods in that it processes decomposed images by minimizing the signal entropy, instead of reducing the signal variation between neighboring pixels. As a consequence, image spatial resolution is preserved with limited effect on NPS even if strong noise suppression is applied. This appealing feature is supported by the presented phantom studies.
More evaluation studies and algorithmic improvements are of high interest in our future research to make the entropy minimization based method practical in clinical rooms. The IDEM method achieves material differentiation in a 2D decomposition space by using a brute-force searching scheme to orient an axis such that the projection of all data points onto that axis has minimal entropy. If the step size of the search is too large or too few histogram bins are used in the entropy calculation, the algorithm could potentially find a sub-optimal angle. In addition to further optimizing the IDEM algorithm parameters for method stability on various DECT data, we will look into other entropy minimization algorithms for improved computational efficiency [41]. Future work will also include extensive investigations on material decomposition accuracy which go beyond the electron density calculations presented in this paper. Since the experimental setup used in this paper is different from that of a clinical DECT scanner, we will implent our algorithm on data acquired from a clinical scanner to assess the IDEM method’s performance on specific clinical tasks.
In the presented studies, we used the same parameter values for noise suppression at different pixel locations, which assumes that noise is stationary on CT images. We will improve the algorithm by using different algorithm parameters for different pixels based on the estimated variance of non-stationary noise. The noise variance maps of the initial CT images can be estimated by existing algorithms, for example, an FBP-based algorithm previously developed by our group [42]. When applying the entropy minimization based method on volumetric DECT data, the computation time of the IDEM method greatly prolongs. Since the entropy minimization algorithm processes each image pixel/voxel independently, a structure compatible for parallel computing, we will implement the algorithm on a graphics-processing-unit (GPU) based workstation for acceleration [43].
The IDEM method has promise to break the tradeoff between noise suppression and spatial resolution preservation by exploring the entropy property of measured signals. Futhermore, the method is applied on decomposed material images at the post-processing stage, with a flexible framework. It can be combined with existing methods for further enhanced noise suppression. The proposed principle may shed light on designs of data processing algorithms for advanced CT imaging that acquire spectral information of the scanned object, including multi-energy CT [44] and energy-resolved CT [45], [46]. In these future investigations, it will be important to remember that the IDEM method relies implicitly upon the assumption that the signals after basis material decomposition, if containing no noise, have a small number of different levels, which implies small entropy. In situations where this assumption becomes invalid, the IDEM method is expected to have limited efficacy. For example, for DECT decomposition in the projection domain, we expect the IDEM method to fail because projection images have signal values with a continuous distribution and thus large entropy.
In conclusion, we propose a novel method utilizing entropy minimization within a 2D transformation space for noise suppression on decomposed images of DECT, i.e., IDEM. Distinct from other noise suppression techniques, the IDEM method does not estimate and suppress noise based on spatial variations of signals and thus has potential to better preserve image spatial resolution and NPS. In Catphan©600 studies, the IDEM method reduces noise STD on decomposed images by a factor of around 13 while limiting the induced error in electron density calculations to 1.16% and 0.38% without and with spatial weighting, respectively. The method reduces the noise STDs on decomposed images of an anthropomorphic head phantom by a factor of at least one order of magnitude. In all presented studies, the proposed method retains greater spatial resolution than a conventional filtering method and a recently developed iterative method at the same level of noise suppression, while largely preserving the NPS of the initial CT images.
Acknowledgment
The authors would like to thank Dr. Tianye Niu for discussion at an early stage of this project.
This work was supported in part by the National Institutes of Health (NIH) under Grant Number R21 EB012700.
References
- 1.Johnson TRC, Fink C, Schönberg SO, Reiser MF, editors. Dual Energy CT in Clinical Practice. Heidelberg, Germany: Springer-Verlag Berlin Heidelberg; 2011. [Google Scholar]
- 2.Johnson TRC, Krauss B, Sedlmair M, Grasruck M, Bruder H, Morhard D, Fink C, Weckbach S, Lenhard M, Schmidt B, Flohr T, Reiser MF, Becker CR. Material differentiation by dual energy CT: Initial experience. Eur. Radiol. 2007;17(6):1510–1517. doi: 10.1007/s00330-006-0517-6. [DOI] [PubMed] [Google Scholar]
- 3.Deng K, Liu C, Ma R, Sun C, Wang XM, Ma ZT, Sun XL. Clinical evaluation of dual-energy bone removal in CT angiography of the head and neck: comparison with conventional bone-subtraction CT angiography. Clin. Radiol. 2009;64(5):534–541. doi: 10.1016/j.crad.2009.01.007. [DOI] [PubMed] [Google Scholar]
- 4.Li Y, Shi G, Wang S, Wang S, Wu R. Iodine quantification with dual-energy CT: Phantom study and preliminary experience with VX2 residual tumour in rabbits after radiofrequency ablation. Br. J. Radiol. 2013;86(029):143–151. doi: 10.1259/bjr.20130143. [DOI] [PMC free article] [PubMed] [Google Scholar]
- 5.Chandarana H, Megibow AJ, Cohen BA, Srinivasan R, Kim D, Leidecker C, Macari M. Iodine quantification with dual-energy CT: phantom study and preliminary experience with renal masses. Am. J. Roentgenol. 2011;196(6):W693–W700. doi: 10.2214/AJR.10.5541. [DOI] [PubMed] [Google Scholar]
- 6.Primak AN, Fletcher JG, Vrtiska TJ, Dzyubak OP, Lieske JC, Jackson ME, Williams JC, Jr, McCollough CH. Noninvasive differentiation of uric acid versus non-uric acid kidney stones using dual energy CT. Acad. Radiol. 2007;14(12):1441–1447. doi: 10.1016/j.acra.2007.09.016. [DOI] [PMC free article] [PubMed] [Google Scholar]
- 7.Graser A, Johnson TR, Bader M, Staehler M, Haseke N, Nikolaou K, Reiser MF, Stief CG, Becker CR. Dual energy CT characterization of urinary calculi: initial in vitro and clinical experience. Invest. Radiol. 2008;43(2):112–119. doi: 10.1097/RLI.0b013e318157a144. [DOI] [PubMed] [Google Scholar]
- 8.Eiber M, Holzapfel K, Frimberger M, Straub M, Schneider H, Rummeny EJ, Dobritz M, Huber A. Targeted dual-energy single-source CT for characterisation of urinary calculi: experimental and clinical experience. Eur. Radiol. 2012;22(1):251–258. doi: 10.1007/s00330-011-2231-2. [DOI] [PubMed] [Google Scholar]
- 9.Yu L, Christner JA, Leng S, Wang J, Fletcher JG, McCollough CH. Virtual monochromatic imaging in dual-source dual-energy CT: raditaion dose and image quality. Med. Phys. 2011;38(12):6371–6379. doi: 10.1118/1.3658568. [DOI] [PMC free article] [PubMed] [Google Scholar]
- 10.Yuan R, Shuman WP, Earls JP, Hague CJ, Mumtaz HA, Scott-Moncrieff A, Elli JD, Mayo JR, Leipsic JA. Reduced iodine load at CT pulmonary angiography with dual-energy monochromatic imaging: comparison with standard CT pulmonary angiographya prospective randomized trial. Radiology. 2012;262(1):290–297. doi: 10.1148/radiol.11110648. [DOI] [PubMed] [Google Scholar]
- 11.Takahashi N, Hartman RP, Vrtiska TJ, Kawashima A, Primak AN, Dzyubak OP, Mandrekar JN, Fletcher JG, McCollough CH. Dual-energy CT iodine-subtraction virtual unenhanced technique to detect urinary stones in an iodine-filled collecting system: A phantom study. Am. J. Roentgenol. 2008;190(5):1169–1173. doi: 10.2214/AJR.07.3154. [DOI] [PMC free article] [PubMed] [Google Scholar]
- 12.Zhang LJ, Peng J, Wu SY, Wang ZJ, Wu XS, Zhou CS, Ji XM, Lu GM. Liver virtual non-enhanced CT with dual-source, dual energy CT: A preliminary study. Eur. Radiol. 2010;20(9):22572264. doi: 10.1007/s00330-010-1778-7. [DOI] [PubMed] [Google Scholar]
- 13.Sommer CM, Schwarzwaelder CB, Stiller W, Schindera ST, Stampfl U, Bellemann N, Holzschuh M, Schmidt J, Weitz J, Grenacher L, Kauczor HU, Radeleff BA. Iodine removal in intravenous dual-energy CT-cholangiography: is virtual non-enhanced imaging effective to replace true non-enhanced imaging? Eur. J. Radiol. 2012;81(4):692–699. doi: 10.1016/j.ejrad.2011.01.087. [DOI] [PubMed] [Google Scholar]
- 14.Ruzsics B, Lee H, Zwerner PL, Gebregziabher M, Costello P, Schoepf UJ. Dual-energy CT of the heart for diagnosing coronary artery stenosis and myocardial ischemia-initial experience. Eur. Radiol. 2008;18(11):2414–2424. doi: 10.1007/s00330-008-1022-x. [DOI] [PubMed] [Google Scholar]
- 15.Lu GM, Zhao Y, Zhang LJ, Schoepf UJ. Dual-energy CT of the lung. Am. J. Roentgenol. 2012;199(11):S40–S53. doi: 10.2214/AJR.12.9112. [DOI] [PubMed] [Google Scholar]
- 16.Zhang LJ, Wu SY, Niu JB, Zhang ZL, Wang HZ, Zhao YE, Chai X, Zhou CS, Lu GM. Dual-energy CT angiography in the evaluation of intracranial aneurysms: Image quality, radiation dose, and comparison with 3D rotational digital subtraction angiography. Am. J. Roentgenol. 2010;194(1):23–30. doi: 10.2214/AJR.08.2290. [DOI] [PubMed] [Google Scholar]
- 17.Postma AA, Hofman PAM, Stadler AAR, van Oostenbrugge RJ, Tijssen MPM, Wildberger JE. Dual-energy CT of the brain and intracranial vessesls. Am. J. Roentgenol. 2012;199(11):S26–S33. doi: 10.2214/AJR.12.9115. [DOI] [PubMed] [Google Scholar]
- 18.Kalender WA, Klotz E, Kostaridou L. An algorithm for noise suppression in dual energy ct material density images. IEEE Trans. Med. Imaging. 1988 Sept.7(3):218–224. doi: 10.1109/42.7785. [DOI] [PubMed] [Google Scholar]
- 19.Macovski A, Nishimura DG, Doost-Hoseini A, Brody WR. Measurement-dependent filtering: a novel approach to improved SNR. IEEE Trans. Med. Imaging. 1983 Sept.2(3):122–127. doi: 10.1109/TMI.1983.4307625. [DOI] [PubMed] [Google Scholar]
- 20.Warp RJ, Dobbins JT. Quantitative evaluation of noise reduction strategies in dual-energy imaging. Med. Phys. 2003;30(2):190–198. doi: 10.1118/1.1538232. [DOI] [PubMed] [Google Scholar]
- 21.Balda M, Heismann B, Hornegger J. Value-based noise reduction for low-dose dual-energy computed tomography. MICCAI 2010. 2010;6363:547–554. doi: 10.1007/978-3-642-15711-0_68. part III. [DOI] [PubMed] [Google Scholar]
- 22.Alvarez RE, Macovski A. Energy-selective reconstruction in x-ray computerized tomography. Phys. Med. Biol. 1976;21(5):733–744. doi: 10.1088/0031-9155/21/5/002. [DOI] [PubMed] [Google Scholar]
- 23.Riederer SJ, Mistretta CA. Selective iodine imaging using Kedge energies in computerized xray tomography. Med. Phys. 1977;4(6):474–481. doi: 10.1118/1.594357. [DOI] [PubMed] [Google Scholar]
- 24.Lehmann LA, Alvarez RE, Macovski A, Brody WR, Pelc NJ, Riederer SJ, Hall AL. Generalized image combinations in dual KVP digital radiography. Med. Phys. 1981;8(5):659–667. doi: 10.1118/1.595025. [DOI] [PubMed] [Google Scholar]
- 25.Sidky EY, Zou Y, Pan XC. Impact of polychromatic x-ray sources on helical, cone-beam computed tomography and dual-enregy methods. Phys. Med. Biol. 2004;49(11):2293–2303. doi: 10.1088/0031-9155/49/11/012. [DOI] [PubMed] [Google Scholar]
- 26.Maass C, Baer M, Kachelriess M. Image-based dual energy CT using optimized precorrection functions: a practical new approach of material decomposition in image domain. Med. Phys. 2009;36(8):3818–3829. doi: 10.1118/1.3157235. [DOI] [PubMed] [Google Scholar]
- 27.Sukovic P, Clinthorne NH. Penalized weighted least-squares image reconstruction for dual energy x-ray transmission tomography. IEEE Trans. Med. Imaging. 2000 Nov.19(11):1075–1081. doi: 10.1109/42.896783. [DOI] [PubMed] [Google Scholar]
- 28.Maass C, Meyer E, Kachelriess M. Exact dual energy material decomposition from inconsistent rays (MDIR) Med. Phys. 2011;38(2):691–700. doi: 10.1118/1.3533686. [DOI] [PubMed] [Google Scholar]
- 29.Dong X, Niu T, Zhu L. Combined iterative reconstruction and image-domain decomposition for dual energy CT using total-variation regularization. Med. Phys. 2014;41(5):051909. doi: 10.1118/1.4870375. [DOI] [PubMed] [Google Scholar]
- 30.Niu T, Dong X, Petrongolo M. Iterative image-domain decomposition for dual-energy CT. Med. Phys. 2014;41(4):041901. doi: 10.1118/1.4866386. [DOI] [PubMed] [Google Scholar]
- 31.Niu T, Ye X, Fruhauf Q, Petrongolo M, Zhu L. Accelerated barrier optimization compressed sensing (ABOCS) for CT reconstruction with improved convergence. Phys. Med. Biol. 2014;59(7):1801–1814. doi: 10.1088/0031-9155/59/7/1801. [DOI] [PMC free article] [PubMed] [Google Scholar]
- 32.Noel PB, Fingerle AA, Renger B, Münsel D, Rummeny EJ, Dobritz M. Initial performance characterization of a clinical noise-suppressing reconstruction algorithm for MDCT. Am. J. Roentgenol. 2011;197(6):1404–1409. doi: 10.2214/AJR.11.6907. [DOI] [PubMed] [Google Scholar]
- 33.Boedeker KL, Cooper VN, McNitt-Gray MF. Application of the noise power spectrum in modern diagnostic MDCT: part I. Measurement of noise power spectra and noise equivalent quanta. Phys. Med. Biol. 2007;52(14):4027–4046. doi: 10.1088/0031-9155/52/14/002. [DOI] [PubMed] [Google Scholar]
- 34.Boedeker KL, McNitt-Gray MF. Application of the noise power spectrum in modern diagnostic MDCT: part II. Noise power spectra and signal to noise. Phys. Med. Biol. 2007;52(14):4047–4061. doi: 10.1088/0031-9155/52/14/003. [DOI] [PubMed] [Google Scholar]
- 35.Rutherford RA, Pullan BR, Isherwood I. Measurement of effective atomic number and electron-density using an EMI scanner. Neuroradiology. 1976;11(1):15–21. doi: 10.1007/BF00327253. [DOI] [PubMed] [Google Scholar]
- 36.Buades A, Coll B, Morel JM. A review of image denoising algorithms, with a new one. Multiscale Model. Simul. 2005;4(2):490–530. [Google Scholar]
- 37.Niu T, Zhu L. Scatter correction for full-fan volumetric CT using a stationary beam blocker in a single full scan. Med. Phys. 2011;38(11):6027–6038. doi: 10.1118/1.3651619. [DOI] [PMC free article] [PubMed] [Google Scholar]
- 38.Lauzier PT, Chen GH. Characterization of statistical prior image constrained compressed sensing. I. Applications to time-resolved contrast-enhanced CT. Med. Phys. 2012;39(10):5930–5948. doi: 10.1118/1.4748323. [DOI] [PMC free article] [PubMed] [Google Scholar]
- 39.Siewerdsen JH, Cunnigham IA, Jaffray DA. A framework for noise-power spectrum analysis of multidimensional images. Med. Phys. 2002;29(11):2655–2671. doi: 10.1118/1.1513158. [DOI] [PubMed] [Google Scholar]
- 40.Baek J, Pelc NJ. The noise power spectrum in CT with direct fan beam reconstruction. Med. Phys. 2010;37(5):2074–2081. doi: 10.1118/1.3378673. [DOI] [PMC free article] [PubMed] [Google Scholar]
- 41.Finlayson GD, Drew MS, Lu C. Entropy Minimization for Shadow Removal. Int. J. Comput. Vis. 2009;85(1):35–57. [Google Scholar]
- 42.Zhu L, StarLack J. A practical reconstruction algorithm for CT noise variance maps using FBP reconstruction. Proc. SPIE. 2007;6510:U1074–U1081. [Google Scholar]
- 43.Niu T, Zhu L. Accelerated barrier optimization compressed sensing (ABOCS) reconstruction for cone-beam CT: Phantom studies. Med. Phys. 2012;39(7):4588–4598. doi: 10.1118/1.4729837. [DOI] [PMC free article] [PubMed] [Google Scholar]
- 44.Sukovic P, Clinthorne NH. Basis material decomposition using triple-energy x-ray computed tomography. Proc. 16th IEEE Instrumentation and Measurement Technology Conf. 1999;3:1615–1618. [Google Scholar]
- 45.Alvarez RE. Dimensionality and noise in energy selective x-ray imaging. Med. Phys. 2013;40(11):111909. doi: 10.1118/1.4824057. [DOI] [PMC free article] [PubMed] [Google Scholar]
- 46.Taguchi K, Iwanczyk JS. Vision 20/20: single photon counting x-ray detectors in medical imaging. Med. Phys. 2013;40(10):100901. doi: 10.1118/1.4820371. [DOI] [PMC free article] [PubMed] [Google Scholar]


