

Abstract
We present experimental demonstration that weak excluded volume effects arise in DNA nanochannel confinement. In particular, by performing measurements of the variance in chain extension as a function of nanochannel dimension for effective channel size ranging from 305 nm to 453 nm, we show that the scaling of the variance in extension with channel size rejects the de Gennes scaling δ2X ~ D1/3 in favor of δ2X ~ D0 using uncertainty at the 95% confidence level. We also show how simulations and confinement spectroscopy can be combined to reduce molecular weight dispersity effects arising from shearing, photocleavage, and nonuniform staining of DNA.
Determining the equilibrium conformation of nanochannel-confined DNA has attracted substantial attention as a fundamental problem in polymer physics1 connected to an emerging technology for genomics.2–7 Initially, it was proposed8 that the de Gennes blob theory for weak confinement9 and Odijk’s deflection segment theory for strong confinement10 provided a complete description of the thermodynamics of a semiflexible chain of persistence length lp confined in a channel of size D. Intense simulation and theoretical efforts over the past few years11–16 suggest that excluded volume in confinement plays a more subtle role than previously thought. In particular, in addition to the classic de Gennes blob regime, an “extended de Gennes” regime has been postulated, holding for channel sizes , where w is the effective width of the polymer backbone. While both the theory of nanochannel-confined DNA11–18 and practical applications of the technology in genomics2–7 have advanced rapidly, the experimental evidence in support of the emerging theoretical framework is lacking. In this letter, we provide evidence in support of the weak excluded volume effects that form the physical basis for the extended de Gennes regime. In doing so, we also show how a detailed simulation combined with confinement spectroscopy can reduce molecular weight dispersity effects that are introduced into an otherwise monodisperse DNA sample due to shear,19 photocleavage,20,21 or heterogeneous staining.22
Classic de Gennes scaling theory suggests that a self-avoiding chain confined in a channel corresponds to a string of isometric blobs of diameter D (see Fig. 1a).1 Excluded-volume effects are strong, determining both the polymer physics within a blob (each blob is a self-avoiding coil obeying Flory statistics) and between blobs (self-exclusion interactions between blobs lead to their linear ordering, swelling the chain along the channel). In contrast, the extended de Gennes regime is characterized by weak excluded volume effects.14,15 In this regime, a chain of persistence length lp and width w, confined in a channel of size D, can be envisioned as a series of anisometric blobs11 of diameter D and length H ≌ (Dlp)2/3w−1/3 (see Fig. 1b).17 Excluded volume between blobs lead to swelling of the chain along the channel axis but the excluded volume interactions within a blob are marginal.14 The swelling along the channel axis leads to a fractional extension X/L
| (1) |
where X is the mean span of a polymer of contour length L.12,14,15 The prefactor comes from the theory by Werner and Mehlig, which maps the extended de Gennes regime onto a one-dimensional, weakly self-avoiding walk.15 The latter scaling is identical to that in the de Gennes regime9 and hence the moniker “extended” de Gennes.12 The weakness of the excluded volume interactions manifests itself in the variance in the fractional extension.11,12,14,15,24 Since the blobs themselves are at the crossover between real and ideal chains, the variance in the fractional extension is independent of the channel size,12,14,15,24
| (2) |
where again the prefactor comes from the theory of Werner and Mehlig.15 In contrast, in the classic de Gennes regime, δ2X ~ D1/3.8 Note that Eqs. 1 and 2 are expressed in terms of the persistence length, which leads to different numerical values than the equivalent expressions in terms of Kuhn length.15
Figure 1.
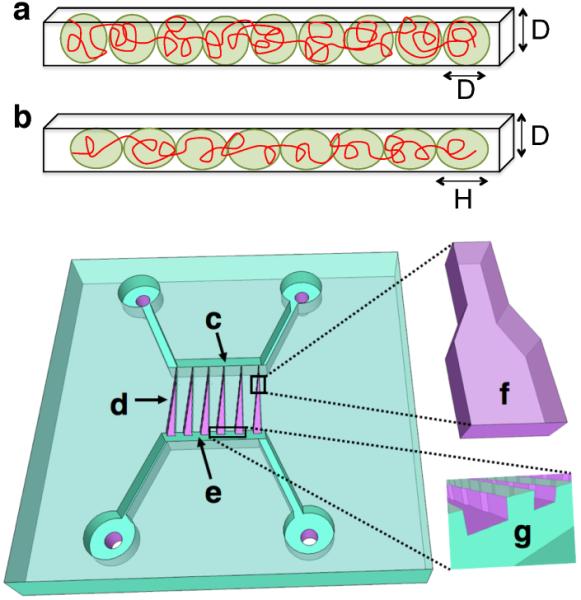
(a) In the classic de Gennes regime a confined self-avoiding chain corresponds to a string of isometric blobs. (b) In the extended de Gennes regime a confined and weakly self-avoiding chain corresponds to a string of anisometric blobs. (c-g) Schematic illustration of the confinement spectroscopy device. The device consists of two 1 μm deep and 50 μm wide microchannels (c,e), bridged by an array of nanofunnels (d). A single nanofunnel (f) has ten connected 300 nm deep and 45 μm long nanochannels; the width of the nanochannel varies from 350 nm to 750 nm in steps of 50 nm. The DNA are loaded in the nanochannel with pneumatic pressure across the intersection of the microchannel and the nanofunnel region (g). The detailed operation of this type of device is described elsewhere.23
Demonstrating the existence of weak excluded volume effects through the scaling δ2X ~ D0 in the range is a key step towards establishing the existence of an extended de Gennes regime. The experimental approach seems straightforward: make a series of channels in this size range, introduce DNA into these channels, and measure the variance in the chain extension. Unfortunately, molecular weight dispersity of the DNA represents a critical obstacle to obtaining accurate measurements of the scaling exponents and, even worse, the prefactors to the scaling laws. In many cases very large DNA molecules (sometimes on the order of megabases in size) are required to reach the long chain limit.13,25–27 While genomic DNA samples are monodisperse, such long DNA molecules are prone to shear breakage.19 Moreover, the DNA can photocleave during measurements.20 Heterogeneous staining22 can lead to differences in L due to variations in the increased contour length as a result of intercalation between molecules. In all of these cases, the associated uncertainty in L can lead to large uncertainties in the measurement of δ2X, thereby making the tests of the theories challenging.
We have developed an approach that combines equilibrium confinement spectroscopy23 with Pruned-Enriched Rosenbluth Method (PERM) simulations of a confined, discrete wormlike chain28 to reduce the effects of molecular weight dispersity. The nanochannel device, illustrated schematically in Fig. 1c-g, consists of a channel of depth D1 = 300 nm that cascades in discrete steps in width from D2 = 350 nm to D2 = 750 nm. It is thus similar to previous confinement spectroscopy devices with a continuous taper in D2,29 but the 45 μm long regions of constant width D2 allow us to make measurements at equilibrium.23 The buffer for our experiments has an ionic strength of 7.18 mM. Accounting for the effect of the anti-photobleaching agent β-mercaptoethanol at 6% v/v,30 theory predicts a persistence length of lp = 69 nm and effective width w = 19 nm,23,31,32 although the accuracy of this persistence length should be viewed in light of recent data suggesting a lower persistence length of DNA.33
Since our channels are rectangular, we use the effective channel width8,12,16
| (3) |
to map the results back to an equivalent square channel of size Deff + δ. The parameter δ is a wall-DNA depletion length that models the electrostatic interaction of the DNA with the walls.1 We estimate that δ ≈ w.12 Our effective channel sizes range from 305 nm to 453 nm, which spans much of the extended de Gennes regime; simulations by Dai et al.14 suggest that the lower bound of the extended de Gennes regime for our conditions is 276 nm and the upper bound is 562 nm. Most of our channel sizes are also below the upper limit D2 = 550 nm (assuming a prefactor of unity) where Werner and Mehlig16 predict that the channel anisotropy will affect measurements of the variance in chain extension for our value of D1,23 and we check the magnitude of the anisotropy effect via simulations. Additional information about the device fabrication and buffer conditions are provided in Supporting Information.
The key advantage of the equilibrium spectroscopy approach23 is that the same molecule can be studied in all the channel sizes at equilibrium, making it a single-molecule study in the true sense.34 In other words, time-domain measurements for some molecule i can be used to determine the ensemble average from an ergodic hypothesis, and repeating this measurement for different molecules provides information about the experimental uncertainty, much of which arises from a very conservative estimate of the error in the image analysis (see Supporting Information). The approach is identical to typical simulation approaches, where independent replicas (the different molecules) are used to assess the sampling errors in expectation values (the measurements from a single molecule). In our case, we first pneumatically load a T4 GT7-DNA molecule (166 kbp, Nippon Gene) from the microchannel into the D2 = 350 nm region and take n = 40 stroboscopic measurements of the span of that molecule with a minimum sampling interval of 5 seconds. Let us denote the jth measurements on molecule i as . The time lapse corresponds to a small value of the autocorrelation in the chain extension (see Supporting Information), which ensures that the are statistically independent. When we compute the average span for molecule i and its variance,
| (4) |
| (5) |
we assume that these values are estimates of the ensemble average, i.e., X ≈ Xi and δ2X ≈ δ2Xi. To obtain the values of Xi and δ2Xi at other channel sizes, we move the same molecule successively through each value of D2 and repeat the process. At the conclusion of this single-molecule experiment, we return the molecule to the D2 = 350 nm region and image it again to confirm that the extension of the molecule has not become significantly shorter due to photocleavage or shear cleavage. We performed this single-molecule protocol with 40 molecules, of which 29 did not shorten during the long measurement period. The end result is 1160 measurements of the chain extension at each channel size, blocked into 29 replicas for statistical averaging. The detailed criteria for rejecting fragmented molecules and additional information about the experimental protocol are provided in Supporting Information.
We found a broad distribution of extensions Xi when we binned the results in the 1 μm bins shown in Fig. 2a. To see if this wide distribution was a result of molecular weight dispersity, we took advantage of our ability to systematically move a given molecule between different values of the channel width. To simplify our analysis, we considered how the average of the extension of the wbin molecules within a given bin, , evolves as a function of Deff. Figure 2b shows the results for two representative bins; the data for the other bins are included as Supporting Information. Overall, it is clear that when we bin the molecules based on their extension for D2 = 350 nm, plots of Xbin as a function of the effective width Deff are parallel curves. Since we know that X ~ L for sufficiently long chains (see Supporting Information),27 we can conclude that the distribution in Fig. 2b results from molecular weight dispersity, most likely a combination of shear breakage and non-uniform staining (which leads to non-uniform extension due to intercalation).22
Figure 2.

(a) Probability distribution of average extension, Xi, for individual T4 DNA molecules from 40 uncorrelated measurements of their span for D2 = 350 nm. The bin size is 1 μm. The number above each bar is the value of the contour length in that bin, Lbin (μm), obtained by comparison of the extension to PERM simulations. Linear regression of Lbin to Xi gives a correlation coefficient R2 = 0.98. (b) Log-log plot of the average value of the extension, Xbin, for molecules that reside in two different bins (Xi = [15,16] μm in blue and Xi = [19,20] μm in red) as a function of effective channel size (□ symbols). To determine the corresponding molecular weight, we fit these curves to PERM simulations of the chain extension (× symbols) using the contour length as a free parameter. A plot similar to panel (b) for all of the bins is included as Supporting Information.
To compute the nominal contour length Lbin for those molecules in a given bin of Fig. 2a, we performed PERM simulations of a discrete wormlike chain in a rectangular channel for each value of D2. These simulations follow directly from our prior work,23 and a brief description is provided in the Supporting Information. Importantly, PERM provides data for the simulated extension, Xsim, in a given rectangular channel size as a function of simulated contour length, Lsim. For each channel, we ran our simulations out to approximately double the contour length of unstained T4 DNA, well beyond any possible effect due to intercalation.35,36 Then, for each bin in Fig. 2a, we determined the value of that minimized the sum of squared error in Xsim − Xbin over all the channel sizes and set . Figure 2b reports the result of this analysis for two bins, and the corresponding analysis for the other bins is included as Supporting Information. The data in Fig. 2b indicate that there is some disagreement between the simulation and experimental data. However, the Lbin values are linearly dependent on Xi to within 2% error. There may also be a systematic error in Lbin, but this will only affect the prefactor and not the exponent in the scaling law (see Supporting Information).
The ultimate result of our binning-and-simulation protocol are estimates for the contour length of molecules within each bin, which are reported in Fig. 2a. In what follows, we use the value of Lbin as the contour length Li for any molecule within that bin, thereby compensating for the effects of molecular weight dispersity by rescaling each molecule by its Li value. We are now in a position to determine the validity of Eq. 2 for the variance in chain extension, which is the key prediction arising from weak excluded volume effects in the extended de Gennes regime.
The independence of the variance in extension from channel size in Fig. 3 demonstrates that weak excluded volume effects are manifest for DNA in nanochannel confinement. This is the key result of this letter. We find experimentally that the variance in chain extension has the scaling , where the uncertainty in the exponent is at the 95% confidence level. We also did an alternate analysis, where we obtained the exponent for each molecule and then computed their average. This led to at the same confidence. Note that this alternate method provides the exponent but no information about the prefactor, since it does not require estimating L or lp. A hypothesis test at the 5% significance level rejects the hypothesis in favor of the hypothesis by both analysis methods. Our variance data agree to within 8% of the theoretical prefactor predicted by Werner and Mehlig and to within 16% of the PERM data. However, while we believe the agreement for the scaling exponent is robust to our data analysis method, the agreement for the prefactor must be viewed in light of the method to determine Lbin. A discussion of this subtle point is included in the Supporting Information. Moreover, the error estimates in Fig. 3 do not include uncertainties in L or lp. These sources of correlated error affect the prefactor, but do not affect the slope. Thus, it seems reasonable to conclude that the agreement for the prefactor is semi-quantitative.
Figure 3.
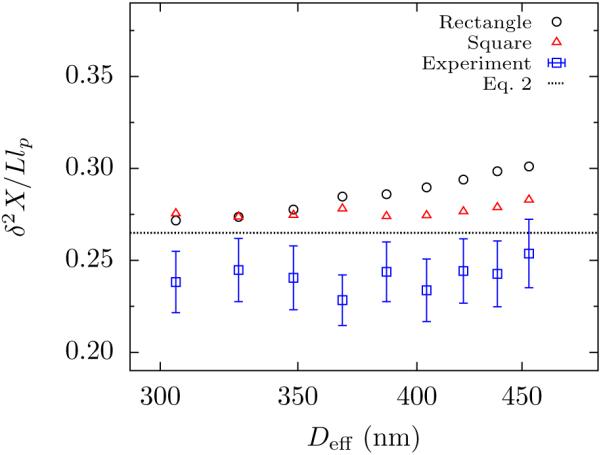
Semilog plot of the average variance in extension, δ2X as a function of effective channel size, Deff , for rectangular channels with depth D1 = 300 nm and widths D2 ranging from 350 nm to 750 nm. The experimental mean extension variance (blue □) are the mean of 29 molecules. Error bars represent the combination of standard error of the mean and propagation of measurement uncertainty (see Supporting Information). PERM simulations in the rectangular channels of dimension D1 = 300 nm and D2 = 350 nm to 750 nm for a contour length L = 70.2 μm are included for rectangular channels (black ○) and equivalent square channels (red △) of size Deff + w. Error bars for the simulation data are smaller than the symbol size. The black dashed line is Eq. 2.
We also checked for anisotropy effects due to the rectangular shape of the channel16,23 by performing PERM simulations in square channels with size Deff + w. Figure 3 shows no systematic deviation in the simulated values of δ2X/Llp between square channels and rectangles up to the aspect ratio D2/D1 = 1.7 of the widest rectangular channel. There does appear to be a small difference for Deff > 370 nm. However, the maximum difference between the rectangular channels and the equivalent square channel was close to 6%, which is of same order of magnitude as the uncertainty in the experimental measurement. We thus conclude that any anisotropy effect in these experiments is much smaller than the circa 200% increase that occurs in the 100 nm deep rectangular channels that exhibit regime mixing.23
While the simulations in square channels produce an exponent similar to the experiments ( at 95% confidence), the simulations for the rectangular channels rejects both classical and extended de Gennes regime hypothesis at the 5% significance level . The discrepancy between simulation and experiments likely arises from the uncertainty in the estimation of parameters which goes into the model used for PERM simulations. We will revisit this uncertainty later in our discussion of the extension results.
Figure 4 summarizes the different results for the average fractional extension of the chain, X/L, as a function of effective channel size, Deff. The relatively good quantitative agreement between the PERM simulations and experimental data results from using L as a fitting parameter, whereupon the only significant metric for comparison is the power law exponent.23 The experimental data produce a scaling of with α = −0.86 ± 0.02. Similar to many previous studies of nanochannel confined DNA,8,29,37 we find that the apparent exponent is more negative than the predictions from weakly self-avoiding random walk theory (α = −2/3, Eq. 1),15 predictions based on a corrected Flory exponent12,14 (α = −0.7015), or our simulations in rectangular channels (α = −0.71 ± 0.01). Disagreement between theory and simulation results in Fig. 4 likely arises from the finite molecular weight. As shown in Supporting Information, PERM simulations for our rectangular channels suggest that the magnitude of the apparent exponent α slowly declines with molecular weight once the chain is large enough to form several blobs, only reaching the asymptotic value for the experimentally impractical scenario of DNA in the megabase range. Disagreement between simulation and experimental data in Figs. 3 and 4 likely arises from uncertainties on the precise value of the persistence length at our salt concentration,33 possible changes in ionic strength during the experiment, and the exact value of the wall depletion length δ. We feel in particular that errors arising from the depletion length might explain the steeper dependence of the experimental extension on channel size compared with simulation. The variance data, independent of channel size, should be affected only by errors on the persistence length, explaining why the variance data agrees better with simulation than the extension. We also see quantitative disagreement between Eq. 1 and our experiments and simulations, as was the case with previous simulations.14
Figure 4.
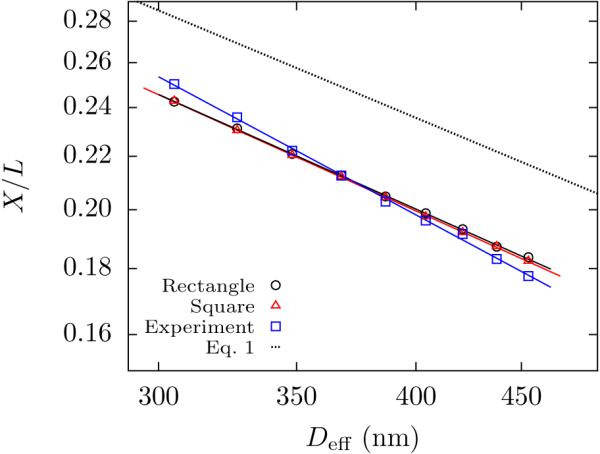
Log-log plot of the average fractional extension, X/L, as a function of effective channel size, Deff . The experimental data (blue □) are the average of 29 molecules. Power law fit to the data yields an exponent α = −0.86 ± 0.03. The uncertainty in the exponent is determined from combination of propagation of 95% confidence interval for the exponent of an individual molecule and its standard error of the mean. PERM simulations in the rectangular channels (black ○) and square channels (red △) were calculated for L = 70.2 μm. Power law fit to the data yields an exponent α = −0.71 ± 0.01 for the rectangular channel and α = −0.72 ± 0.01 for the square channel. The uncertainties in the exponent for the simulations are determined from 95% confidence intervals. The error bars for the extension are smaller than the symbol size. The black dashed line is Eq. 1.15 The prefactor for the simulated extension is similar to previous work.14,24
In summary, we have provided experimental evidence supporting the theoretical prediction of weak excluded volume in the extended de Gennes regime. Simultaneously, we developed an approach to account for the effect of molecular weight dispersity effects. These experiments represent the first test of the emerging theoretical framework describing channel-confined DNA.11 The complete experimental test of the phase diagram for channel-confined DNA, with careful control over molecular weight dispersity, will provide a firm foundation for the emerging genomic technology.2–7
Note added in revision: A preprint38 comparing the extended de Gennes theory and experimental data appeared online after the submission of this letter.
Supplementary Material
Acknowledgement
We thank Dr. Julian Sheats for help with the SEM imaging. The computational work was carried out in part using computing resources at the University of Minnesota Supercomputing Institute. SEM and AFM imaging were performed in the University of Minnesota Nano Center, which receives partial support from the NSF through the NNIN. Nanofunnels structures were patterned using e-beam lithography at the Laboratoire de Micro et Nanofabrication (LMN) at INRS-Varennes. All other fabrication steps were performed at McGill’s Nanotools Facility. This work was supported by grants from the NIH (R01-HG006851) and NSF (DMR-1206045) to K.D.D, a grant from NSERC (DG 386212-10) to W.R., a grant from FQRNT to W.R. (2015-PR-180418) and a Canadian Health Research Projects (CHRP) award to W.R. with joint contributions from the National Science and Engineering Research Council of Canada (NSERC, 446656-13) and Canadian Institute for Health Research (CIHR, CPG-127762).
Footnotes
Supporting Information Available
Experimental methods, evaluation of quantitative agreement with theory, and simulation methodology.
This material is available free of charge via the Internet at http://pubs.acs.org/.
References
- (1).Reisner W, Pedersen JN, Austin RH. Rep. Prog. Phys. 2012;75:106601. doi: 10.1088/0034-4885/75/10/106601. [DOI] [PubMed] [Google Scholar]
- (2).Persson F, Tegenfeldt JO. Chem. Soc. Rev. 2010;39:985–999. doi: 10.1039/b912918a. [DOI] [PubMed] [Google Scholar]
- (3).Lam ET, Hastie A, Lin C, Ehrlich D, Das SK, Austin MD, Deshpande P, Cao H, Nagarajan N, Xiao M, Kwok P-Y. Nat. Biotechnol. 2012;30:771–776. doi: 10.1038/nbt.2303. [DOI] [PMC free article] [PubMed] [Google Scholar]
- (4).Welch RL, Sladek R, Dewar K, Reisner WW. Lab Chip. 2012;12:3314–3321. doi: 10.1039/c2lc40504k. [DOI] [PubMed] [Google Scholar]
- (5).Hastie AR, Dong L, Smith A, Finkelstein F, Lam ET, Huo N, Cao H, Kwok P-Y, Deal KR, Dvorak J, Luo M-C, Gu Y, Xiao M. PLoS One. 2013;8:e55864. doi: 10.1371/journal.pone.0055864. [DOI] [PMC free article] [PubMed] [Google Scholar]
- (6).Cao H, et al. GigaScience. 2014;3:34. doi: 10.1186/2047-217X-3-34. [DOI] [PMC free article] [PubMed] [Google Scholar]
- (7).Nilsson AN, Emilsson G, Nyberg LK, Noble C, Stadler LS, Fritzsche J, Moore ER, Tegenfeldt JO, Ambjörnsson T, Westerlund F. Nucleic Acids Res. 2014:e118. doi: 10.1093/nar/gku556. [DOI] [PMC free article] [PubMed] [Google Scholar]
- (8).Reisner W, Morton KJ, Riehn R, Wang YM, Yu Z, Rosen M, Sturm JC, Chou SY, Frey E, Austin RH. Phys. Rev. Lett. 2005;94:196101. doi: 10.1103/PhysRevLett.94.196101. [DOI] [PubMed] [Google Scholar]
- (9).Daoud M, de Gennes P-G. J. Phys. Paris. 1977;38:85–93. [Google Scholar]
- (10).Odijk T. Macromolecules. 1983;16:1340–1344. [Google Scholar]
- (11).Odijk T. Phys. Rev. E. 2008;77:060901(R). doi: 10.1103/PhysRevE.77.060901. [DOI] [PubMed] [Google Scholar]
- (12).Wang Y, Tree DR, Dorfman KD. Macromolecules. 2011;44:6594–6604. doi: 10.1021/ma201277e. [DOI] [PMC free article] [PubMed] [Google Scholar]
- (13).Dai L, Tree DR, van der Maarel JRC, Dorfman KD, Doyle PS. Phys. Rev. Lett. 2013;110:168105. doi: 10.1103/PhysRevLett.110.168105. [DOI] [PMC free article] [PubMed] [Google Scholar]
- (14).Dai L, van der Maarel J, Doyle PS. Macromolecules. 2014;47:2445–2450. [Google Scholar]
- (15).Werner E, Mehlig B. Phys. Rev. E. 2014;90:062602. doi: 10.1103/PhysRevE.90.062602. [DOI] [PubMed] [Google Scholar]
- (16).Werner E, Mehlig B. Preprint, arXiv:1503.01966v1 [cond-mat.soft]
- (17).Brochardt-Wyart F, Tanaka T, Borghi N, de Gennes P-G. Langmuir. 2005;21:4144–4148. doi: 10.1021/la0474114. [DOI] [PubMed] [Google Scholar]
- (18).Muralidhar A, Tree DR, Dorfman KD. Macromolecules. 2014;47:8446–8458. [Google Scholar]
- (19).Kovacic RT, Comai L, Bendich AJ. Nucleic Acids Res. 1995;23:3999–4000. doi: 10.1093/nar/23.19.3999. [DOI] [PMC free article] [PubMed] [Google Scholar]
- (20).Akerman B, Tuite E. Nucleic Acids Res. 1996;24:1080–1090. doi: 10.1093/nar/24.6.1080. [DOI] [PMC free article] [PubMed] [Google Scholar]
- (21).Alizadehheidari M, Werner E, Noble C, Reiter-Schad M, Nyberg L, Fritzsche J, Mehlig B, Tegenfeldt JO, Abjornsson T, Persson F, Westerlund F. Macromolecules. 2015;48:871–878. [Google Scholar]
- (22).Nyberg L, Persson F, Åkerman B, Westerlund F. Nucleic Acids Res. 2013;41:e184. doi: 10.1093/nar/gkt755. [DOI] [PMC free article] [PubMed] [Google Scholar]
- (23).Gupta D, Sheats J, Muralidhar A, Miller JJ, Huang DE, Mahshid S, Dorfman KD, Reisner W. J. Chem. Phys. 2014;140:214901. doi: 10.1063/1.4879515. [DOI] [PMC free article] [PubMed] [Google Scholar]
- (24).Dai L, Doyle PS. Macromolecules. 2013;46:6336–6344. [Google Scholar]
- (25).Tree DR, Muralidhar A, Doyle PS, Dorfman KD. Macromolecules. 2013;46:8369–8382. doi: 10.1021/ma401507f. [DOI] [PMC free article] [PubMed] [Google Scholar]
- (26).Mansfield ML, Douglas JF. Soft Matter. 2013;9:8914–8922. [Google Scholar]
- (27).Muralidhar A, Tree DR, Wang Y, Dorfman KD. J. Chem. Phys. 2014;140:084905. doi: 10.1063/1.4865965. [DOI] [PMC free article] [PubMed] [Google Scholar]
- (28).Tree DR, Wang Y, Dorfman KD. Phys. Rev. Lett. 2013;110:208103. doi: 10.1103/PhysRevLett.110.208103. [DOI] [PMC free article] [PubMed] [Google Scholar]
- (29).Persson F, Utko P, Reisner W, Larsen NB, Kristensen A. Nano Lett. 2009;9:1382–1385. doi: 10.1021/nl803030e. [DOI] [PubMed] [Google Scholar]
- (30).Hsieh C-C, Balducci A, Doyle PS. Nano Lett. 2008;8:1683–1688. doi: 10.1021/nl080605+. [DOI] [PubMed] [Google Scholar]
- (31).Stigter D. Biopolymers. 1977;16:1435–1448. doi: 10.1002/bip.1977.360160705. [DOI] [PubMed] [Google Scholar]
- (32).Dobrynin AV. Macromolecules. 2006;39:9519–9527. [Google Scholar]
- (33).Brunet A, Tardin C, Salomé L, Rousseau P, Destainville N, Manghi M. Macromolecules. 2015;48:3641–3652. [Google Scholar]
- (34).Frykholm K, Alizadehheidari M, Fritzsche J, Wigenius J, Modesti M, Persson F, Westerlund F. Small. 2014;10:884–887. doi: 10.1002/smll.201302028. [DOI] [PubMed] [Google Scholar]
- (35).Bakajin OB, Duke TAJ, Chou CF, Chan SS, Austin RH, Cox EC. Phys. Rev. Lett. 1998;80:2737–2740. [Google Scholar]
- (36).Randall GC, Doyle PS. Macromolecules. 2005;38:2410–2418. [Google Scholar]
- (37).Werner E, Persson F, Westerlund F, Tegenfeldt JO, Mehlig B. Phys. Rev. E. 2012;75:041802. doi: 10.1103/PhysRevE.86.041802. [DOI] [PubMed] [Google Scholar]
- (38).Iarko V, Werner E, Nyberg L, Müller V, Fritzsche J, Ambjörnsson T, Beech JP, Tegenfeldt JO, Mehlig K, Westerlund F, Mehlig B. arXiv. 2015:1506.02241. doi: 10.1103/PhysRevE.92.062701. [DOI] [PubMed] [Google Scholar]
Associated Data
This section collects any data citations, data availability statements, or supplementary materials included in this article.