Abstract
Excessive environmental vibrations can have deleterious effects on animal health and experimental results, but they remain poorly understood in the animal laboratory setting. The aims of this study were to characterize train-associated vibration in a rodent vivarium and to assess the effects of this vibration on the reproductive success and fecal corticosterone metabolite levels of mice. An instrumented cage, featuring a high-sensitivity microphone and accelerometer, was used to characterize the vibrations and sound in a vivarium that is near an active railroad. The vibrations caused by the passing trains are 3 times larger in amplitude than are the ambient facility vibrations, whereas most of the associated sound was below the audible range for mice. Mice housed in the room closest to the railroad tracks had pregnancy rates that were 50% to 60% lower than those of mice of the same strains but bred in other parts of the facility. To verify the effect of the train vibrations, we used a custom-built electromagnetic shaker to simulate the train-induced vibrations in a controlled environment. Fecal pellets were collected from male and female mice that were exposed to the simulated vibrations and from unexposed control animals. Analysis of the fecal samples revealed that vibrations similar to those produced by a passing train can increase the levels of fecal corticosterone metabolites in female mice. These increases warrant attention to the effects of vibration on mice and, consequently, on reproduction and experimental outcomes.
Abbreviations: FCM, fecal corticosterone metabolites; LPSC, Linus Pauling Science Center
To reduce confounding variables, many laboratory conditions are standardized (light cycle duration, air quality, temperature, and relative humidity) to a narrowly defined acceptable range.10 Environmental sound and vibration in animal vivaria are two potentially overlooked factors that could have detrimental impacts on the ability of researchers to produce consistent experimental results. The Guide for the Care and Use of Laboratory Animals suggests that activities that produce sound and vibration in animal rooms should be minimized, citing the potential for animal distress and altered research results.10 The effect of sound on the physiology and behavior of mice is widely recognized and can range from mild distress to reduced reproductive efficiency and audiogenic seizures in some strains of mice.25,36 The hearing range of mice is speculated to range from 1 to 100 kHz in contrast to human hearing, which is between 20 Hz and 20 kHz.7,13 It is important to note, however, that the hearing range of mice is a subject of debate because of an inability to accurately determine the true lower and upper bounds of mouse hearing.13 Some researchers indicate that the lower frequency limit for the hearing of mice is at 2.3 kHz, whereas others state that the greatest hearing sensitivity in mice occurs between 12 to 24 kHz.7,37 The disparity between the hearing range of mice and that of humans has led to the speculation that humans may overestimate how loud or bothersome certain sounds are to laboratory mice.26
Whereas the hearing ranges of laboratory mice have been quantified,7,13,37 there are no published data on a specific perception threshold for vibration in mice. However, information pertaining to the pathologic or physiologic effects seen with whole-body vibration at several amplitudes and frequencies has been reported.3–5,16,27,34,35 In rats, whole-body vibration increased plasma corticosterone and brain serotonin levels at 0.4 × g and 20 Hz.1 Increased adrenal weight and decreased gastric emptying time were observed at 2.0 to 2.4 × g and 5 to 15 Hz.28,30 In mice, whole-body vibration decreased adipogenesis,27 and increased bone formation at 0.1 to 0.3 m/s2 and up to 90 Hz,27,34,35 suggesting that vibration at those levels is biologically significant. In terms of reproduction as well as deformities, vibration has been reported to increase rates of fetal resorption and cleft palate and has been linked to cannablism.14,16
Vibration in the form of ‘shaker stress’ has been reported as a stress model, in which customized cages are mounted on a shaking platform with a 2- to 3-cm stroke at 60 to 150 cycles per minute.3,4,18 Shaker stress is a pain-free stimulus that has been shown to cause reproducible changes in blood pressure, heart rate, sympathetic activity, and stress hormone secretion.6,18
Despite the well-documented evidence of stress induction due to whole-body vibration in rodents, little information exists regarding the effects of environmental vibration on laboratory mice in standard housing conditions. One study20 investigated the vibrations produced by various heavy machinery during building construction and compared them with the resonant frequencies of three anatomic locations in several species, including mice, rats, and humans. The authors concluded that particular vibration frequency ranges are more likely to affect rats and mice as compared with humans.20 More research is needed to encompass the various vibration scenarios that occur in the laboratory setting—only then can standards be formulated to control and mitigate this biologic stressor.
Laboratory animal vivaria are constructed to suit the needs of the institution in regard to proximity to other research facilities, campus land-use planning, and land restrictions. As a result, laboratory animal housing can be located near subways, trains, or highways, all of which might transmit vibrations at magnitudes and frequencies that cause stress in rodents. As a case in point, the Laboratory Animal Resources Center at Oregon State University is located approximately 30 m from an active railroad track. On average, 4 trains of various lengths pass the building each afternoon.
The closest animal room to the train tracks developed problems with abnormally high rates of cannibalism or neglect of pups. After investigating other potential causes such as temperature variations, light–dark cycles, and diet, we hypothesized that the vibrations from the train were a significant factor. The reproductive success of the same set of mice improved after they were moved from a flat wire rack to a single motor-ventilated rack. The ventilated racks hold cages in place with a cage clip and therefore might decrease cage-to-rack vibration. In addition, ventilated racks are much heavier than are wire racks and have an air intake and exhaust system that generates its own constant minor background vibrations; these factors may contribute to a dampening or partial masking of the potentially more startling short-duration, intense train-induced vibrations. Similar high rates of preweaning mortality have not occurred at the other main rodent housing facility on campus, the Linus Pauling Science Center (LPSC), which is a state-of-the-art science facility that was constructed in 2011 and lies approximately 490 m away from the railroad tracks. The differences in mouse reproductive success between the facilities and rack types prompted us to investigate the effects of environmental vibration.
Vibrations and sound are disturbances that travel through a medium. Vibrations often move through a solid medium, whereas sound passes through a gaseous or liquid one, such as air or water. The disturbances caused by vibrations and sound can often be represented by a wave model. Waves oscillate with a specific frequency and have particular amplitudes, which change as the waves propagate from the source. For this study, it is important to know the frequency and amplitude of the waves that are measured to categorize their effects. Certain wave frequencies and amplitudes may be more detrimental to the health of the mice. The majority of the energy produced by trains moving on the ground surface is conveyed by Rayleigh waves.23,29 Such vibration waves usually have a frequency between 2 to 80 Hz, frequencies that can disturb people.23,29 Regarding sound, the energy generated at the source travels through the air as a longitudinal or pressure wave.24 The ears of humans and mice are designed to process a broad frequency range, and a decibel scale is used to indicate sound pressure in a concise manner.
The specific goal of the current study was to characterize the effects of train-associated vibration and sound on laboratory mice housed on flat racks. During the preliminary observational part of the study, the vibrations from trains were characterized in terms of magnitude and frequency. In addition, the reproductive success of mice housed in a vibration-prone room in the vivarium was monitored. To further explore the effects of train-induced vibration more objectively, the second part of the study exposed a set of mice to environmental vibration in a controlled setting. To create controlled vibrations, an electromagnetic shaker was designed and constructed to induce vibrations similar to those produced by the trains passing the vivarium. The mice were monitored by measuring fecal corticosterone metabolites (FCM). We hypothesized that mice exposed to train vibrations have elevated FCM.
Materials and Methods
Part I: Initial characterization of vibration and observation of breeding success.
Measurements of sound and vibration.
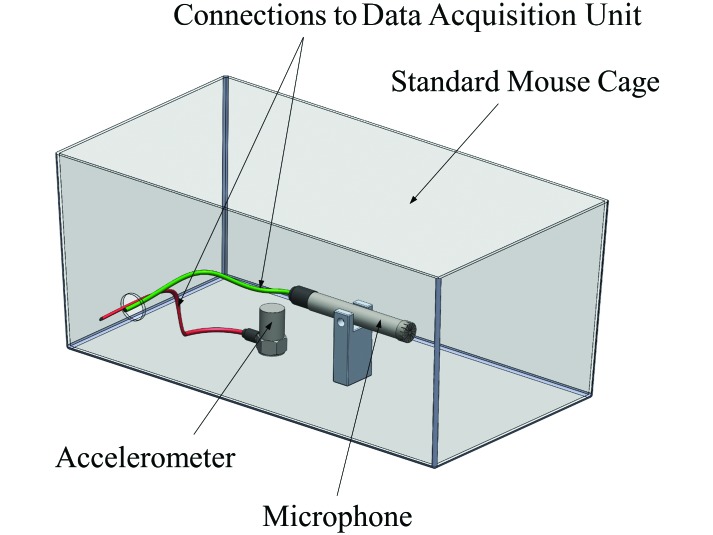
To assess the presence and effect of environmental vibrations within the Laboratory Animal Resources Center (the vibration-prone vivarium), a measurement cage was created. The measurement cage consists of a laboratory mouse cage (SuperMouse 750, Lab Products, Seaford, DE), a vertically placed high-sensitivity accelerometer (model 8612B5, Kistler, Winterthur, Switzerland), and a high-precision microphone (model 378B02, PCB Piezoelectronics, Depew, NY). Two pouches of water were placed within the cage to simulate an average cage mass of 2 kg. The bedding and other animal accessories were deemed unnecessary because the accelerometer is solely influenced by the mass of the cage and the incoming vibrations. The measurement cage connects to a data acquisition unit (National Instruments, Austin, TX), which relays the sound and vibration data to a laptop (Vostro 1510, Dell, Round Rock, TX) equipped with data-logging software (LabView, National Instruments). The system was used to measure the vibrations and sound present within the vibration-prone facility and the LPSC (which is relatively unaffected by train-induced vibration). A diagram of the system, except for the cage lid, is provided in Figure 1.
Figure 1.
Diagram of measurement cage.
Sound and vibration sampling rates were selected based on the Nyquist theorem,2 which states that the sampling frequency must be at least twice the frequency of the incoming signal. Therefore, to capture all sound frequencies to a maximum of 20 kHz and vibration frequencies to 1 kHz, sampling was conducted at 40 kHz and 2 kHz, respectively. Sound and vibration frequency values of 20 kHz and 1 kHz were selected based on data collected from preliminary measurements in the vibration-prone room. Vibration and sound measurements were collected on flat racks from 1300 to 1700 daily. To verify the passing of the train and to relate it to the observed vibrations and sound, a network camera (Q16 series, Axis Communications, Lund, Sweden) was installed on an office window that faced the railroad tracks. Video recordings were made throughout the time period during which vibration and sound measurements were collected.
Initial measurements were collected from several animal rooms and various rack types; however, it became apparent that each room and rack type had its own, distinctive response to the vibrations. To simplify the study, we focused on the most problematic room and the type of rack used most often; we therefore selected a single room (room 103 of the Laboratory Animal Resources Center; the ‘test room’) for the majority of the measurements and a flat, wire rack (Super Erecta, InterMetro Industries, Wilkes-Barre, PA) was used. The placement of the measurement cage on the rack was investigated by obtaining acceleration readings with the measurement cage on the various shelves. We determined that almost identical acceleration readings resulted, regardless of the placement of the measurement cage.
Five measurements of vertical vibration were taken in the test room to determine the effect of mice and cages placed on the flat rack. To assess the frequency of the passing trains accurately, the vibrations caused by the movement of the mice had to be eliminated. To this end, the cages were removed, and equivalent weight was added to the rack to match that of the mice and the cages. The measurement cage remained on the rack during every trial to obtain the necessary vibration data. The average mass of a cage with mice is 2 kg. To represent 20 mouse cages, 20 weights were used that were each approximately 2 kg. The weights were spaced as if they were cages: uniformly on each level of the flat rack. The measurement cage was used to conduct five additional measurements with the weighted rack. In addition to measuring vertical vibration, horizontal vibration was assessed. Horizontal vibrations were measured by fastening the accelerometer on a rigid metal L-bracket and securing it to the bottom of the instrumented mouse cage. Otherwise, horizontal readings were obtained in the same manner as the measured vertical vibrations.
To verify that the train vibrations were specific to buildings in the immediate vicinity of the railroad tracks, the instrumented cage was placed on a rack in an empty animal room in a vivarium that was distant from the tracks. The sound and vibration measurements followed the same procedures as those used in the LARC.
Mice.
The mice were housed at 22 °C, with a 12:12-h dark-light cycle and 1 to 3 mice per cage on standard bedding. Breeding animals were maintained on a pelleted breeding diet (2919, Harlan, Dublin, VA), and weanlings and nonbreeding male mice were maintained on a standard pellet diet (5053, Purina, St Louis, MO) and water pouches provide a constant, free-choice water supply (HydroPac, Lab Products). For breeding experiments, mice were arranged into breeding trios consisting of 1 male and 2 female mice. The date each litter was delivered (postnatal day 0, day of birth) and an estimated number of pups were recorded. Cage changes were performed no sooner than postnatal day 7 to reduce sources of early postpartum stress; an accurate pup count was performed at that time also. Pups were weaned at postnatal day 21. At weaning, the number and sex of the pups was recorded. All animal experiments were approved by the IACUC of Oregon State University, which is fully AAALAC-accredited.
Two groups of mice were used, an outbred stock (Crl:CD1, also known as ICR mice; age, 12 to 16 wk) and a GSTA3 knockout (GK; age, 18 to 23 wk) strain on a C57BL/6 background. The GSTA3 gene encodes proteins involved in cellular detoxification by catalyzing the conjugation of glutathione with a wide range of endogenous and xenobiotic alkylating agents, including carcinogens.9 The GK mice were donated from the colony that previously had a high rate of cannibalism and maternal neglect when housed on the flat racks in the test room. Mice were arranged into breeding trios consisting of 1 male and 2 female mice; 15 ICR breeding trios and 14 GK breeding trios were arranged in age-matched groups. Male mice remained with the female mice for 10 d, and then dams were housed singly until parturition. Reproductive success was quantified by the percentage of female mice that delivered a litter, the number of pups born, the number of pups weaned, and the pre-weaning mortality (no. of pups weaned divided by no. of pups born)
Facilities.
The Laboratory Animal Resources Center (the vibration-prone vivarium) was built in the mid1970s and features interior and exterior walls constructed primarily of reinforced concrete masonry units. The ceiling is made of suspended gypsum board, and the building floor is a concrete slab. The facility is located roughly 30 m from an active railroad and lacks the modern construction advancements that are used in building new laboratory facilities today. The test room, in which mice have historically had a low reproductive success, is located on the corner of a hallway and is the animal-housing room that is closest to the railroad tracks.
Data analysis.
All vibration and sound data were compiled and analyzed by using MATLAB (MathWorks, Natick, MA) and the built-in capabilities of the LabView software (National Instruments). A MATLAB script plotted the vibration and sound data and extracted peak accelerations and sounds. The vibration data was collected in units of gravitational acceleration (× g; 9.81 m/s2 per g), whereas the sound data was measured in units of decibels (dB). The units of dB were used to represent the collected sound pressure values on a logarithmic scale and in relation to a specific reference value (for more information regarding measuring sound in a laboratory setting, see reference 8). The sound measurements were refined by computing the equivalent continuous sound level21 for every second of sound data.
The dominant frequencies of the sound and vibrations data were obtained by conducting a fast Fourier transform of the raw data through LabView.12,19 All frequencies were measured in Hertz (Hz; that is, cycles per second).
Statistical methods.
ANOVA was used to determine the significance of any difference between train-induced vibrations and the ambient vibrations present within the test room. As recommended elsewhere,17 single-factor ANOVA was performed in Excel (Microsoft, Redmond, WA) and verified by using Statgraphics (Statpoint Technologies, Warrenton, Virginia).
Part II: Induction and analysis of controlled vibration.
Vibration simulation experiment.
Two cages of 5 male mice and 2 cages of 5 female mice were exposed to environmental vibration in their home cages by using an electromagnetic shaker. Each cage was vibrated individually by placing it at the center of the shaker platform. One cage of male mice and one of female mice were used as the control groups. The induced vibration had a frequency of 14 Hz and a maximal acceleration of approximately 0.025 × g; these parameters are characteristic of the vibrations recorded in the vibration-prone room during the passing of a typical train. The cages were vibrated in the LPSC, the vivarium facility that is not exposed to train vibrations. The cages vibrations were administered at about 1200, 1330, and 1430, with each vibration episode lasting 4 min. The times of vibration were selected based on the times at which the trains typically pass the facility each day. The control groups were set on the vibration platform but were not vibrated. Fecal sample collection began after the first set of vibrations (Figure 2).
Figure 2.
Summary of when feces were collected and vibrations were completed
The room lights shut off at 1800, after which the built-in, red ceiling lights within the room were used during feces collection in the dark. The mice were moved into individual, clean cages lined with a paper towel for feces collection. The investigators waited until each animal expelled three fecal pellets and then moved the animal back to its respective group cage. All fecal pellets were collected with tweezers, placed in individually labeled 2-mL Corning tubes, put immediately on dry ice, and moved into a freezer (–80 °C) for storage. The samples were dried and extracted in-house.31,32 Dried extracts were sent to the University of Veterinary Medicine (Vienna, Austria) for measuring of FCM by using a previously described and successfully validated enzyme immunoassay.31,32
Electromagnetic shaker.
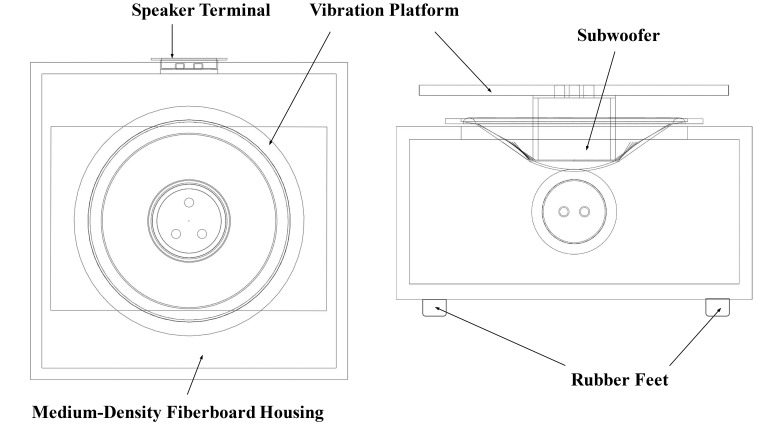
An electromagnetic shaker was selected as the method with which to induce vibrations because of its ability to produce high-frequency movements; however, because of the exorbitant costs of commercial electromagnetic shakers, a custom shaker (Figure 3) was constructed from an audio subwoofer (200-W Audiovox Rampage, Voxx International, Carmel, IN). The subwoofer was powered by an amplifier (X75, Russound, New Orleans, LA), and the necessary output was generated by using the MATLAB software package (MathWorks) and a laptop (Vostro 1510, Dell).
Figure 3.
Top and side views of the constructed electromagnetic shaker.
The MATLAB software was used to create a 14-Hz sinusoidal waveform that is representative of the motion induced by a passing train. The amplitude of the sine wave was set by adjusting the volume of the amplifier: increased volume yielded increased amplitude. The entire vibration system was calibrated by using the measurement cage. The vibrations and sound created by the shaker were recorded to determine whether a 14-Hz, 0.025-g vibration output was generated and to investigate whether the shaker system created sound that negatively affected the mice.
Mice.
All mice used in part II of this study were ICR mice born inhouse. After weaning, they were housed with same-sex littermates with 5 mice per cage in individually ventilated cages. Husbandry, lighting conditions, and health status are the same as previously described for part I. The mice were 15 wk old at the time of vibration exposure and data collection; 6 cages (3 male, 3 female) of mice with 5 mice per cage were used, with 2 cages from each group serving as the experimental animals and the remaining cage as the control. The mice were moved into a designated room within the vivarium 1 wk prior to the study. Starting 4 d before the study, the tails of all the mice were uniquely marked with a nontoxic marker, and the mice were acclimated to the cage-transfer routine needed for collecting the fecal pellets. The routine consisted of individually moving the mice, twice each day, into empty collection cages by using a short piece of PVC pipe (included in each cage as enrichment); this procedure was done to minimize handling stress and variability in handling technique.
Facilities.
Part II of this study was conducted in the LPSC, a state-of-the-art facility that opened in 2011 and features the latest advances in seismic design; this facility is located approximately 490 m from the railroad tracks that pass the vibration-prone vivarium. Vibration measurements were conducted at the LPSC vivarium, which was deemed unaffected by the passing trains.
Data analysis and statistical methods.
Unlike for part I, the data analysis for part II focused mainly on the FCM levels of the mice rather than the vibration measurements; vibration was measured only to calibrate the vibration device and to characterize the building prior to conducting the study. The FCM results obtained from the laboratory in Austria were analyzed by using a multifactor ANOVA with a 95% confidence level. Separate ANOVA were conducted for the female and male data to isolate sex as a factor. The factors considered in the sex-specific ANOVA were the various groups (control and experimental) and the increments of time. From the ANOVA for each sex, the mean square value within groups was used in 2 posthoc tests: the Tukey method and the Fisher Least Significant Difference test. To allow for more meaningful results, the posthoc comparisons were conducted within each specific time increment; α levels of 0.05 and 0.10, which correspond to 95% and 90% confidence levels respectively, were used to assess the data. The ANOVA and post-hoc comparisons were calculated in Excel as recommended.17 The statistical work in Excel was verified by using Statgraphics (Statpoint Technologies).
Results
Part I.
Sound and vibrations.
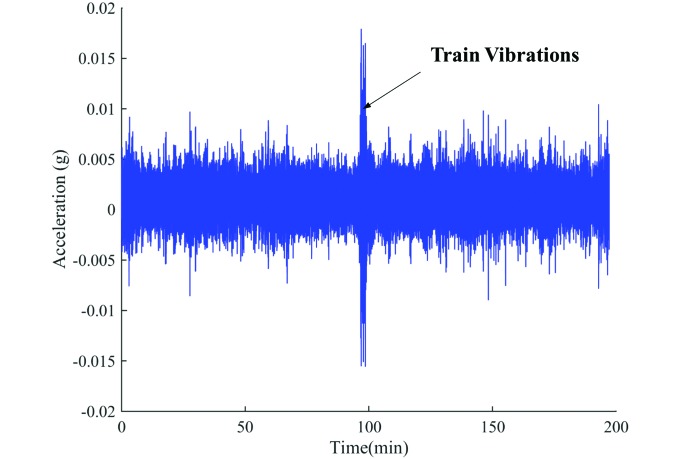
The greatest vibrations in the test room occurred during the passing of the train. The peak vibrations caused by the passing train were between 0.001 and 0.025 × g and had a frequency range of 12 to 16 Hz. Figure 4 represents a typical vibration recording for the test room with mouse cages placed on the flat rack. Trains passed the vivarium for 1 to 4 min, depending on the length of the train. The vibrations produced by the train extend well above the ambient vibrations within the room; a single-factor ANOVA identified a significant difference (P = 0.001) between the train-induced and ambient vibrations.
Figure 4.
Typical vibrations in the test room with mice on the flat rack.
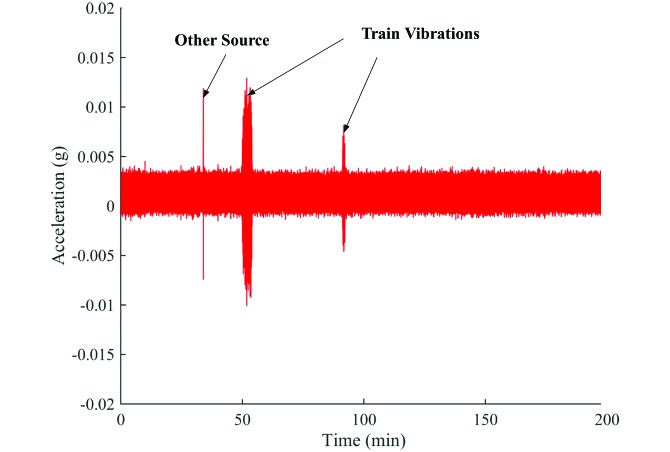
The results of a typical measurement of a weighted rack without mice are summarized in Figure 5. The vibrations induced by the passing train extended beyond the ambient rack vibrations and were similar to the train-induced vibrations seen when the rack is loaded with mice. The 2 peaks due to train vibrations differed in magnitude and duration. The magnitude of the vibrations was directly proportional to the mass and length of the train. The frequency of the vibrations did not change markedly from train to train. At the vivarium that is distant from the tracks, no train vibrations were measured above ambient levels when recordings were taken, even though the train passed the campus several times during the recording periods.
Figure 5.
Typical vibrations in the test room without mice on the flat rack but with equivalent weight added.
The vibration measurements taken from the accelerometer in a horizontal position resulted in no apparent peak vibrations. Furthermore, the ambient horizontal vibrations were lower than the vertical ambient vibrations. Overall, the horizontal vibrations in the 2 vivaria were insignificant compared with the vertical vibrations.
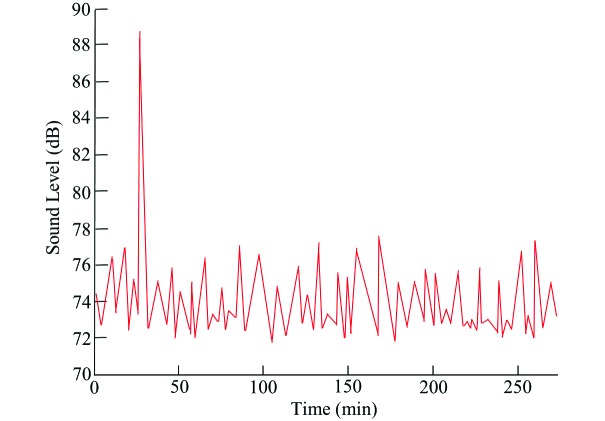
The sound recorded in the vibration-prone vivarium reached a maximum (average of maxima from all of the recordings) of 108 dB and predominately spanned a frequency range of 1 to 1600 Hz. Figure 6 is a compilation of typical measurements of the equivalent continuous sound level. The sound level fluctuated between 72 and 77 dB, with peaks seldom exceeding this range. The largest peak in Figure 6 was due to the signaling horn of a passing train.
Figure 6.
Typical equivalent continuous sound level of the test room.
Breeding success.
The pregnancy rate, average litter size, individual pup survival, and average number of pups weaned per dam were observed (Table 1). Not surprisingly, the outbred ICR mice had significantly larger litter sizes, individual pup survival rates, and numbers of pups weaned per litter (P < 0.01 for all) than did the GK mice. The pregnancy rate (the percentage of male-exposed female mice that delivered a litter) did not differ between genotypes. Of all the female mice bred, 46.7% (28 of 60 mice) delivered a litter. The observed pregnancy rates were much lower than the expected 90% rate for the ICR mice and the expected 80% rate for the GK mice, according to the institution's previous experience with these mice.
Table 1.
Breeding success of ICR and GK mice
| ICR | GK | Overall | |
| No. pregnant/no. bred | 8/16 (50%) | 6/15 (40%) | 14/31 (45%) |
| Expected pregnancy rate | 90% | 80% | 85% |
| No. of pups born per littera | 12.0 | 8.0 | 10.3 |
| No. of pups weaned per littera | 11.5 | 6.3 | 9.3 |
| Survival %a | 95.8% | 79.2% | 92.1% |
Significant (P < 0.01) difference between ICR and GK mice.
Part II.
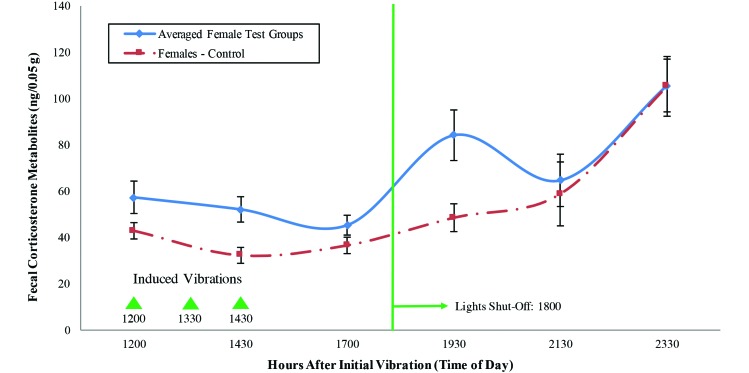
Figures 7 and 8 show the FCM levels (mean ± SE) of the experimental test groups as compared with the control group. The multifactor ANOVA for the female mice indicated that the time point and group had significant effects on stress levels, but no interaction effects existed (time, P = 0.000; group, P = 0.019; interaction, P = 0.134).
Figure 7.
FCM levels (mean ± SE) of the female mice. The triangles indicate the times at which vibrations were induced with the electromagnetic shaker; the vertical line indicates the day-to-night transition.
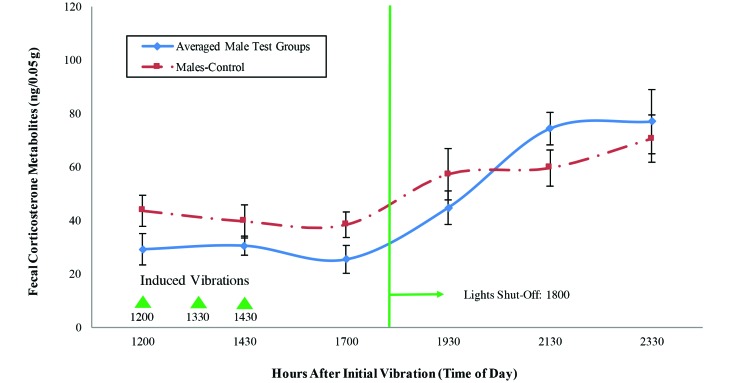
Figure 8.
FCM levels (mean ± SE) of the male mice. The triangles indicate the times at which vibrations were induced with the electromagnetic shaker; the vertical line indicates the day-to-night transition.
Conducting pairwise comparisons at each time increment by using the Tukey and Fisher Least Significant Difference methods revealed that, at the 7.5- and 9.5-h time points, the means of the experimental groups differed significantly from that of the control group. For both the Tukey test and Fisher Least Significant Difference method, the significance levels (α) used were 0.10 and 0.05 for the 7.5- and 9.5-h time points, respectively. At 7.5 h, differences were apparent when the 2 experimental groups were compared individually with the control group; however, no significant difference was detected when comparing the groups against each other. At the 9.5-h time point, the 2 experimental groups differed from each other. In addition, one of the experimental groups differed from the control group, but the other did not.
The ANOVA of the data from the male mice revealed that thetime point had a significant effect on stress levels but that group and the time×group interaction did not (time, P= 0.000; group, P= 0.312; interaction, P= 0.139). Comparing the pairwise group means revealed a moderate difference at the 9.5-h time point (α = 0.10) when 2 experimental mice groups with one another and when one of the experimental groups was compared with the control. All of these results were strengthened by understanding the characteristics of the vibration system and verifying that it functioned as expected.
The output vibrations created by the shaker system were verified to be approximately 14 Hz at 0.025 × g when the system was measured under the set parameters by using the test cage. The sound output, which was recorded as the system vibrated the test cage at 14 Hz and 0.025 × g, indicated that a 14-Hz sound was most prominent. The power spectrum had, overwhelmingly, the highest power in the 14-Hz bin, with progressively less power in adjacent bins. Sound above 100 Hz did not yield any spectral peaks.
Discussion
The vibration amplitudes recorded in the test room were lower than those in previous investigations using rats, which used amplitudes as high as 2.4 × g; however, the frequencies of the current recordings were in a range that has been shown to cause negative effects.1,28,30 The train-induced vibrations in the test room are unique to that building, as confirmed by the lack of train vibrations observed in the Science Center, most likely because of the new construction methodologies that were used and the structure's distance from the train tracks. The sound measurements in the test room indicated that the majority of the sounds produced in and around the facility nearer the train tracks were beyond the hearing range of mice. Therefore, the sound present in the test room is most likely not a significant stressor for the mice.
We did not note high rates of preweaning mortality and cannibalism among the ICR and GK mice bred in the test room during this study. The excessive cannibalism that was observed historically may have been due, in part, to the experimental protocol. However, the pregnancy rate during this initial study was lower than was expected for ICR mice in other campus vivaria. Breeding success can be influenced by numerous factors, some of which can be difficult to adequately control. Assessment of breeding efficiency by directly comparing simultaneous breeding in a vibration-exposed environment and one lacking train-associated vibration would have been superior to using historical breeding records. We considered performing breeding experiments with the control group housed in the vivarium distant from the railroad tracks, but we were concerned about controlling sufficiently for differences in staffing and husbandry practices between the 2 sites. Therefore, we opted to use FCM as a physiologic marker of vibration effects in subsequent experiments.
We noted several important factors during the measurement of the train vibrations: the interaction of technicians and researchers with the racks, the weight and length of the train, and the fluctuation in ambient vibrations. At times, technicians and investigators created large instantaneous vibration peaks as they handled the cages. The first peak vibration in Figure 5, labeled ‘Other Source,’ is an example of such a vibration. Because of their extremely short duration, we assumed that these peaks did not affect the mice significantly. The weight and length of the train affect the vibrations that advance through the ground, indicating that all train-induced vibrations are unique and contribute variety to what the mice experience. The variety of vibration inputs may make it difficult for the mice to adapt to the vibrations. The ambient vibrations that occurred in the test room can mainly be attributed to the activity of the mice within the cages. If the mice have a running wheel or are particularly active during the day, they create larger ambient vibrations. These vibrations may affect the surrounding mice, but they are low in amplitude and usually higher in frequency than are the train vibrations. Compared with the train-associated vibrations, the mice might adapt more readily to the ambient vibrations and be aware of the sound and vibrations that their fellow cage-mates create.
From the perspective of a human being, the data show that the vibrations caused by the passing trains were equivalent to a level IV on the Modified Mercalli Intensity Scale.33 The Modified Mercalli Intensity Scale is used with the Richter and moment magnitude scales to classify how an earthquake is perceived. According to the Modified Mercalli Intensity Scale, a level IV vibration can be “Felt indoors by many, outdoors by few during the day. Sensation is like a heavy truck striking a building.”15 Correlated to the Richter scale, a level IV vibration equates approximately to a 4.0 earthquake.33 As such, mice housed in the railroad-side vivarium experience the equivalent of a considerable and prolonged earthquake at least 3 or 4 times daily.
Part II of the current study analyzed the FCM levels within mice of both sexes to assess the effects of vibrations similar to those produced by a passing train. Significant increases in FCM were observed in vibration-exposed as compared with control female (but not male) mice at the 7.5-h time point. Previous reports have demonstrated an increase in FCM at 4 to 9 h after an acute stressor.11,22,32 The timing of the observed increase in FCM in our current study is consistent with the rise being attributable to stress from vibration exposure. This finding suggests that the vibrations produced by the passage of the train constitute a potential stressor that might introduce nonexperimental variability into research results or negatively influence mouse wellbeing. However, the induced vibration might not have been the only cause of increased FCM levels in the mice. Manipulations such as handling, cage changes, and the separation of group-housed animals could have all increased the FCM levels; however, these conditions were the same for both the control and experimental groups. In addition, FCM levels are significantly influenced by sex and time of day.32 Therefore, we used control mice of the same sex that were sampled at the same time points as the experimental mice, and we did not directly compare female with male FCM in the analyses. The reasons for the different findings between the sexes are not apparent; however, in the context of laboratory mouse husbandry, exposure of female mice to stressors may be more likely to result in reduced colony productivity. Although the male FCM levels were not significantly altered by vibrations in the current study, we cannot definitively conclude that male mice are not influenced by the vibrations of the train.
One additional consideration is whether mice habituate to vibrations of this magnitude and frequency and how long such acclimation might take. These questions would be an interesting area for further study. Identifying an acclimation period could be a cost-effective management solution to address this potential confounding factor in research.
In conclusion, poor reproductive success in mice results in the need to use more animals and thus an increased expense to research projects. The preliminary data we gathered indicate that vibrations from passing trains create significant increases in the FCM levels of female mice. Fluctuations in stress may be disruptive to research studies and breeding colonies. Elevated corticosterone levels can induce a variety of negative effects in rodents.1,28,30 Vibrations are present in every facility; and research facility managers should strive to quantify and mitigate vibration in vivarium buildings. The measurement and ongoing monitoring of facility vibrations should be a part of the documented environmental data of a well-managed animal facility.
Acknowledgments
We thank David Kim for help with the statistical analysis of the data, Milo Klaus and the Forestry Department at OSU for allowing us to borrow the Kistler accelerometer, James Batti for helpful ideas in regards to the vibration creation and data collection methodologies, LeeCole Legette for pellet extractions, and Edith Klobetz-Rassam for the FCM analyses. We also acknowledge Stewart Sell, the originator of the GSTA3 knockout mice, and David Williams, Professor, Department of Environmental and Molecular Toxicology, OSU, whose laboratory group initially reported the issues regarding the GSTA3 mice.
References
- 1.Ariizumi M, Okada A. 1983. Effect of whole-body vibration on the rat brain content of serotonin and plasma corticosterone. Eur J Appl Physiol Occup Physiol 52:15–19. [DOI] [PubMed] [Google Scholar]
- 2.Barber A. 1992. Handbook of noise and vibration control, 6th ed. Philadelphia (PA): Elsevier Science. [Google Scholar]
- 3.Bernatova I, Key MP, Lucot JB, Morris M. 2002. Circadian differences in stress-induced pressor reactivity in mice. Hypertension 40:768–773. [DOI] [PubMed] [Google Scholar]
- 4.Costantine MM, Ferrari F, Chiossi G, Tamayo E, Hankins GD, Saade GR, Longo M. 2009. Effect of intrauterine fetal programming on response to postnatal shaker stress in endothelial nitric oxide knockout mouse model. Am J Obstet Gynecol 201:301.e1–6. [DOI] [PMC free article] [PubMed] [Google Scholar]
- 5.Dhabhar FS, Saul AN, Tyson HH, Neri E, Tillie JM, Kusewitt D, Oberyszyn TM. 2012. High-anxious individuals show increased chronic stress burden, decreased protective immunity, and increased cancer progression in a mouse model of squamous cell carcinoma. PLOS ONE 7:e33069. [DOI] [PMC free article] [PubMed] [Google Scholar]
- 6.Hashiguchi H, Ye SH, Morris M, Alexander N. 1997. Single and repeated environmental stress: effect on plasma oxytocin, corticonsterone, catecholamines, and behavior. Physiol Behav 61: 731–736. [DOI] [PubMed] [Google Scholar]
- 7.Heffner HE, Heffner RS. 2007. Hearing ranges of laboratory animals. J Am Assoc Lab Anim Sci 46:20–22. [PubMed] [Google Scholar]
- 8.Hughes LF. 2007. The fundamentals of sound and its measurement. J Am Assoc Lab Anim Sci 46:14–19. [PubMed] [Google Scholar]
- 9.Ilic Z, Crawford D, Egner PA, Sell S. 2010. Glutathione-S-transferase A3 knockout mice are sensitive to acute cytotoxic and genotoxic effects of aflatoxin B1. Toxicol Appl Pharmacol 242:241–246, correction 245:280. [DOI] [PMC free article] [PubMed] [Google Scholar]
- 10.Institute for Laboratory Animal Research 2011. Guide for the care and use of laboratory animals, 8th ed. Washington (DC): National Academies Press. [Google Scholar]
- 11.Jensen K, Hahn NE, Palme R, Saxton K, Francis DD. 2010. Vacuum-cleaner noise and acute stress responses in female C57BL/6 mice (Mus musculus). J Am Assoc Lab Anim Sci 49:300–306. [PMC free article] [PubMed] [Google Scholar]
- 12.Kamen EW. 2006. Fundamentals of signals and systems using the web and MATLAB. Prentice Hall. [Google Scholar]
- 13.Koay G, Heffner RS, Heffner HE. 2002. Behavioral audiograms of homozygous med(J) mutant mice with sodium channel deficiency and unaffected controls. Hear Res 171:111–118. [DOI] [PubMed] [Google Scholar]
- 14.Lane-Petter W. 1968. Cannibalism in rats and mice. Proc R Soc Med 61:1295–1296. [PMC free article] [PubMed] [Google Scholar]
- 15.Michigan Technological University 2013. UPSeis: an educational site for budding seismologists. [Citied 15 December 2013]. Available at: http://www.geo.mtu.edu/UPSeis/Mercalli.html
- 16.Montenegro MA, Palomino H, Palomino HM. 1995. The influence of earthquake-induced stress on human facial clefting and its simulation in mice. Arch Oral Biol 40:33–37. [DOI] [PubMed] [Google Scholar]
- 17.Montgomery DC. 2012. Design and analysis of experiments. Hoboken (NJ): Wiley. [Google Scholar]
- 18.Nakata T, Berard W, Kogosov E, Alexander N. 1993. Cardiovascular change and hypothalamic norepinerphine release in response to environmental stress. Am J Physiol 264:R784–R789. [DOI] [PubMed] [Google Scholar]
- 19.National Instruments Corporation 2003. LabView measurements manual. Austin (TX): National Instruments Corporation. [Google Scholar]
- 20.Norton JN, Kinard WL, Reynolds RP. 2011. Comparative vibration levels perceived among species in a laboratory animal facility. J Am Assoc Lab Anim Sci 50:653–659. [PMC free article] [PubMed] [Google Scholar]
- 21.Norton MP, Karczub DG. 2003. Fundamentals of noise and vibration analysis for engineers. Cambridge (United Kingdom): Cambridge University Press. [Google Scholar]
- 22.Palme R, Touma C, Arias N, Dominchin MF, Lepschy M. 2013. Steroid extraction: get the best out of faecal samples. Wien Tierarztl Monatsschr 100:238–246. [Google Scholar]
- 23.Peplow AT, Jones CJ, Petyt M. 1999. Surface vibration propagation over a layered elastic half-space with an inclusion. Appl Acoust 56:283–296. [Google Scholar]
- 24.Randall KD. 2007. Physics for scientists and engineers: a strategic approach with modern physics and mastering physics. Boston (MA): Addison–Wesley. [Google Scholar]
- 25.Rasmussen S, Glickman G, Norinsky R, Quimby FW, Tolwani RJ. 2009. Construction noise decreases reproductive efficiency in mice. J Am Assoc Lab Anim Sci 48:363–370. [PMC free article] [PubMed] [Google Scholar]
- 26.Reynolds RP, Kinard WL, Degraff JJ, Leverage N, Norton JN. 2010. Noise in a laboratory animal facility from the human and mouse perspectives. J Am Assoc LabAnim Sci 49:592–597. [PMC free article] [PubMed] [Google Scholar]
- 27.Rubin CT, Capilla E, Luu YK, Busa B, Crawford H, Nolan DJ, Mittal V, Rosen CJ, Pessin JE, Judex S. 2007. Adipogenesis is inhibited by brief, daily exposure to high-frequency, extremely low-magnitude mechanical signals. Proc Natl Acad Sci USA 104:17879–17884. [DOI] [PMC free article] [PubMed] [Google Scholar]
- 28.Sackler AM, Weltman AS. 1966. Effects of vibration on the endocrine system of male and female rats. Aerosp Med 37:158–166. [PubMed] [Google Scholar]
- 29.Thompson D. 2009. Railway noise and vibration: mechanisms, modelling, and means of control. Philadelphia (PA): Elsevier. [Google Scholar]
- 30.Toraason MA, Badger DW, Wright GL. 1980. Gastrointestinal response in rats to vibration and restraint. Environ Res 23:341–347. [DOI] [PubMed] [Google Scholar]
- 31.Touma C, Palme R, Sachser N. 2004. Analyzing corticosterone metabolites in fecal samples of mice: a noninvasive technique. Horm Behav 45:10–22. [DOI] [PubMed] [Google Scholar]
- 32.Touma C, Sachser N, Möstl E, Palme R. 2003. Effects of sex and time of day on metabolism and excretion of corticosterone in urine and feces of mice. Gen Comp Endocrinol 130:267–278. [DOI] [PubMed] [Google Scholar]
- 33.Wald DJ, Quitoriano V, Heaton TH, Kanamori H. 1999. Relationship between peak ground acceleration, peak ground velocity, and modified Mercalli intensity in California. Earthq Spectra 15:557–564. [Google Scholar]
- 34.Xie L, Jacobson JM, Choi ES, Busa B, Donahue LR, Miller LM, Rubin CT, Judex S. 2006. Low-level mechanical vibrations can influence bone resorption in the growing skeletion. Bone 39:1059–1066. [DOI] [PubMed] [Google Scholar]
- 35.Xie L, Rubin C, Judex S. 2008. Enhancement of the adolescent murine musculoskeletal system using low-level mechanical vibrations. J Appl Physiol 104:1056–1062. [DOI] [PubMed] [Google Scholar]
- 36.Yagi H, Takamura Y, Yoneda T, Konno D, Akagi Y, Yoshida K, Sato M. 2005. Vlgr1 knockout mice show audiogenic seizure susceptibility. J Neurochem 92:191–202. [DOI] [PubMed] [Google Scholar]
- 37.Zheng QY, Johnson KR, Erway LC. 1999. Assessment of hearing in 80 inbred strains of mice by ABR threshold analyses. Hear Res 130:94–107. [DOI] [PMC free article] [PubMed] [Google Scholar]


