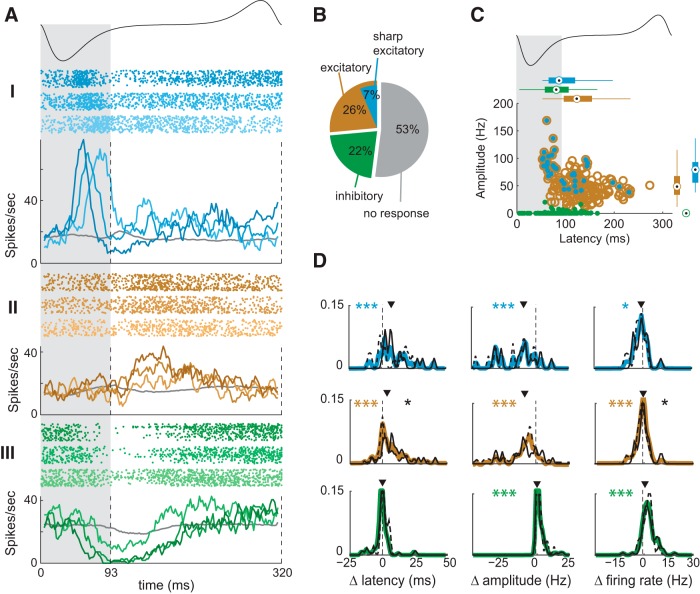
Figure 1.
MTC responses change with odor concentration. A, Sniff-warped raster and PSTH plots of sharp excitatory (I-cyan), excitatory (II-brown), and inhibitory (III-green) responses of individual MTCs for 3-fold and 10-fold changes in odor concentration (shown as color shades). Top, Schematic sniff waveform. Gray shading, Inhalation; gray trace, activity of the MTC during blank sniffs. Vertical dashed lines indicate the beginning and end of inhalation interval. B, Distribution of different response types observed in the data. C, Scatter plot comparing amplitude and latency of sharp, excitatory and inhibitory responses (color notations as in B). Boxplots show marginal response distributions: circle is median, thick line is the IQR, thin lines on either side extend to 1.5 × IQR beyond the 25% and 75% quartiles or the farthest data point, whichever is smaller. D, Normalized distributions of changes of latencies (left column), amplitude (central column), and firing rate (right column) with a threefold concentration change across cells for different response types (color notations as in B). Colored asterisks denote significance of test for zero median (*p < 0.05, **p < 0.01, ***p < 0.001; Wilcoxon rank sum test). Black solid and dashed lines show distributions of response latencies for early (<100 ms) and late (>100 ms) responses respectively. Black asterisks denote significant differences between two distributions. Arrows mark the position of the median.

