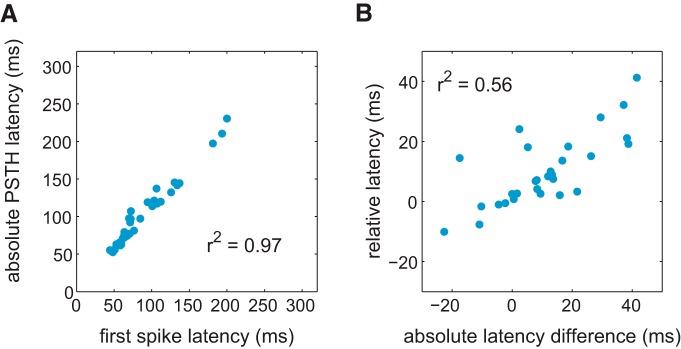
Figure 2.
A, Latency of the first spike estimated using distributions of interspike intervals (Shusterman et al., 2011) for responses identified as sharp pooled across all odors and concentrations versus the latency of the peak PSTH for the same response. B, Difference in absolute PSTH latency between sharp responses to high and 3× lower concentrations versus the relative latency estimated using cross-correlation (see Materials and Methods).

