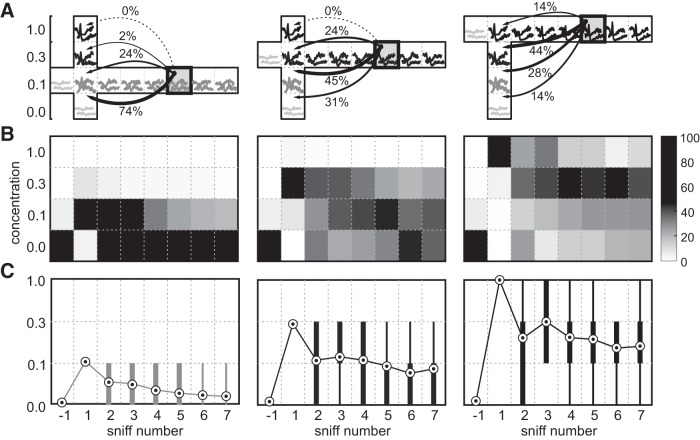
Figure 8.
Adaptation decreases the encoded odor concentration. Single-trial responses were classified based on their Euclidean distance to the average responses to the three concentrations presented on the first sniff and the average blank response. A, Schematics of the classification process for three concentrations (left, 0.1; middle, 0.3; right, 1.0). Responses on a given sniff and concentration (examples are shown in boxes) are classified against responses on the first sniff. The arrows from sniff 5 (shaded box) illustrate match probabilities between this sniff and responses on the first sniff. B, For each concentration (left to right), grayscale plots show the classifier match probability (see bar on right) for responses on a given sniff (x-axis) with the average concentration responses on the first sniff (y-axis). C, Equivalent concentration for each sniff calculated as the average match probability weighted by concentration (circles), and distributions of classification results: thin line is the 10-90% interval; and thick lines are the 25-75% interval.

