Abstract
Body water losses of >2 % of body mass are defined as hypohydration and can occur from sweat loss and/or diuresis from both cold and altitude exposure. Hypohydration elicits intracellular and extracellular water loss proportionate to water and solute deficits. Iso-osmotic hypovolemia (from cold and high-altitude exposure) results in greater plasma loss for a given water deficit than hypertonic hypovolemia from sweat loss. Hypohydration does not impair submaximal intensity aerobic performance in cold–cool environments, sometimes impairs aerobic performance in temperate environments, and usually impairs aerobic performance in warm–hot environments. Hypohydration begins to impair aerobic performance when skin temperatures exceed 27 °C, and with each additional 1 °C elevation in skin temperature there is a further 1.5 % impairment. Hypohydration has an additive effect on impairing aerobic performance in warm–hot high-altitude environments. A commonality of absolute hypovolemia (from plasma volume loss) combined with relative hypovolemia (from tissue vasodilation) is present when aerobic performance is impaired. The decrement in aerobic exercise performance due to hypohydration is likely due to multiple physiological mechanisms, including cardiovascular strain acting as the ‘lynchpin’, elevated tissue temperatures, and metabolic changes which are all integrated through the CNS to reduce motor drive to skeletal muscles.
Key Points
| Athletes performing exercise in warm-hot conditions have high sweat rates and ad libitum fluid consumption is often not sufficient to fully replace sweat losses (“voluntary dehydration”) and results in cumulative body water deficits. |
| A body water deficit of >2 % of body mass (~3 % of total body water for the average athlete) is defined as hypo hydration. |
| Hypohydration does not alter aerobic exercise performance in cold-cool conditions, sometimes impairs aerobic exercise performance in temperate conditions, and usually impairs aerobic exercise performance in warm-hot conditions. |
| When skin temperature exceeds 27 °C (81 °F), hypohydration impairs aerobic performance by an additional ~1 % for every 1 °C (1.8 °F) skin temperature elevation. |
Introduction
Body water and electrolyte balance perturbations are common when performing strenuous physical work and especially during exposure to the environmental extremes of heat [1], cold [2], and high altitude [3]. The resultant fluid and electrolyte losses often modify physiological strain to a particular exercise/environmental stress and sometimes impair environmental tolerance and aerobic exercise performance. Likewise, physiological modifications in fluid and electrolyte balances are consistently noted as normal physiological adaptations to these environmental extremes [4]. No single review has examined the importance of body water deficits on environmental tolerance and aerobic exercise performance during exposure to heat, cold, and high-altitude environments.
This paper provides a brief review of how body water deficits modify physiological function, sometimes environmental tolerance, and aerobic exercise performance during exposure to heat, cold, and high-altitude terrestrial environments. Prior reviews of body water deficits can be consulted that focused on body fluid balance [5], thermoregulation [6], hydration assessment [7], and exercise performance [7].
Fluid Balance and Body Water
Water (total body water) is the principal chemical constituent of the human body. For an average young adult male, total body water represents 50–70 % of body weight [8]. Variability in total body water is primarily due to differences in body composition. Lean body mass is ~73 % water and fat body mass is ~10 % water [9, 10]. Differences in total body water attributed to age, sex, and aerobic fitness are mostly accounted for by body composition.
Total body water is distributed into intracellular fluid (ICF) and extracellular fluid (ECF) compartments. The ICF and ECF contain ~65 % and ~35 % of total body water, respectively. The ECF is further divided into the interstitial and plasma spaces. An average 70-kg male has ~42 L of total body water, therefore ICF contains ~28 L of water, whereas the ECF contains ~14 L of water with ~3.2 L in plasma and ~10.8 L in interstitium. These are not static volumes, but represent the net effects of dynamic exchange [5].
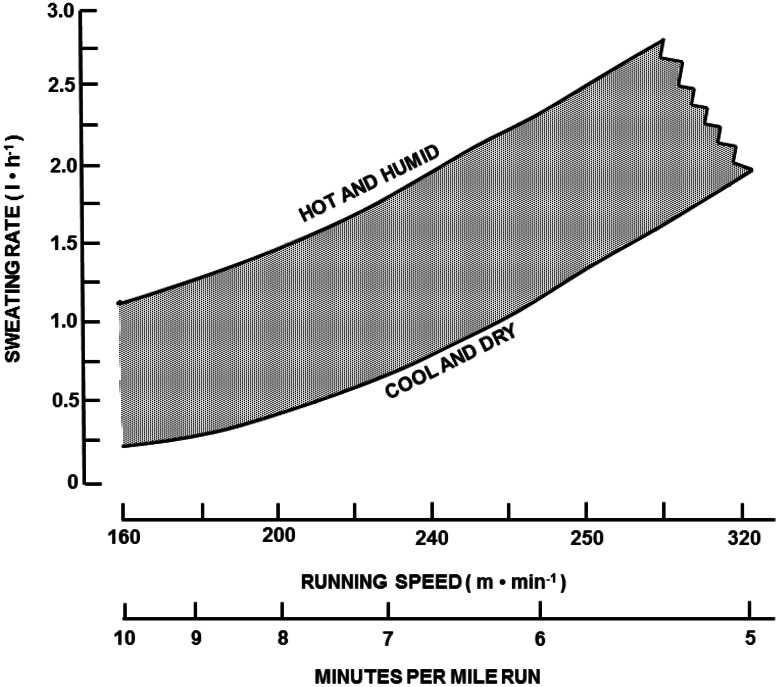
Approximately 5–10 % of total body water is turned over daily [11], distributed via obligatory (non-exercise) fluid loss avenues. Table 1 provides the sources of daily water losses and production for sedentary and active populations [12]. Respiratory water losses are influenced by the temperature and humidity of inspired air and the pulmonary ventilatory volume. Metabolic water is formed by oxidation of substrates and is roughly offset by respiratory water losses. Urine output generally approximates 1–2 L per day but can be increased by an order of magnitude when consuming large volumes of fluid. This large capacity to vary urine output represents the primary avenue to regulate net body water balance across a broad range of fluid intake volumes and losses from other avenues [13]. Sweat losses vary widely and depend upon the physical activity level and environmental conditions: with ambient temperature, radiant heat load, high humidity, and elevated metabolic rate all markedly elevating sweating requirements [14, 15]. Figure 1 provides an approximation of hourly sweating rates for athletes running at different speeds and exposed to different heat stress conditions [6]. Sweating rates of >1.0 L per hour are common due to either high metabolic rates and/or environmental heat stress.
Table 1.
Daily water losses and production
| Source | Loss (mL/day) | Production (mL/day) |
|---|---|---|
| Respiratory loss | −250 to –350 | |
| Urinary loss | −500 to –1000 | |
| Fecal loss | −100 to –200 | |
| Insensible loss | −450 to –1900 | |
| Metabolic production | +250 to +350a | |
| Total | −1300 to −3450 | +250 to +350 |
| Net loss (sedentary) | −1050 to −3100 | |
| Sweat losses in various sports | −455 to −3630 | |
| Net loss (athlete) | −1550 to −6730 |
Adapted from Sawka et al. [12], with permission
aMetabolic water production based on 2500–3000 kcal daily energy expenditure. Additional water production with exercise is assumed offset by parallel respiratory losses
Fig. 1.
Approximation of hourly sweating rates (L/h) for runners at different running paces (m/min or min per mile) and environmental conditions (hot and humid, cool and dry). Redrawn with permission from Sawka [6]
Net body water balance (loss = gain) is regulated remarkably well day-to-day as a result of thirst and hunger drives, coupled with ad libitum access to food and beverages to off-set water losses [7]. This is accomplished by an intricate interplay between neuroendocrine and renal responses to body water volume and tonicity changes [16], as well as non-regulatory social–behavioral factors [17]. These homeostatic responses collectively ensure that small degrees of over- and under-hydration are readily compensated for in the short term [13].
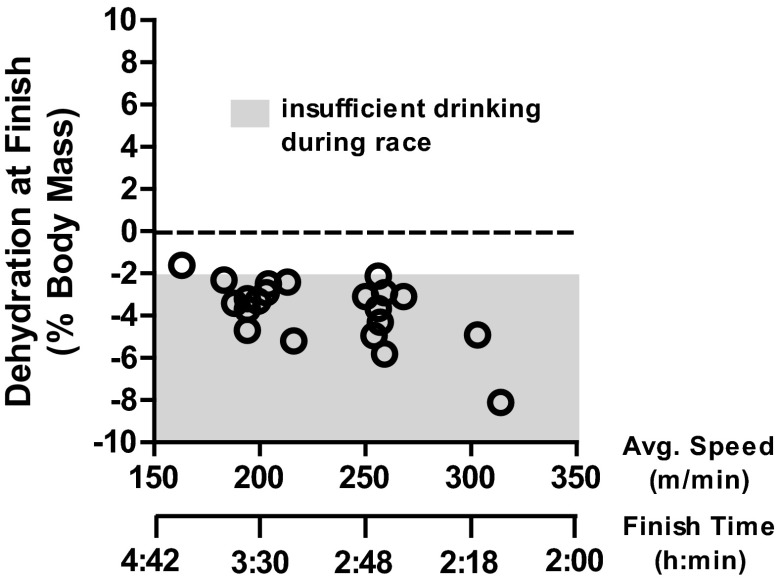
There is excellent support that, over many hours, if adequate fluid and food are available, these homeostatic responses allow humans to sustain euhydration [13, 18]. For example, an Institute of Medicine analysis of NHANES II data on the first to tenth deciles of individuals consuming fluid volumes demonstrated that serum osmolality values were similar and that all individuals were likely euhydrated [13]. However, during periods of high sweating rates, such as during strenuous physical exercise in hot weather, humans practicing ad libitum drinking can markedly under-consume fluids [18–22] and thus incur body water deficits [23, 24]. Figure 2 plots body water deficits incurred by marathon runners practicing ad libitum drinking at different paces, even in mild conditions ranging from cold to warm [25]. Note that most runners achieved body water deficits >2 % of body mass.
Fig. 2.
Plot of average running speed and finish time for 42 km versus the magnitude of post-race hypohydration (dehydration, % body mass loss) level at finish when drinking ad libitum. Redrawn with permission from Cheuvront et al. [25]
Body Water Deficits
Hypohydration is defined as a body water deficit greater than normal daily fluctuation [7]. Changes in hydration status can be assessed by a variety of body measures [26]; however, they all have specific limitations [7, 27]. Because of low measurement variability, changes in body mass provide the most sensitive and simplest measure to determine acute changes in body water for all types of dehydration [13, 16, 26]. Of course, body mass measures are dependent upon subjects remaining in energy balance and accurate book keeping of intake (e.g., food, fluid) and output (e.g., urine, feces). Body water deficits >2 % of body mass exceed 2 standard deviations in normal body mass variability [18, 28] and represent an approximate threshold, based on plasma volume reductions and plasma osmolality increases, where compensatory fluid regulatory actions occur [16]. Therefore, we define hypohydration as >2 % of body mass loss (~3 % of total body water) from water deficits [7, 24] as this has >95 % chance of exceeding normal daily fluctuations in body water.
Incomplete fluid replacement decreases total body water, and as a consequence of free fluid exchange, affects each fluid space [29, 30]. For example, Nose and colleagues [31] determined the distribution of body water loss among the fluid spaces as well as among different body organs during hypohydration. They thermally dehydrated rats by 10 % of body weight, and after the animals regained their normal core temperature, the body water measurements were obtained. The fluid deficit was apportioned between the ICF (41 %) and ECF (59 %) spaces. Regarding organ fluid loss, 40 % came from muscle, 30 % from skin, 14 % from viscera and 14 % from bone. Neither the brain nor liver lost significant water content as measured from wet and desiccated organ weights. They concluded that hypohydration results in water redistribution largely from the ICF and ECF spaces of muscle, gut and skin in order to defend blood volume.
Although earlier research measuring wet/dry weight of excised tissues suggested that with severe hypohydration (10 % of total body water) brain water content was preserved [31], recent studies employing functional magnetic resonance imaging (fMRI) suggest acute brain anatomical alterations with hypohydration consistent with fluid loss [32–34]. Brain ventricle volume has been demonstrated to expand with hypohydration [32, 33, 35], which would be consistent with fluid loss from surrounding brain tissues. Streitburger et al. [34] examined the impact of dehydration (~2 % of body mass incurred over 3 days) on brain gray matter, white matter, and cerebral spinal fluid by fMRI. They reported that dehydration decreased both gray matter and white matter volume in the temporal and sub-gyral parietal areas and left inferior orbito-frontal region and the extra-nuclear region. In addition, they corroborated that dehydration causes expansion of the ventricle system (lateral, third, fourth). These changes in brain structure gray matter remained fairly constant over the 3 days of chronic progressive dehydration. Therefore, hypohydration mediated changes in brain structure and function may alter the integration of afferent information during rest and exercise.
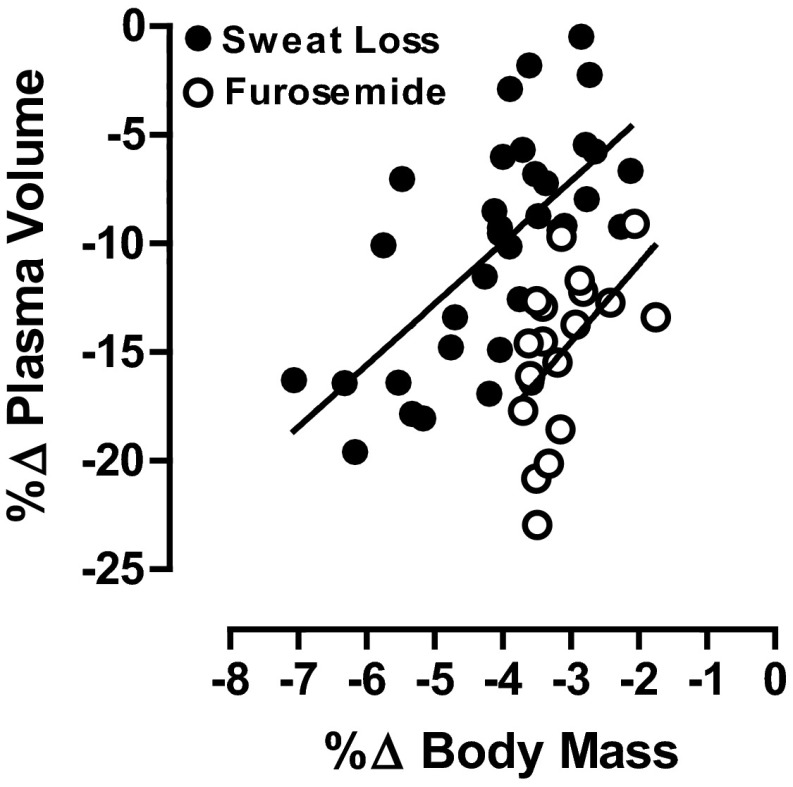
Sweat-induced hypohydration will decrease plasma volume and increase plasma osmotic pressure in proportion to the decrease in total body water [13, 36]. The reduction in plasma (blood) volume with the same vascular space size is often referred to as an absolute hypovolemia. Plasma volume decreases because it provides the fluid for sweat, and osmolality increases because sweat is hypotonic relative to plasma. Sodium is the primary ion responsible for the elevated plasma osmolality. The plasma hyperosmolality acts to mobilize fluid from the intracellular to the extracellular space to enable plasma volume defense in hypohydrated subjects [5]. Diuretics (e.g., furosemide) can be used to model the type of water and solute loss observed in cold and high terrestrial altitude environments [7]. Diuretic-induced hypohydration generally results in an iso-osmotic hypovolemia, with a much greater ratio of plasma loss to body water loss than either exercise or heat-induced hypohydration. Relatively less intracellular fluid is lost after diuretic administration, since there is no extracellular solute excess to allow osmotic redistribution of water from the intracellular space [16]. Figure 3 provides plasma volume reductions with hypohydration (percent change in body mass) after sweat-induced (hypertonic) and diuretic-induced (isotonic) body water deficits [37]. Consistent with this, the environmental stressors of cold [38] and high altitude [3] stimulate diuresis with solute losses, thus inducing an isotonic hypovolemia.
Fig. 3.
Linear regression of plasma volume change (%∆ plasma volume) and hypohydration level (%∆ body mass) after induction of hypotonic (sweat) and isotonic (diuretic) body water losses. Redrawn with permission from Cheuvront et al. [37]
Environmental Temperatures and Exercise Performance
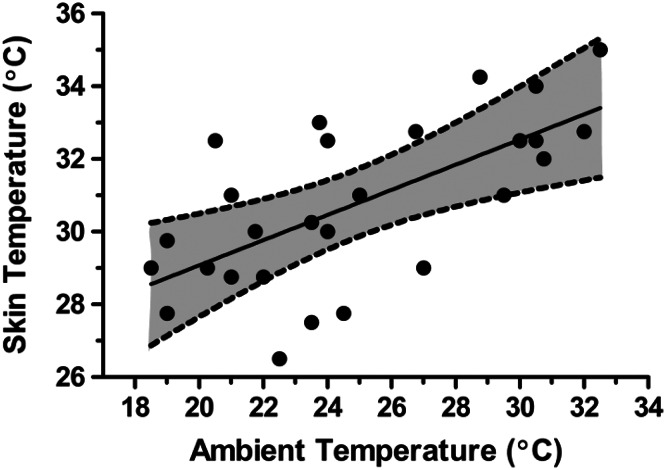
During exercise in the heat, the most significant physiological burden is to support high skin blood flow for heat dissipation [39, 40]. Skin temperature (Tsk) is elevated in proportion to ambient temperature and humidity [41], while core temperature (Tc) is elevated in proportion to exercise intensity and is largely independent of the environment during compensable heat stress [1, 39]. Warm–hot skin is associated with a greater skin blood flow and cutaneous venous compliance, which augments cardiovascular strain [1, 39]. The increase in vascular fluid volume (such as from cutaneous vasodilation and compliance) with no change in plasma (blood) volume is often referred to as relative hypovolemia. Figure 4 illustrates the approximate relationship between ambient temperature conditions and skin temperature during aerobic exercise while wearing minimal clothing [42]. For this review, we define cool/cold skin as <30 °C, warm skin as 30–34.9 °C and hot skin as 35 °C and above. We recognize that skin temperature effects are a continuum and the Tsk to Tc gradient alters these relationships.
Fig. 4.
Relationship (regression line) between ambient (shaded dry bulb) temperature (°C) and skin temperature (°C) during aerobic exercise while wearing minimal clothing. The broken lines and grey shading represent 95 % confidence intervals. Figure was drawn from data in Adams [42]
Table 2 illustrates the effects of different Tsk and Tc combinations on estimated whole body skin blood flow requirements calculated from the equation of Rowell [43] applied to exercise-heat stress. An elevated Tsk increases skin blood flow at any given Tc, while an elevated Tc reduces skin blood flow requirements at any given Tsk. An often under-appreciated point is at any given skin temperature, an elevation in core temperature reduces whole body skin blood flow and can be viewed as a positive response for sustaining aerobic performance in the heat. Generally, warmer skin is associated with greater skin blood flow responses and greater heart rate elevations during exercise in the heat [39, 40]. The result is a reduction in cardiac filling and a challenge to sustain blood pressure [44].
Table 2.
Estimated whole body skin blood flow (SkBF) requirementsa during prolonged, severe running exerciseb at different body core (T c) and skin (T sk) temperatures
| T c (°C) | T sk (°C) | Gradient (°C) | SkBF (L/min) |
|---|---|---|---|
| 38 | 30 | 8 | 1.1 |
| 38 | 34 | 4 | 2.2 |
| 38 | 36 | 2 | 4.4 |
| 39 | 36 | 3 | 2.9 |
Adapted from Kenefick et al. [66], with permission
aEquation for skin blood flow: Q s = 1/C × h/(T c−T sk), where, C specific heat of blood ≈0.87 kcal/°C/L, h heat production (kcal/min), Q s skin blood flow [43]
bNet heat production (7.7 kcal/min) estimated using 60 kg body mass and 325 m/min running velocity (approximate pace for men’s world class 42 km footrace) after subtracting for work (20 % efficiency) and 50 % dry and evaporative heat losses
It is important to recognize that when skin temperature is elevated there is an increased requirement on sweat secretion and evaporation to regulate body temperature. Thus, during exercise in the heat with high sweat rates, there is the simultaneous problem of reduced plasma volume from hypohydration while skin blood flow requirements are elevated. It will be discussed later (Sect. 6: Mechanisms of Impaired Aerobic Performance) that the dual perturbation of reduced plasma volume (absolute hypovolemia) with increased skin blood flow (relative hypovolemia) is likely an important physiological prerequisite to impair aerobic performance.
It is generally accepted that heat stress alone will impair aerobic performance [40], and that cold stress alone does not impair aerobic performance unless the temperature is sufficient to adversely impact on skeletal muscle function and nerve conduction [45]. The earliest scientific experiments regarding body water deficits and exercise capacity were conducted by the military and clearly concluded that in hot environments fluid replacement better sustained marching and military endurance performance in laboratory and field trials [19, 20, 46]. Subsequently, submaximal intensity and maximal intensity aerobic performance tests were developed and widely employed. Physiological reviews examining the impact of water deficits on submaximal and maximal aerobic performance again concluded that hypohydration impaired aerobic performance in warm and hot environments [6, 7, 13, 47, 48]. Despite these consistent findings, there has recently been some controversy within the sporting community regarding these points [49].
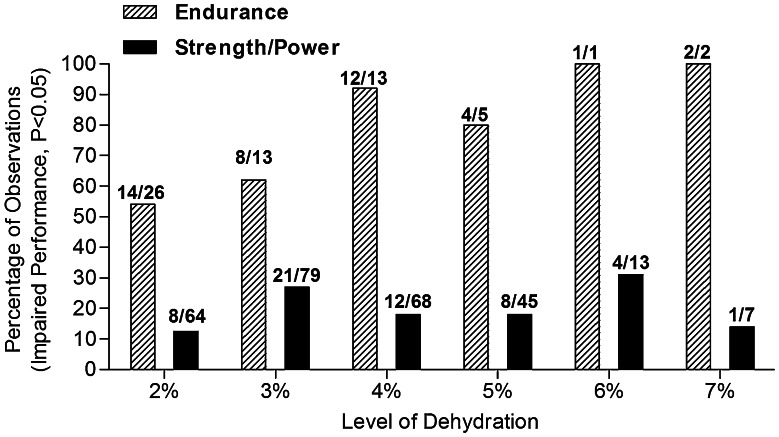
Figure 5 provides the summary of a literature review on hypohydration level effects on endurance (34 studies) and strength/power (43 studies) performance [7]. Consistent with what had been concluded by others [13, 24], body water deficits usually did not appear to significantly impair strength/power tasks. In contrast, endurance performance was significantly impaired in the vast majority of studies when body water deficits exceeded 3 % of body mass. However, that particular literature analysis did not factor in the impact of environmental heat stress [7].
Fig. 5.
Summary of a literature review of hypohydration level (percent change in body mass) effects on endurance (34 studies) and power (43 studies) performance. The y axis is the percentage of observations that demonstrated impaired performance (P < 0.05) with the appropriate fraction above each data bar. Redrawn with permission from Cheuvront and Kenefick [7]
Table 3 provides a review of studies examining the impact of hypohydration (≥2 % body mass) on submaximal aerobic performance, ordered by the ambient temperature in which the exercise protocols were conducted (cold on top and uncompensable heat stress on the bottom). It is assumed that this approximates the severity of heat strain; however, since evaporative requirements and maximal environmental evaporative capacities were not reported, this order might not be precise. Submaximal aerobic performance was evaluated by either time-to-exhaustion (TTE) or time-trial (TT) protocols, and since the TTE protocols are generally longer in duration they might be expected to demonstrate larger percentage changes than the TT protocols [40]. During cold stress (2 and 10 °C) environments, hypohydration did not (0 of 2 studies) alter aerobic performance. During temperate conditions (20–24 °C), hypohydration sometimes (4 of 7 studies) impaired aerobic performance. During warm–hot conditions (>25 °C to uncompensable heat stress), hypohydration usually (8 of 9 studies) impaired aerobic performance.
Table 3.
Review of literature on impact of ambient temperature on hypohydration effects on submaximal aerobic performance
| Study | N | Test | Environment (°C) | BML (%) | Reduction (%) |
|---|---|---|---|---|---|
| Cheuvront et al. [52] | 8 | TT | 2 | 3 | ND |
| Kenefick et al. [50] | 8 | TT | 10 | 4 | ND |
| Fallowfield et al. [67] | 8 | TTE | 20 | 2 | −24 |
| Oliver et al. [68] | 13 | TT | 20 | 3 | ND |
| Cheuvront et al. [52] | 8 | TT | 20 | 3 | −8 |
| Kenefick et al. [50] | 8 | TT | 20 | 4 | ND |
| McConell et al. [69] | 8 | TT | 21 | 2 | ND |
| McConell et al. [70] | 7 | TTE | 21 | 3 | −47 |
| Merry et al. [71] | 12 | TT | 24 | 2 | −9 |
| Castellani et al. [51] | 7 | TT | 27 | 4 | −17 |
| Ebert et al. [72] | 8 | TT | 29 | 2 | −29 |
| Kenefick et al. [50] | 8 | TT | 30 | 4 | −12 |
| Below et. al. [73] | 8 | TT | 31 | 2 | −6 |
| Walsh et al. [74] | 6 | TTE | 32 | 2 | −31 |
| Cheung et al. [76] | 11 | TT | 35 | 3 | ND |
| Kenefick et al. [50] | 8 | TT | 40 | 4 | −23 |
| Cheung and McLellan [75] | 15 | TTE | UCHS | 2 | −14 |
| Sawka et al. [77] | 17 | TTE | UCHS | 5 | −54 |
BML body mass loss, ND no determination, TT time-trial performance test, TTE time to exhaustion performance test, UCHS uncompensable heat stress
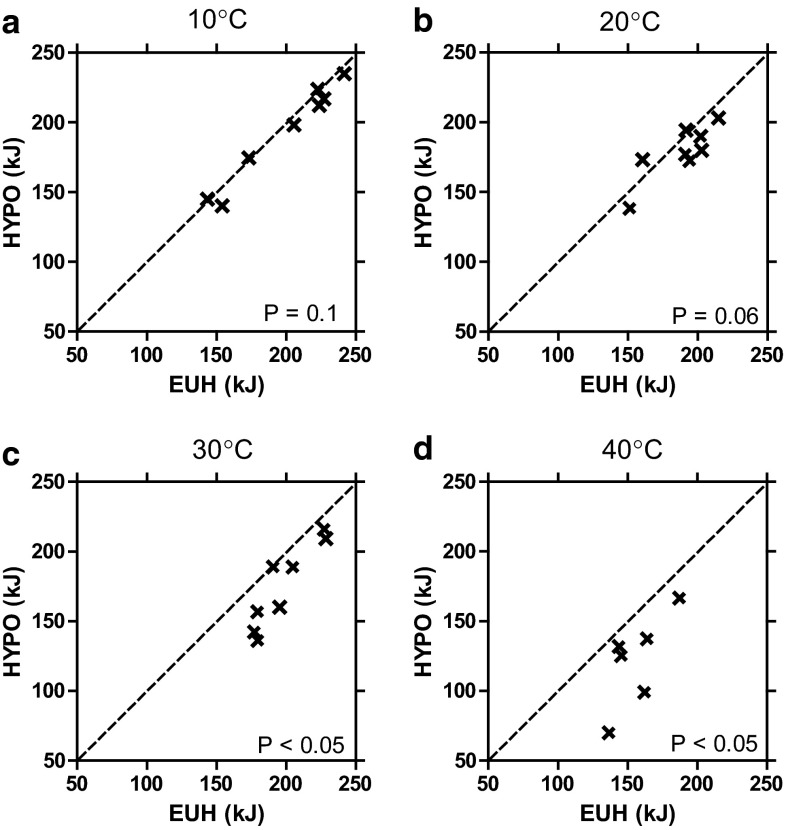
Figure 6 provides individual subject data for the only study to examine the impact of submaximal aerobic performance at a variety of environmental conditions using similar protocols [50]. Note in the 10 and 20 °C environments, aerobic performance was not different when euhydrated and hypohydrated; however, in the warm (30 °C) and hot (40 °C) environments, aerobic performance was impaired. It can be noted that as ambient temperature increased there was almost always an impaired aerobic performance. Therefore, although occasional individual exceptions might be found, almost all subjects demonstrated hypohydration-mediated impaired aerobic performance in warm and hot environments.
Fig. 6.
Individual data for time-trial performance (kJ) when euhydrated (EUH) and hypohydrated (HYPO, 4 % body mass loss) in a 10 °C, b 20 °C, c 30 °C and d 40 °C environments. Adapted with permission from Kenefick et al. [50]
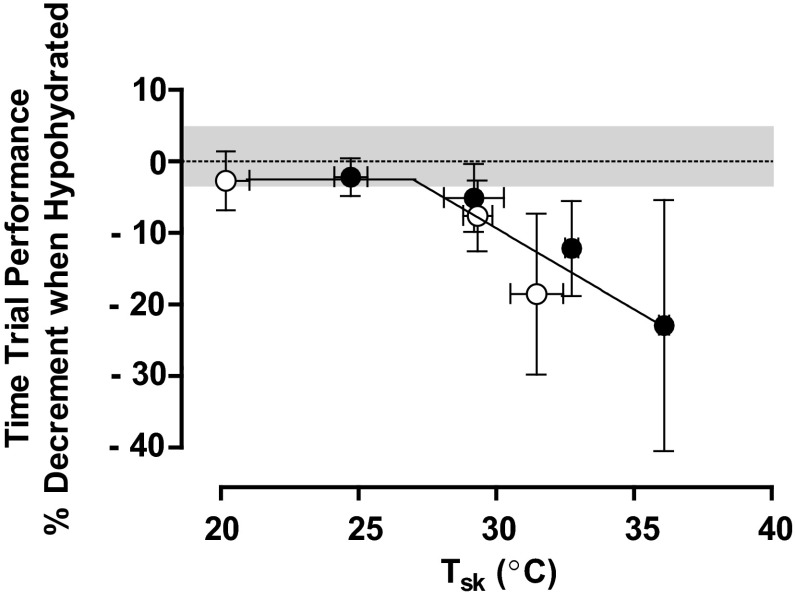
Figure 7 plots the impact of hypohydration on submaximal aerobic performance from several hypohydration studies [50–52] conducted in our laboratory [53]. These studies employed similar procedures over a broad range of Tsk from 20 to 36 °C. Performance was plotted as a function of Tsk, as modifiers of environmental evaporative capacity will have a direct effect on this parameter. Segmented regression was used to approximate the statistical Tsk threshold for performance impairment using individual study data points (n = 53 paired observations). The threshold which best minimized the residual sums of squares was shown as 27.3 °C and warmer skin accentuated the performance impairment by ~1.5 % for each additional 1 °C rise in Tsk. Therefore, as ambient conditions become warmer and elevate cutaneous vasodilation, the adverse impact of hypohydration is clearly demonstrated [53].
Fig. 7.
Percentage impairment in submaximal intensity aerobic performance (time-trial) from euhydration as a function of skin temperature (T sk) when hypohydrated by 3–4 % of body mass. Regression line indicates that at a T sk intercept of ~27 °C, the percentage decrement in aerobic exercise performance declines linearly by ~1.3 % for each 1 °C rise in T sk. The best-fit equation for the second linear line segment is y = −1.26x + 26.37. Data are means [error bars are 95 % confidence interval] for paired observations from three studies [50–52]. Filled circles represent 15-min time-trial tests, open circles represent 30-min time-trial tests. Gray area represents the collective percent coefficient of variation of repeated practice time-trials (when euhydrated) in temperate conditions (~3.5 %). Adapted with permission from Sawka et al. [53]
In addition to impaired submaximal intensity aerobic performance, hypohydration has been reported to consistently impair maximal intensity aerobic performance. Several previous review papers have addressed the maximal intensity aerobic performance impairment and can be consulted [7, 47].
Terrestrial High Altitude
Physical exertion at high altitude likely induces sweat rates comparable to those at sea level for a given heat strain [15], and respiratory water loss is elevated at high altitude [3]. Furthermore, with high-altitude exposure there is a proportionate reduction in plasma volume that is due to both diuresis and reduced plasma proteins [54]. Therefore, at high altitude, hypohydration can occur from both sweat loss and adaptations to that environment. In addition, acute high-altitude exposure induces cutaneous and skeletal muscle vasodilation during exercise, thus possibly inducing relative hypovolemia [55].
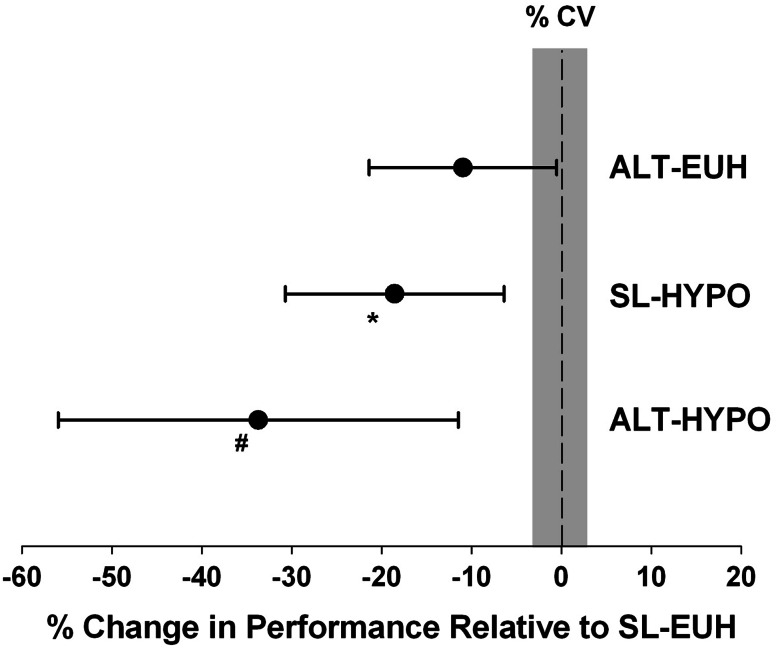
Castellani and colleagues [51] examined the impact of hypohydration (4 % body mass) on aerobic performance. Their subjects performed time-trial tests in a warm environment (27 °C) when euhydrated and hypohydrated at both sea level and simulated high altitude (3048 m). Figure 8 provides the percent change in aerobic performance from euhydration sea level to euhydration high-altitude, sea-level hypohydration and high-altitude hypohydration trials. They found that compared with aerobic performance at sea level when euhydrated, performance was impaired by −17 % with sea-level hypohydration, −11 % when euhydrated at high altitude and −34 % when hypohydrated at high altitude. Therefore, altitude and hypohydration had additive effects on impairing performance.
Fig. 8.
Percent change in aerobic performance (time-trial) from euhydrated sea-level (SL-EUH) [zero reference] when euhydrated at high altitude (ALT-EUH), hypohydrated at sea level (SL-HYPO) or hypohydrated at high altitude (ALT-HYPO). Environmental temperature is 27 °C, high altitude is 3048 m, hypohydration is 4 % body mass loss and coefficient of variation (CV) is 3.1 %. Gray area represents collective percent coefficient of variation of repeated practice time-trials (when euhydrated). *P = 0.04, # P < 0.001. Data are mean and the error bars represent the 95 % confidence intervals. Adapted with permission from Castellani et al. [51]
Mechanisms of Impaired Aerobic Performance
Hypohydration impairs aerobic performance when heat stress is present and this adverse impact is accentuated with high-altitude exposure. Heat stress is unique because it induces considerable cardiovascular strain to support skin blood flow requirements to the induced hyperthermia (elevated skin and usually core temperatures). Nybo and colleagues [40] recently provided an extensive review of physiological mechanisms impairing aerobic performance in warm–hot environments and proposed an integrated model. Those authors concluded that “One simple explanation for the underlying physiological mechanisms will not suffice, because a variety of factors change in parallel and some factors may affect performance independently or they may interact with other hyperthermia or exercise-induced factors”. Table 4 briefly summarizes the physiological mechanisms impairing aerobic performance during heat stress as summarized by Nybo and colleagues [40]. It is critical to note that hypohydration exacerbates all of the proposed physiological mechanism(s) thought to limit aerobic performance from just heat stress alone.
Table 4.
Physiological mechanisms potentially contributing to impaired exercise performance in warm–hot environments
| System | Examples of mechanisms |
|---|---|
| Cardiovascular | Blood pressure, blood flow to brain and skeletal muscles, oxygen delivery and metabolite removal |
| Central nervous system and neurobiological | Cerebral metabolism, neurotransmitter levels, temperature |
| Peripheral muscular factors | Temperature, metabolic, afferent feedback |
| Psychological | Thermal comfort, rating of perceived exertion, motivation and expectations |
| Respiration | Hypocapnia, alkalosis, breathing sensations |
Adapted from Nybo et al. [40]
Several examples of how hypohydration exacerbated the physiological mechanism(s) associated with impaired aerobic performance in the heat are provided. It is well recognized that hypohydration will further increase cardiovascular strain and make it more difficult to sustain the required cardiac output during aerobic exercise [56, 57]; hypohydration can impair skeletal muscle blood flow [58] while heat stress alone does not. Hypohydration restricts cerebral blood flow (but likely not cerebral oxygen uptake) during high-intensity exercise in the heat [59]. Likewise, hypohydration elevates core temperature [36], skeletal muscle glycogen usage [60], fatigue/discomfort [61], respiratory alkalosis [62], afferent feedback [63], skeletal muscle motor-unit recruitment [64], and brain function [33]. Clearly, a multitude of physiological mechanism(s) contributing to impaired exercise-heat performance [40] are further aggravated by hypohydration [7], thus providing mechanism(s) for the hypohydration-impaired aerobic performance during heat stress.
Simultaneous absolute hypovolemia and relative hypovolemia appears to be a prerequisite for hypohydration to impair aerobic performance. Both types of hypovolemia elevate cardiovascular strain and thus we believe that challenges to blood pressure regulation often may be a ‘lynchpin’ mechanism in impairing aerobic performance with hypohydration [19, 39, 40]. It should be noted that the frequent ‘sporting literature’ explanation of hyperthermia-induced fatigue of a ‘critical core temperature’ is poorly supported by physiological studies [37, 40, 53]. As previously discussed (Sect. 4, paragraph 2), a moderately elevated core temperature as induced by hypohydration [13, 19, 36] can likely often be beneficial in reducing skin blood flow requirements, thus helping to minimize cardiovascular strain and sustain aerobic performance [39, 45, 53]. In addition, thirst might contribute to impaired performance.
Table 4 does not include a recent study [65] that purports that hypohydration with warm skin does not impair aerobic exercise performance. Wall and colleagues [65] employed intravenous infusion to partially rehydrate subjects, and showed that despite a 3 % body mass loss, time-trial performance was not altered. Importantly, their subjects’ heart rate responses were not elevated by hypohydration while performing exercise at the same intensity as when euhydrated. Studies employing hypohydration with exercise at a given intensity will consistently demonstrated elevated heart rates. This strongly suggests that the saline infusions likely restored plasma volume and cardiac preload (thus filling) to negate the adverse cardiovascular impact of hypohydration (i.e., absolute hypovolemia).
Conclusions
Hypohydration accentuates the aerobic performance impairments observed in hot and high-altitude environments. Impaired aerobic performance when hypohydrated during heat stress has been consistently reported for decades for both laboratory and field trials, and numerous physiological mechanisms have been identified to explain such impairments. All of the physiological mechanisms believed to impair aerobic performance with heat stress alone are markedly aggravated further with hypohydration. It is possible that simultaneous absolute and relative hypovolemia is a prerequisite for performance impairments in warm–hot and high-altitude environments and that the cardiovascular system often is the important ‘lynchpin’ for impairing aerobic performance when hypohydrated.
Acknowledgments
This article was published in a supplement supported by the Gatorade Sports Science Institute (GSSI). The supplement was guest edited by Lawrence L. Spriet who attended a meeting of the GSSI expert panel (XP) in March 2014 and received honoraria from GSSI for his participation in the meeting. He received no honoraria for guest editing the supplement. Dr. Spriet selected peer reviewers for each paper and managed the process. Michael Sawka, PhD also attended the GSSI XP meeting in March 2014 and received honoraria from the GSSI, a division of PepsiCo, Inc., for his meeting participation and the writing of this manuscript. The views expressed in this manuscript are those of the author and do not necessarily reflect the position or policy of PepsiCo, Inc. The opinions or assertions contained herein are the private views of the authors and should not be construed as official or reflecting the views of the Army or the Department of Defense. Approved for public release: distribution unlimited.
References
- 1.Sawka MN, Wenger CB, Pandolf KB. Thermoregulatory responses to acute exercise-heat stress and heat acclimation. In: Fregly MJ, Blatteis CM, editors. Handbook of physiology, section 4, environmental physiology. New York: Oxford University Press; 1996. pp. 157–185. [Google Scholar]
- 2.Freund BJ, Young AJ. Environmental influences body fluid balance during exercise:cold exposure. In: Buskirk ER, Puhl SM, editors. Body fluid balance: exercise and sport. New York: CRC Press; 1996. pp. 159–181. [Google Scholar]
- 3.Hoyt RW, Honig A. Body fluid and energy metabolism at high altitude. In: Am. Physiol. Soc., editor. Handbook of physiology: environmental physiology. Bethesda; 1996. p. 1277–89.
- 4.Sawka MN. Body fluid responses and hypohydration during exercise-heat stress. In: Pandolf KB, Sawka MN, Gonzalez RR, editors. Human performance physiology and environmental medicine at terrestrial extremes. Indianapolis: Cooper Publishing Group; 1988. pp. 227–266. [Google Scholar]
- 5.Mack GW, Nadel ER. Body fluid balance during heat stress in humans. In: Fregly MJ, Blatteis CM, editors. Handbook of physiology: environmental physiology. New York: Oxford University Press; 1996. pp. 187–214. [Google Scholar]
- 6.Sawka MN. Physiological consequences of hydration: exercise performance and thermoregulation. Med Sci Sports Exerc. 1992;24:657–670. [PubMed] [Google Scholar]
- 7.Cheuvront SN, Kenefick RW. Dehydration: physiology, assessment, and performance effects. Compr Physiol. 2014;4:257–285. doi: 10.1002/cphy.c130017. [DOI] [PubMed] [Google Scholar]
- 8.Altman P. Blood and other body fluids. Washington, D.C.: Federation of American Societies for Experimental Biology; 1961. [Google Scholar]
- 9.Van Loan M. Age, gender, and fluid balance. In: Buskirk ER, Puhl SM, editors. Body fluid balance: exercise and sport. Boca Raton: CRC Press; 1996. pp. 215–230. [Google Scholar]
- 10.Wang Z, Deurenberg P, Wang W, et al. Hydration of fat-free body mass: review and critique of classic body composition constant. Am J Clin Nutr. 1999;69:833–841. doi: 10.1093/ajcn/69.5.833. [DOI] [PubMed] [Google Scholar]
- 11.Raman A, Schoeller DA, Subar AF, et al. Water turnover in 458 American adults 40–79 yr of age. Am J Physiol Renal Physiol. 2004;286:F394–F401. doi: 10.1152/ajprenal.00295.2003. [DOI] [PubMed] [Google Scholar]
- 12.Sawka MN, Cheuvront SN, Carter R., III Human water needs. Nutr Rev. 2005;63:S30–S39. doi: 10.1111/j.1753-4887.2005.tb00152.x. [DOI] [PubMed] [Google Scholar]
- 13.Institute of Medicine . Dietary reference intakes for water, potassium, sodium, chloride, and sulfate. Washington, D.C.: The National Academies Press; 2005. [Google Scholar]
- 14.Gonzalez RR, Cheuvront SN, Ely BR, et al. Sweat rate prediction equations for outdoor exercise with transient solar radiation. J Appl Physiol. 2012;112:1300–1310. doi: 10.1152/japplphysiol.01056.2011. [DOI] [PubMed] [Google Scholar]
- 15.Gonzalez RR, Kenefick RW, Muza SR, et al. Sweat rate and prediction validation during high-altitude treks on Mount Kilimanjaro. J Appl Physiol. 2013;114:436–443. doi: 10.1152/japplphysiol.01176.2012. [DOI] [PubMed] [Google Scholar]
- 16.Cheuvront SN, Kenefick RW, Charkoudian N, et al. Physiologic basis for understanding quantitative dehydration assessment. Am J Clin Nutr. 2013;97:455–462. doi: 10.3945/ajcn.112.044172. [DOI] [PubMed] [Google Scholar]
- 17.Rolls B, Rolls E. Thirst. Cambridge: Cambridge University Press; 1982. [Google Scholar]
- 18.Adolph EF, Dill DB. Observations on water metabolism in the desert. Am J Physiol. 1938;123:369–499. [Google Scholar]
- 19.Adolph EF. Physiology of man in the desert. New York: Intersciences Publishers, Inc.; 1947. [Google Scholar]
- 20.Bean WB, Eichna LW. Performance in relation to environmental temperature: reactions of normal young men to simulated desert environment. Fed Proc. 1945;2:144–158. [Google Scholar]
- 21.Greenleaf JE, Sargent F., II Voluntary dehydration in man. J Appl Physiol. 1965;20:719–724. doi: 10.1152/jappl.1965.20.4.719. [DOI] [PubMed] [Google Scholar]
- 22.Greenleaf JE, Brock PJ, Keil LC, et al. Drinking and water balance during exercise and heat acclimation. J Appl Physiol. 1983;54:414–419. doi: 10.1152/jappl.1983.54.2.414. [DOI] [PubMed] [Google Scholar]
- 23.Cheuvront SN, Haymes EM. Ad libitum fluid intakes and thermoregulatory responses of female distance runners in three environments. J Sports Sci. 2001;19:845–854. doi: 10.1080/026404101753113796. [DOI] [PubMed] [Google Scholar]
- 24.Sawka MN, Burke LM, Eichner ER, et al. American College of Sports Medicine position stand. Exercise and fluid replacement. Med Sci Sports Exerc. 2007;39:377–390. doi: 10.1249/01.mss.0000272779.34140.3b. [DOI] [PubMed] [Google Scholar]
- 25.Cheuvront SN, Montain SJ, Sawka MN. Fluid replacement and performance during the marathon. Sports Med. 2007;37:353–357. doi: 10.2165/00007256-200737040-00020. [DOI] [PubMed] [Google Scholar]
- 26.Cheuvront SN, Ely BR, Kenefick RW, et al. Biological variation and diagnostic accuracy of dehydration assessment markers. Am J Clin Nutr. 2010;92:565–573. doi: 10.3945/ajcn.2010.29490. [DOI] [PubMed] [Google Scholar]
- 27.Kenefick R, Cheuvront S, Leon L, et al. Dehydration and rehydration. In: Auerbach P, et al., editors. Textbook of wilderness medicine. 6. Philadelphia: Mosby Elsevier; 2011. pp. 1393–1405. [Google Scholar]
- 28.Cheuvront SN, Carter R, III, Montain SJ, et al. Daily body mass variability and stability in active men undergoing exercise-heat stress. Int J Sport Nutr Exerc Metab. 2004;14:532–540. doi: 10.1123/ijsnem.14.5.532. [DOI] [PubMed] [Google Scholar]
- 29.Costill DL, Coté R, Fink W. Muscle water and electrolytes following varied levels of dehydration in man. J Appl Physiol. 1976;40:6–11. doi: 10.1152/jappl.1976.40.1.6. [DOI] [PubMed] [Google Scholar]
- 30.Durkot MJ, Martinez O, Brooks-McQuade D, et al. Simultaneous determination of fluid shifts during thermal stress in a small animal model. J Appl Physiol. 1986;61:1031–1034. doi: 10.1152/jappl.1986.61.3.1031. [DOI] [PubMed] [Google Scholar]
- 31.Nose H, Morimoto T, Ogura K. Distribution of water losses among fluid compartments of tissues under thermal dehydration in the rat. Jpn J Physiol. 1983;33:1019–1029. doi: 10.2170/jjphysiol.33.1019. [DOI] [PubMed] [Google Scholar]
- 32.Kempton M, Ettinger U, Schmechtig A, et al. Effect of acute dehydration on brain morphology in healthy humans. Hum Brain Mapp. 2009;30:291–298. doi: 10.1002/hbm.20500. [DOI] [PMC free article] [PubMed] [Google Scholar]
- 33.Kempton M, Ettinger U, Foster R, et al. Dehydration affects brain structure and function in healthy adolescents. Hum Brain Mapp. 2011;32:71–79. doi: 10.1002/hbm.20999. [DOI] [PMC free article] [PubMed] [Google Scholar]
- 34.Streitburger D, Moller H, Tittgemeyer M, et al. Investigating structural brain changes of dehydration using voxel-based morphometry. PLoS One. 2012;7:e44195. doi: 10.1371/journal.pone.0044195. [DOI] [PMC free article] [PubMed] [Google Scholar]
- 35.Dickson JM, Weavers HM, Mitchell N, et al. The effects of dehydration on brain volume—preliminary results. Int J Sports Med. 2005;26:481–485. doi: 10.1055/s-2004-821318. [DOI] [PubMed] [Google Scholar]
- 36.Sawka MN, Young AJ, Francesconi RP, et al. Thermoregulatory and blood responses during exercise at graded hypohydration levels. J Appl Physiol. 1985;59:1394–1401. doi: 10.1152/jappl.1985.59.5.1394. [DOI] [PubMed] [Google Scholar]
- 37.Cheuvront SN, Kenefick RW, Montain SJ, et al. Mechanisms of aerobic performance impairment with heat stress and dehydration. J Appl Physiol. 2010;109:1989–1995. doi: 10.1152/japplphysiol.00367.2010. [DOI] [PubMed] [Google Scholar]
- 38.Young AJ, Muza SR, Sawka MN, et al. Human vascular fluid responses to cold stress are not altered by cold acclimation. Undersea Biomed Res. 1987;14:215–228. [PubMed] [Google Scholar]
- 39.Sawka MN, Leon LR, Montain SJ, et al. Integrated physiological mechanisms of exercise performance, adaptation, and maladaptation to heat stress. Compr Physiol. 2011;1:1883–1928. doi: 10.1002/cphy.c100082. [DOI] [PubMed] [Google Scholar]
- 40.Nybo L, Rasmussen P, Sawka MN. Performance in the heat-physiological factors of importance for hyperthermia-induced fatigue. Compr Physiol. 2014;4:657–689. doi: 10.1002/cphy.c130012. [DOI] [PubMed] [Google Scholar]
- 41.Gagge AP, Gonzalez RR. Mechanisms of heat exchange: biophysics and physiology. In: Fregly MJ, Blatteis CM, editors. Handbook of physiology: environmental physiology. Bethesda: American Physiological Society; 1996. pp. 45–84. [Google Scholar]
- 42.Adams WC. Influence of exercise mode and selected ambient conditions on skin temperature. Ann N Y Acad Sci. 1977;301:110–127. doi: 10.1111/j.1749-6632.1977.tb38191.x. [DOI] [PubMed] [Google Scholar]
- 43.Rowell LB. Human circulation: regulation during physical stress. New York: Oxford University Press; 1986. pp. 363–406. [Google Scholar]
- 44.Rowell LB, Murray JA, Brengelmann GL, et al. Human cardiovascular adjustments to rapid changes in skin temperature during exercise. Circ Res. 1969;24:711–724. doi: 10.1161/01.RES.24.5.711. [DOI] [PubMed] [Google Scholar]
- 45.Sawka MN, Castellani JW, Cheuvront SN, et al. Physiological Systems and their responses to conditions of heat and cold. In: Farrell PA, Joyner MJ, Caiozzo VJ, editors. ACSM’s advanced exercise physiology. 2nd ed. Baltimore: Lippincott, Willimans & Wilkins; 2011. p. 567–602.
- 46.Ladell WSS. The effects of water and salt intake upon the performance of men working in hot and humid environments. J Physiol. 1955;127:11–46. doi: 10.1113/jphysiol.1955.sp005235. [DOI] [PMC free article] [PubMed] [Google Scholar]
- 47.Sawka MN, Francesconi RP, Young AJ, et al. Influence of hydration level and body fluids on exercise performance in the heat. JAMA. 1984;252:1165–1169. doi: 10.1001/jama.1984.03350090041020. [DOI] [PubMed] [Google Scholar]
- 48.Sawka MN, Coyle EF. Influence of body water and blood volume on thermoregulation and exercise performance in the heat. Exerc Sport Sci Rev. 1999;27:167–218. [PubMed] [Google Scholar]
- 49.Sawka MN, Noakes TD. Does dehydration impair exercise performance? Med Sci Sports Exerc. 2007;39:1209–1217. doi: 10.1249/mss.0b013e318124a664. [DOI] [PubMed] [Google Scholar]
- 50.Kenefick RW, Cheuvront SN, Palombo LJ, et al. Skin temperature modifies the impact of hypohydration on aerobic performance. J Appl Physiol. 2010;109:79–86. doi: 10.1152/japplphysiol.00135.2010. [DOI] [PubMed] [Google Scholar]
- 51.Castellani JW, Muza SR, Cheuvront SN, et al. Effect of hypohydration and altitude exposure on aerobic exercise performance and acute mountain sickness. J Appl Physiol. 2010;109:1792–1800. doi: 10.1152/japplphysiol.00517.2010. [DOI] [PubMed] [Google Scholar]
- 52.Cheuvront SN, Carter R, Castellani JW, et al. Hypohydration impairs endurance exercise performance in temperate but not cold air. J Appl Physiol. 2005;99:1972–1976. doi: 10.1152/japplphysiol.00329.2005. [DOI] [PubMed] [Google Scholar]
- 53.Sawka MN, Cheuvront SN, Kenefick RW. High skin temperature and hypohydration impairs aerobic performance. Exp Physiol. 2011;97:327–332. doi: 10.1113/expphysiol.2011.061002. [DOI] [PubMed] [Google Scholar]
- 54.Sawka MN, Convertino VA, Eichner ER, et al. Blood volume: importance and adaptations to exercise training, environmental stresses, and trauma/sickness. Med Sci Sports Exerc. 2000;32:332–348. doi: 10.1097/00005768-200002000-00012. [DOI] [PubMed] [Google Scholar]
- 55.Simmons GH, Minson CT, Cracowski JL, et al. Systemic hypoxia causes cutaneous vasodilation in healthy humans. J Appl Physiol. 2007;103:608–615. doi: 10.1152/japplphysiol.01443.2006. [DOI] [PubMed] [Google Scholar]
- 56.Montain SJ, Coyle EF. Influence of graded dehydration on hyperthermia and cardiovascular drift during exercise. J Appl Physiol. 1992;73:1340–1350. doi: 10.1152/jappl.1992.73.4.1340. [DOI] [PubMed] [Google Scholar]
- 57.Sawka MN, Knowlton RG, Critz JB. Thermal and circulatory responses to repeated bouts of prolonged running. Med Sci Sports. 1979;11:177–180. [PubMed] [Google Scholar]
- 58.González-Alonso J, Calbet J, Nielsen B. Muscle blood flow is reduced with dehydration during prolonged exercise in humans. J Physiol. 1998;513:895–905. doi: 10.1111/j.1469-7793.1998.895ba.x. [DOI] [PMC free article] [PubMed] [Google Scholar]
- 59.Trangmar SJ, Chiesa ST, Stock CG, et al. Dehydration affects cerebral blood flow but not its metabolic rate for oxygen during maximal exercise in trained humans. J Physiol. 2014;592:3143–3160. doi: 10.1113/jphysiol.2014.272104. [DOI] [PMC free article] [PubMed] [Google Scholar]
- 60.Logan-Spencer H, Heigenhauser G, Killian K, et al. Effects of dehydration during cycling in skeletal muscle metabolism in females. Med Sci Sport Exerc. 2012;44:1949–1957. doi: 10.1249/MSS.0b013e31825abc7c. [DOI] [PubMed] [Google Scholar]
- 61.Montain SJ, Smith SA, Matott RP, et al. Hypohydration effects on skeletal muscle performance and metabolism: A 31P MRS study. J Appl Physiol. 1998;84:1889–1894. doi: 10.1063/1.368316. [DOI] [PubMed] [Google Scholar]
- 62.Sawka MN, Knowlton RG, Glaser RM. Body temperature, respiration, and acid-base equilibrium during prolonged running. Med Sci Sports Exerc. 1980;12:370–374. doi: 10.1249/00005768-198025000-00013. [DOI] [PubMed] [Google Scholar]
- 63.Montain SJ, Tharion WJ. Hypohydration and muscular fatigue of the thumb alter median nerve somatosensory evoked potentials. Appl Physiol Nutr Metab. 2010;35:456–463. doi: 10.1139/H10-032. [DOI] [PubMed] [Google Scholar]
- 64.Bigard A, Sanchez H, Claveyrolas G, et al. Effects of dehydration and rehydration on EMG changes during fatiguing contractions. Med Sci Sports Exerc. 2001;33:1694–1700. doi: 10.1097/00005768-200110000-00013. [DOI] [PubMed] [Google Scholar]
- 65.Wall BA, Watson G, Peiffer JJ, et al. Current hydration guidelines are erroneous: dehydration does not impair exercise performance in the heat. Br J Sports Med. 2015;49:1077–1083. doi: 10.1136/bjsports-2013-092417. [DOI] [PubMed] [Google Scholar]
- 66.Kenefick RW, Cheuvront SN, Sawka MN. Thermoregulatory function during the marathon. Sports Med. 2007;37:312–315. doi: 10.2165/00007256-200737040-00010. [DOI] [PubMed] [Google Scholar]
- 67.Fallowfield JL, Williams C, Booth J, et al. Effect of water ingestion on endurance capacity during prolonged running. J Sports Sci. 1996;14:497–502. doi: 10.1080/02640419608727736. [DOI] [PubMed] [Google Scholar]
- 68.Oliver SJ, Laing SJ, Wilson S, et al. Endurance running performance after 48 h of restricted fluid and/or energy intake. Med Sci Sports Exerc. 2007;39:316–322. doi: 10.1249/01.mss.0000241656.22629.57. [DOI] [PubMed] [Google Scholar]
- 69.McConell GK, Stephens TJ, Canny BJ. Fluid ingestion does not influence intense 1-h exercise performance in a mild environment. Med Sci Sports Exerc. 1999;31:386–392. doi: 10.1097/00005768-199903000-00006. [DOI] [PubMed] [Google Scholar]
- 70.McConell GK, Burge CM, Skinner SL, et al. Influence of ingested fluid volume on physiological responses during prolonged exercise. Acta Physiol Scand. 1997;160:149–156. doi: 10.1046/j.1365-201X.1997.00139.x. [DOI] [PubMed] [Google Scholar]
- 71.Merry TL, Ainslie PN, Cotter JD. Effects of aerobic fitness on hypohydration-induced physiological strain and exercise impairment. Acta Physiol. 2010;198:179–190. doi: 10.1111/j.1748-1716.2009.02051.x. [DOI] [PubMed] [Google Scholar]
- 72.Ebert TR, Martin DT, Bullock N, et al. Influence of hydration status on thermoregulation and cycling hill climbing. Med Sci Sports Exerc. 2007;39:323–329. doi: 10.1249/01.mss.0000247000.86847.de. [DOI] [PubMed] [Google Scholar]
- 73.Below PR, Mora-Rodríguez R, González-Alonso J, et al. Fluid and carbohydrate ingestion independently improve performance during 1 h of exercise. Med Sci Sports Exerc. 1995;27:200–210. doi: 10.1249/00005768-199502000-00009. [DOI] [PubMed] [Google Scholar]
- 74.Walsh RM, Noakes TD, Hawley JA, et al. Impaired high-intensity cycling performance time at low levels of dehydration. Int J Sports Med. 1994;15:392–398. doi: 10.1055/s-2007-1021076. [DOI] [PubMed] [Google Scholar]
- 75.Cheung SS, McLellan TM. Heat acclimation, aerobic fitness, and hydration effects on tolerance during uncompensable heat stress. J Appl Physiol. 1998;84:1731–1739. doi: 10.1152/jappl.1998.84.5.1731. [DOI] [PubMed] [Google Scholar]
- 76.Cheung MN, McGarr AJ, Mallette WA, et al. Separate and combined effects of dehydration and thirst sensation on exercise performance in the heat. Scand J med Sci Sports. 2015;25(Suppl 1):104–111. doi: 10.1111/sms.12343. [DOI] [PubMed] [Google Scholar]
- 77.Sawka MN, Young AJ, Latzka WA, et al. Human tolerance to heat strain during exercise: influence of hydration. J Appl Physiol. 1992;73:368–375. doi: 10.1152/jappl.1992.73.1.368. [DOI] [PubMed] [Google Scholar]


