

Abstract
Background
Disparate vascular outcomes in diabetes by race/ethnicity may reflect differential risk factor control, especially pre-Medicare.
Methods
Assess concurrent target attainment for glycohemoglobin <7%, non-HDL-cholesterol <130 mg/dL, and blood pressure <140/<90 mmHg in white, black, and Hispanic diabetics <65 (younger) and ≥65 (older) years. NHANES 1999–2010 data were analyzed on diagnosed and undiagnosed diabetics ≥18 years.
Results
Concurrent target attainment was higher in whites (18.7%) than blacks (13.4% [p=0.02] and Hispanics (10.3%, p<0.001) <65 but not ≥65 years (20.0% vs. 15.9% [p=0.13], 19.5% [p=0.88]). Disparities in healthcare insurance among younger whites, blacks, and Hispanics, respectively, (87.4% vs. 81.1% (p<0.01), 68.0% (p<0.001) and infrequent healthcare (0–1 visits/year; 14.3% vs. 15.0% (p=NS), 32.0% (p<0.001) declined with age. Cholesterol treatment predicted concurrent control in both age groups (multivariable odds ratio >2, p<0.001). Risk factor awareness and treatment were lower in Hispanics than whites. When treated, diabetes and hypertension control were greater in whites than blacks or Hispanics.
Conclusions
Concurrent risk factor control is low in all diabetics and could improve with greater statin use. Insuring younger adults, especially Hispanic, could raise risk factor awareness and treatment. Improving treatment effectiveness in younger black and Hispanic diabetics could promote equitable risk factor control.
Keywords: diabetes mellitus, hypertension, hypercholesterolemia, health disparities
Background
Diabetes is a major contributor to death and disability. From 1990 to 2010, diabetes mellitus rose from the 15th to 7th leading contributor to years of life lost in the U.S [1]. Diabetes remained the 8th leading contributor to years lived with disability.
Vascular disease is the leading cause of death and disability in diabetes. Macrovascular disease contributes to morbidity and up to two-thirds of deaths [2]. Diabetes is the leading cause of blindness and end-stage renal disease [3,4], which are microvascular complications.
Vascular benefits of risk factor control in diabetes are established. Treating hypertension and hyperlipidemia reduces coronary heart disease, stroke, renal and retinal disease in adults with diabetes [5,6]. Concomitant vascular risk factors management provides greater macro- and microvascular protection [7].
Diabetes contributes to health disparities. Prevalent diabetes and its complications are more common in African Americans and Hispanics than Caucasians [8]. Disparate outcomes are related in part to higher prevalence and/or lesser awareness and treatment in minority than white patients [8,9]. Race/ethnicity disparities in controlling risk factors including diabetes and hypertension are greater pre-Medicare and decline with Medicare coverage [10–14].
This study was undertaken to: (1) assess differences in attaining control of diabetes, hypercholesterolemia and hypertension between Caucasian and Hispanic-African Americans minorities with diabetes at ages <65 years and ≥65 years (Medicare eligibility for most) (2) identify medically modifiable variables that could inform strategies to raise risk factor control and improve vascular outcomes and health equity in diabetes.
Research Design and Methods
The National Health and Nutrition Examination Surveys (NHANES) assess a representative sample of the U.S. civilian non-institutionalized population. All adults provided written consent approved by National Center for Health Statistics.
Participants included adults ≥18 years old in NHANES 1999–2010.
Race/Ethnicity was determined by self-report and separated into non-Hispanic white (white), non-Hispanic black (black), and Hispanic ethnicity.
Diagnosed diabetes was defined by positive response to one or more questions, “Have you ever been told by a doctor that you have diabetes?”, “Are you now taking insulin?”, “Are you now taking diabetic pills to lower your blood sugar?” and a match between medication(s) reported or brought to exam and known diabetes medication(s).
Duration of diabetes among aware (diagnosed) adults was determined by the difference between age at the time of examination and age when subjects were first told they had diabetes.
Undiagnosed diabetes was defined in subjects without diagnosed diabetes as fasting glucose ≥126 mg/dL and/or glycosylated hemoglobin (HbA1c) ≥6.5% [15].
Patients without diabetes were defined by fasting glucose <126 mg/dL and HbA1c <6.5%. In patients with only one value, the single value was within target [15,16].
Diabetes control was defined by HbA1c values <7% as recommended [16,17]. The American Diabetes Association has long recognized that less stringent goals, e.g. <8%, may be acceptable for individuals with long-standing diabetes, severe or frequent hypoglycemia, and other major comorbid health conditions, e.g., frailty and cardiovascular disease [16,17].
Hypertension was defined by mean (excluding first value) systolic BP ≥140 and/or diastolic BP ≥90 mmHg and/or a positive response to questions “Are you currently taking medication to lower your BP?”, and by individuals reporting a physician told them twice they were hypertensive [18].
Hypertension control was defined as BP <140/<90 mmHg. Although goal BP in diabetes was <130/<85–<80 for 1999–2010 [19,20], recent evidence does not support lower treatment goals [21,22].
Hypercholesterolemia was defined by non-HDL–cholesterol(C) ≥130 mg/dL [2]. Non- HDL-C was selected, since LDL-C was missing on >50% of adults [18]. Non-HDL-C is also a better vascular disease predictor than LDL-C [22]. Hypercholesterolemia was also defined by a ‘Yes’ response to “Are you now taking medication to lower your cholesterol?” and a match between medication(s) reportedly taken and known lipid lowering medication(s) [18]. Non-HDL-C <130 mg/dL defined control [24].
Major CHD risk factors were defined as described except [25] family history of premature CHD, which was defined as CHD in first-degree relatives <50 years given limited family history documentation of CHD in NHANES [26].
Coronary heart disease (CHD) was defined by positive response to, “Has a doctor ever told you that you had a heart attack,” and/or “Has a doctor ever told you that you had coronary heart disease?” and/or angina by Rose questionnaire [27].
Stroke was defined by positive response to, “Has a doctor ever told you that you had a stroke [28]?
Chronic kidney disease (CKD) was defined by estimated glomerular filtration rate <60 mL/1.73 m2/min and/or urine albumin:creatinine ≥30 mg/g [29,30]. Serum creatinine values were adjusted for comparisons across surveys [31].
Medical visits were defined by response to, How many times did you receive health care over the last year?” and dichotomized into <2 vs. ≥2 visits/year.
Uninsured were defined by negative answer to “Are you covered by health insurance or some other kind of healthcare plan?”
Cigarette smoker was defined by “Every day” or “some days” answer to “Do you now smoke cigarettes”.
Data analysis
SAS version 9.3 (Cary, NC) was used for all analyses to account for NHANES complex sampling design. Standard errors were estimated with Taylor series (linearization) method. PROC SURVEYMEANS was used for means and confidence intervals. PROC SURVEYFREQ was used to estimate percentages and confidence intervals. PROC SURVEYLOGISTIC was used to explore effects of multiple modifiable covariates on BP, non- HDL-C, and HbA1c control separately and combined. The effect of diabetes duration on control of diabetes and other risk factors was assessed. Rao-Scott Chi-Square test in PROC SURVEYFREQ was used to test for differences in categorical variables; Wald F test in the PROC SURVEYREG was used to test for differences in continuous variables within each survey. Pairwise comparisons within race/ethnicity and age groups between the three NHANES periods were conducted with t-tests of weighted means. P-values ≤0.05 were accepted as statistically significant.
Results
The process for subgrouping adults by diabetes status is depicted in Figure 1. Adults with diagnosed and undiagnosed diabetes were combined.
Figure 1.
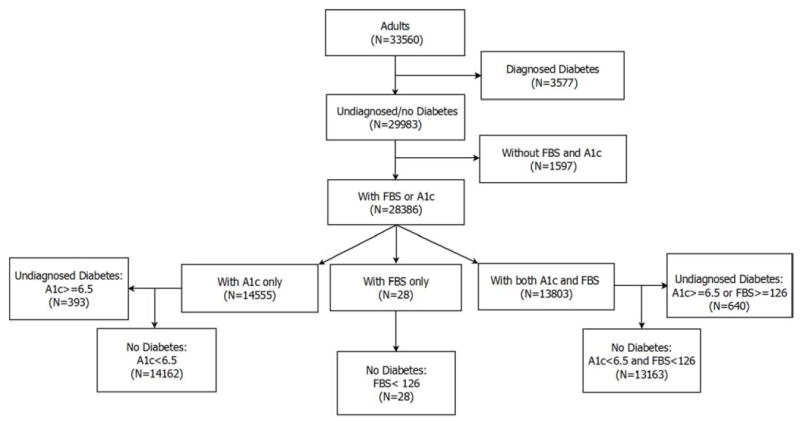
The process is depicted for selecting adults with diagnosed and undiagnosed diabetes from the NHANES 1999 – 2010 database.
In adults with diabetes <65 years, whites and blacks were older than Hispanics (Table 1). Obesity was more common in white and black than Hispanic adults. Hispanics were more likely than whites and blacks to have 0–1 and less likely to have ≥2 healthcare visits/year. Whites were more likely to be insured than blacks or Hispanics, and blacks were more likely to be insured than Hispanics. Whites and blacks were more likely to have CVD than Hispanics. CKD was less common in whites than blacks. Black adults were more likely to be current smokers than Hispanics; whites were more likely to be former smokers than blacks and Hispanics.
Table 1.
Selected Descriptive Characteristics of Patients with Diabetes and by Age and Race / Ethnicity Subgroup in NHANES 1999–2010.
| Age Group | <65 Years Old | ≥65 Years Old | ||||
|---|---|---|---|---|---|---|
|
| ||||||
| Race / Ethnicity | White N=759 | Black N=690 | Hispanic N=885 | White N=1053 | Black N=492 | Hispanic N=538 |
| %1 | 56.5 | 18.1 | 17.7 | 73.2 | 12.8 | 8.7 |
| 95% CI | 52.1-60.9 | 15.5-20.6 | 14.2-21.3 | 69.8-76.5 | 10.7-14.9 | 6.3-11.1 |
|
| ||||||
| %2 | 6.6 | 12.6 | 9.9 | 22.2 | 41.5 | 33.3 |
| 95% CI | 6.0-7.2 | 11.6-13.5 | 8.8-11.0 | 20.7-23.8 | 38.1-44.8 | 28.5-38.1 |
| US Pop, N | 7,783,450 | 2,487,497 | 2,442,631 | 6,290,849 | 1,103,636 | 749,625 |
|
| ||||||
| Age, yrs | 50.7 n‡ | 49.8‡ | 47.5 | 73.7 n* | 73.1 n | 72.7 |
| 50.0-51.5 | 49.0-50.5 | 46.3-48.6 | 73.2-74.1 | 72.5-73.8 | 71.9-73.4 | |
|
| ||||||
| Male, % | 57.2 ‡n | 41.9 ‡ | 53.0 | 48.7 ‡* | 38.5 n | 42.5 |
| 53.1-61.3 | 38.2-45.5 | 48.9-57.0 | 45.7-51.7 | 34.5-42.5 | 36.6-48.3 | |
|
| ||||||
| BMI, kg/m2 | 34.3 n‡ | 35.2 ‡ | 32.2 | 30.9 n† | 31.5 ‡ | 29.4 |
| 33.5-35.1 | 34.4-36.0 | 31.5-32.9 | 30.4-31.3 | 30.8-32.3 | 28.7-30.2 | |
|
| ||||||
| BMI <25,% | 10.6 n‡ | 9.5 * | 11.4 | 16.2 n* | 15.5 † | 17.4 |
| 7.6-13.5 | 7.1-11.9 | 8.3-14.5 | 13.6-18.7 | 12.1-18.8 | 12.6-22.2 | |
|
| ||||||
| BMI ≥30, % | 69.8 | 67.1 | 57.9 | 49.6 | 53.7 | 40.8 |
| 65.6-73.9 | 62.9-71.4 | 52.8-63.1 | 46.5-52.7 | 48.3-59.2 | 33.8-47.7 | |
|
| ||||||
| Visits/yr 0–1, % | 14.3 n‡ | 15.0 ‡ | 32.0 | 7.4 nn | 7.5 n | 8.0 |
| 11.6-16.9 | 12.1-17.8 | 27.3-36.6 | 5.8-8.9 | 5.1-9.8 | 5.2-10.7 | |
|
| ||||||
| Visits/yr ≥2, % | 85.7 | 85.0 | 68.0 | 92.6 | 92.5 | 92.0 |
| 83.1-88.4 | 82.2-87.9 | 63.4-72.7 | 91.1-94.2 | 90.2-94.9 | 89.3-94.8 | |
|
| ||||||
| Insured,% | 87.4 †‡ | 81.1 ‡ | 58.8 | 99.7 *‡ | 98.8 ‡ | 93.0 |
| 84.6-90.2 | 78.4-83.8 | 52.9-64.8 | 99.5-100.0 | 97.7-99.9 | 90.6-95.4 | |
|
| ||||||
| CVD, % | 19.6 n‡ | 24.2 ‡ | 11.3 | 43.1 n‡ | 40.7 ‡ | 28.6 |
| 16.4-22.9 | 20.3-28.0 | 8.9-13.7 | 39.6-46.6 | 36.0-45.4 | 23.4-33.8 | |
|
| ||||||
| CKD1, % | 26.1 ‡‡ | 35.8 n | 36.4 | 52.3 nn | 54.2 n | 56.2 |
| 23.4-28.8 | 31.5-40.1 | 31.0-41.8 | 49.5-55.2 | 49.4-59.0 | 49.2-63.3 | |
|
| ||||||
| CKD2, % | 8.7 *n | 12.9 n | 11.0 | 34.9 n* | 30.6 n | 26.8 |
| 6.5-11.0 | 9.7-16.0 | 8.1-13.8 | 31.6-38.3 | 26.4-34.7 | 19.7-33.9 | |
|
| ||||||
| Current Smoker, % | 23.7 nn | 28.9 * | 23.2 | 7.0 †n | 10.9 n | 10.8 |
| 20.2-27.1 | 25.0-32.7 | 19.7-26.6 | 5.4-8.5 | 8.2-13.6 | 6.0-15.6 | |
|
| ||||||
| Former Smoker, % | 32.2 ‡‡ | 21.0 n | 22.8 | 48.9 *‡ | 41.7 n | 36.5 |
| 28.4-35.9 | 18.1-24.0 | 19.1-26.5 | 45.2-52.5 | 37.4-46.1 | 31.5-41.4 | |
Data presented as mean and 95% confidence intervals.
n=not significant,
p<0.05,
p<0.01,
p<0.001 between race/ethnicity group separately for <65 and ≥65 years old.
The 2 symbols in column one (white) represent comparison to column 2 (black) and 3 (Hispanic), respectively; the symbols in column two (black) compare to column 3 (Hispanic).
% = percentage of patients with diabetes accounted for by each of the three race/ethnicity groups separately for ages <65 and ≥65 years.
% = percentage of all adults with diabetes in each of the six age by race/ethnicity subgroups.
Abbreviations: BMI=body mass index; CI=confidence interval; CKD=chronic kidney disease, CVD=cardiovascular disease. CKD1=eGFR <60 ml/1.73m2/min and albumin:creatinine ≥30 mg/g; CKD2=eGFR <60 and alb/creat ≥300 mg/g. U.S. Pop = United States population
In adults with diabetes ≥65 years old, obesity was less common in Hispanics than whites or blacks. Healthcare visit frequency did not vary by race/ethnicity. Hispanics were less likely to be insured than whites or blacks. CVD was less prevalent among Hispanics than whites or blacks. Prevalent CKD was greater in whites than Hispanics. Current smoking was lower in whites than blacks; former smoking was more common in whites than blacks or Hispanics.
Across age groups, percentages were lower (non-overlapping 95% confidence intervals) in older than younger adults for proportion of men, obesity, and infrequent healthcare (0–1 visits/year). Younger adults were more likely to be current and less likely to be former smokers. Older adults were more likely to have ≥2 healthcare visits/yr., health insurance, CVD, and CKD.
Individual and concomitant risk factor control by age and race/ethnicity subgroup are shown in Figure 2. Among adults <65 years old, whites were more likely to attain: (1) HbA1c <7% than blacks or Hispanics (2) non-HDL-cholesterol <130 mg/dL than Hispanics (3) BP <140/<90 than blacks. Concurrent target attainment for all three risk factors was greater in white than black and Hispanic adults. Concurrent targets for blood pressure and non-HDL-C were more often met in white than Hispanic adults. Among adults with diabetes ≥ 65 years old, whites were more likely to attain HbA1c <7% than Hispanics.
Figure 2.
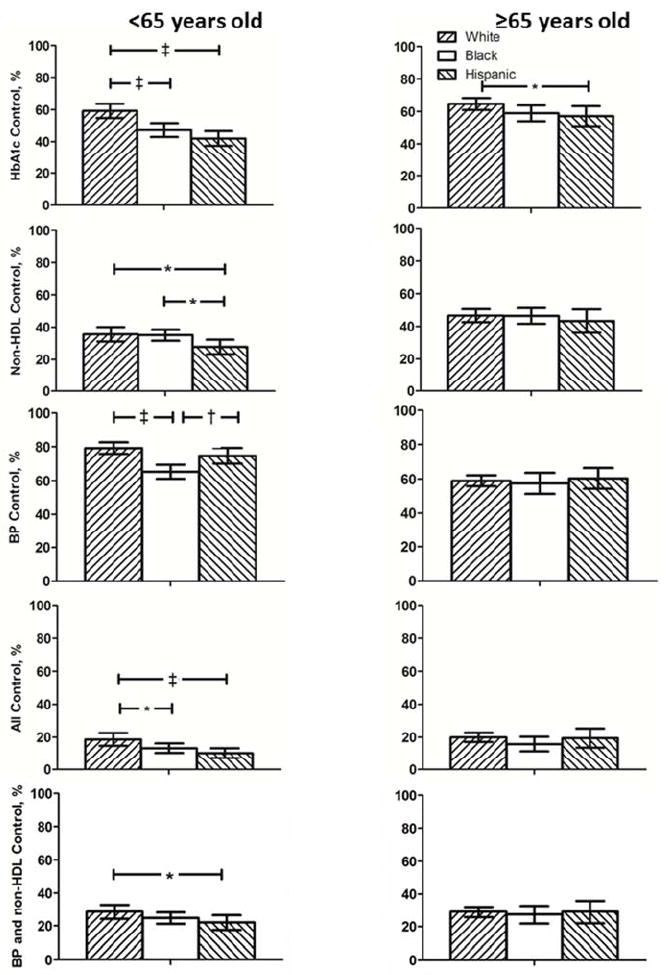
Percent of adults with diabetes attaining target values for risk factors individually and concurrently by age and race/ethnicity group are depicted for NHANES 1999–2010. *p<0.05, † p<0.01, ‡ p<0.001 for between group comparisons.
Risk factor target attainment for HbA1c, non-HDL-cholesterol and BP singly and combined among adults with diabetes by age and race/ethnicity subgroup.
Figure 3 depicts differences between men and women within each age and race/ethnicity group. Among adults <65 years old, white women were more likely than white men to attain HbA1c control. Hispanic women were more likely than Hispanic men to attain concurrent control of blood pressure and non-HDL-C. Among adult ≥ 65 years old, white and black males were more likely than race-matched females to attain targets for non-HDL-C and blood pressure individually and concurrently as well as all three risk factors concurrently.
Figure 3.
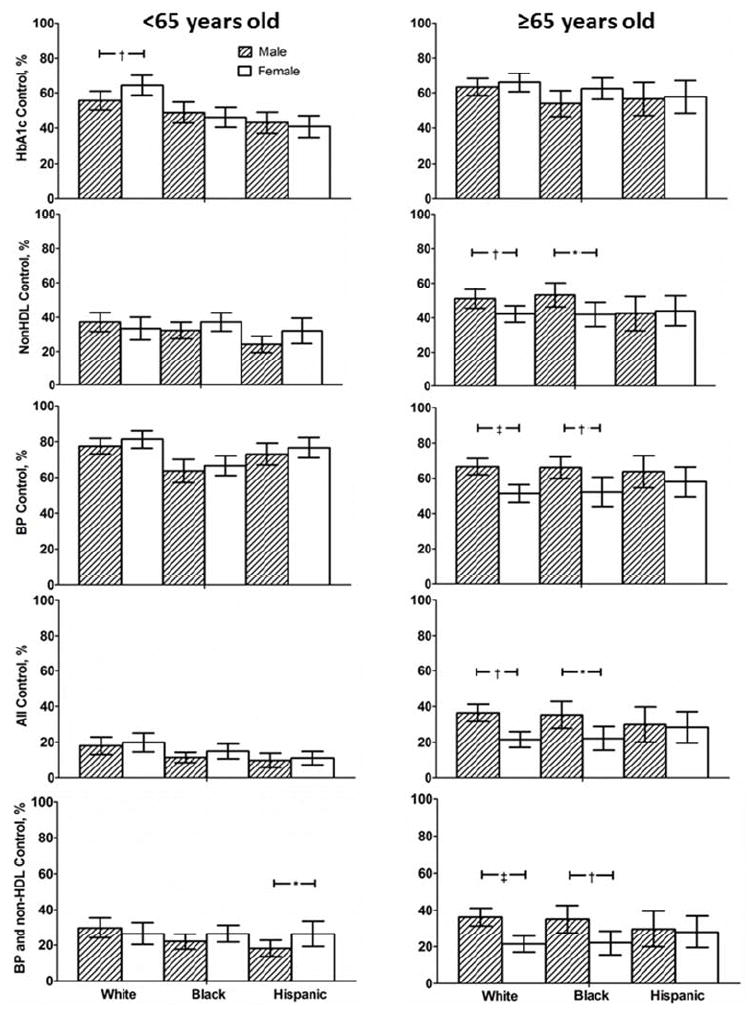
Percent of men and women by age and race/ethnicity group attaining target values for risk factor individually and concurrently are shown for NHANES 1999–2010. *p<0.05, † p<0.01, ‡ p<0.001 for between group comparisons.
Figure 4 shows changes from 1999–2004 to 2005–2010 in risk factor attainment. In younger adults, target attainment for: (a) HbA1c improved in blacks and Hispanics (b) non-HDL rose in all three groups (c) BP <140/<90 did not improve in any group (d) concurrent control rose in whites and blacks. Among older adults, target attainment for non-HDL and concurrent control rose in all three race/ethnicity groups. BP target attainment improved in whites.
Figure 4.
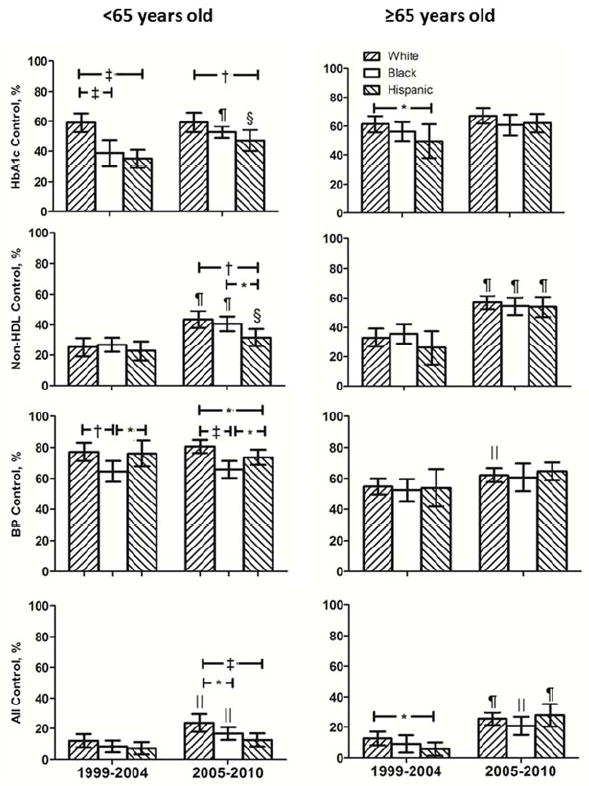
Percent of patients with diabetes by age and race/ethnicity attaining target values for risk factors individually and concurrently are depicted for NHANES 1999–2004 and 2005–2010. * p<0.05, † p<0.01, ‡ p<0.001 for between group comparison in 1999–2004 and 2005–2010 for patients <65 and ≥65 years old. § p<0.05, ∥ p<0.01, ¶ p<0.001 for changes within white, black and Hispanic patient groups <65 and ≥65 years old between 1999–2004 and 2005–2010
Risk factor target attainment for HbA1c, non-HDL-cholesterol and BP singly and combined among adults with diabetes by age and race/ethnicity subgroup.
Clinical variables impacting risk factor control are provided in Table 2. Among adults with diabetes <65 years, HbA1c was lower in whites than blacks and Hispanics. In undiagnosed diabetes, whites and blacks were more likely to have HbA1c <7% than Hispanics. Percentages with diagnosed diabetes were greater in blacks than Hispanics. Diabetes awareness and percentage of aware patients treated were higher in blacks than Hispanics. Self-reported duration of diabetes was comparable across race/ethnicity groups. Percentages of treated patients with HbA1c <7% were higher in white than black or Hispanic adults.
Table 2.
Diabetes, cholesterol and blood pressure measures by age and race/ethnicity subgroup.
| Age Group | <65 Years Old | ≥65 Years Old | ||||
|---|---|---|---|---|---|---|
|
| ||||||
| Race / Ethnic | White | Black | Hispanic | White | Black | Hispanic |
|
Diabetes (diagnosed and undiagnosed)
| ||||||
| FBG mg/dL | 155.9 ‡‡ | 164.2 ‡ | 183.4 | 148.2 nn | 148.5 n | 151.6 |
| 148.3-163.6 | 152.8-175.7 | 174.0-192.9 | 143.1-153.4 | 140.9-156.1 | 142.8-160.4 | |
|
| ||||||
| HbA1c, % | 7.1 ‡‡ | 7.8 n | 8.0 | 6.8 †† | 7.1 n | 7.1 |
| 7.0-7.3 | 7.6-8.0 | 7.8-8.2 | 6.7-6.9 | 6.9-7.2 | 6.9-7.2 | |
|
| ||||||
| UnDx DM | 73.6 n‡ | 65.0 ‡ | 47.0 | 78.0 n† | 73.2 n | 66.0 |
| HbA1c <7%,% | 66.4-80.7 | 56.7-73.2 | 38.8-55.2 | 73.6-82.4 | 63.6-82.8 | 55.5-76.5 |
|
| ||||||
| Dx DM, % | 73.4 nn | 78.9 * | 73.0 | 77.7 *n | 82.1 n | 81.9 |
| 69.2-77.5 | 75.1-82.7 | 68.9-77.2 | 75.2-80.2 | 78.6-85.5 | 77.8-86.0 | |
|
| ||||||
| Aware, % | 69.0 *n | 75.9 * | 68.4 | 72.9 *n | 77.4 n | 73.2 |
| 64.7-73.2 | 71.6-80.2 | 64.0-72.7 | 70.2-75.5 | 73.9-80.9 | 67.6-78.8 | |
|
| ||||||
| DM duration, yrs | 9.5 nn | 8.7 n | 8.8 | 14.5 ‡n | 17.4 n | 15.1 |
| 8.3-10.7 | 8.1-9.3 | 8.0-9.6 | 13.5-15.4 | 16.2-18.7 | 12.7-17.4 | |
|
| ||||||
| Treated, % | 63.2 n* | 68.3 ‡ | 57.1 | 68.1 †n | 74.9 n | 74.1 |
| 59.3-67.1 | 63.9-72.7 | 53.0-61.1 | 64.7-71.5 | 70.7-79.0 | 68.0-80.1 | |
|
| ||||||
| Control/Treated, % | 48.6 †‡ | 38.8 n | 34.7 | 56.6 nn | 53.1 n | 51.2 |
| 43.2-54.0 | 34.2-43.5 | 29.1-40.2 | 52.3-60.9 | 47.3-58.9 | 43.1-59.3 | |
|
| ||||||
| Cholesterol / Hypercholesterolemia | ||||||
|
| ||||||
| Non-HDL-C, mg/dL | 152.7 n* | 150.6 † | 165.0 | 139.1 nn | 138.3 ‡ | 142.9 |
| 149.2-156.2 | 146.7-154.4 | 155.5-174.5 | 135.5-142.7 | 134.0-142.6 | 137.6-148.3 | |
|
| ||||||
| LDL–C, mg/dL | 110.5 ‡n | 118.4 n | 116.7 | 103.9 ‡n | 110.4 * | 105.1 |
| 106.3-114.6 | 114.1-122.6 | 111.6-121.8 | 100.4-107.3 | 104.8-116.0 | 100.2-109.9 | |
|
| ||||||
| Prevalence, % | 83.5 nn | 81.6 n | 83.6 | 89.0 †n | 82.8 † | 89.4 |
| 80.6-86.4 | 78.5-84.6 | 80.5-86.8 | 86.7-91.2 | 78.9-86.7 | 86.4-92.4 | |
|
| ||||||
| Aware, % | 61.3 *‡ | 53.5 n | 49.2 | 63.5 †† | 53.0 n | 53.5 |
| 56.8-65.8 | 48.7-58.3 | 43.8-54.6 | 60.3-66.7 | 47.4-58.6 | 46.5-60.6 | |
|
| ||||||
| Treated, % | 45.8 n‡ | 36.8 * | 29.2 | 62.4 ‡n | 50.7 n | 53.0 |
| 40.6-51.1 | 31.9-41.8 | 24.7-33.7 | 59.1-65.8 | 44.3-57.1 | 43.0-63.0 | |
|
| ||||||
| Control/Treated, % | 48.5 nn | 50.0 * | 40.4 | 62.1 nn | 63.2 n | 62.2 |
| 41.8-55.3 | 43.6-56.4 | 30.8-50.0 | 57.2-67.0 | 56.5-70.0 | 55.8-68.7 | |
|
| ||||||
| Blood Pressure / Hypertension | ||||||
|
| ||||||
| SBP, mmHg | 125.0 ‡n | 131.7 ‡ | 126.9 | 136.2 nn | 138.8 n | 137.7 |
| 123.5-126.6 | 130.1-133.3 | 124.9-128.9 | 134.6-137.8 | 136.3-141.4 | 134.8-140.6 | |
|
| ||||||
| DBP, mmHg | 72.5 ‡n | 75.6 * | 73.9 | 63.6 nn | 64.7 n | 64.1 |
| 71.4-73.6 | 74.4-76.8 | 72.8-74.9 | 62.7-64.5 | 63.0-66.4 | 62.5-65.7 | |
|
| ||||||
| Prevalence, % | 54.9 ‡† | 69.1 ‡ | 45.6 | 79.2 †n | 86.1 ‡ | 74.0 |
| 50.8-59.0 | 64.9-73.2 | 39.7-51.5 | 76.3-82.1 | 82.7-89.4 | 68.1-79.9 | |
|
| ||||||
| Aware, % | 90.9 n‡ | 92.8 ‡ | 78.4 | 87.1 †n | 92.1 * | 86.5 |
| 88.0-93.7 | 89.5-96.1 | 72.5-84.3 | 84.5-89.8 | 89.8-94.5 | 80.9-92.1 | |
|
| ||||||
| Treated, % | 85.5 n‡ | 86.6 ‡ | 69.4 | 84.4 *n | 89.3 * | 82.5 |
| 81.9-89.0 | 82.3-90.9 | 62.5-76.2 | 81.5-87.3 | 86.1-92.6 | 76.8-88.1 | |
|
| ||||||
| Control/Treated, % | 72.7 ‡* | 57.5 n | 64.3 | 57.1 nn | 56.6 n | 56.4 |
| 67.6-77.8 | 51.6-63.4 | 56.8-71.8 | 53.1-61.1 | 50.1-63.2 | 48.6-64.1 | |
Data presented as mean and 95% confidence intervals.
n=not significant,
p<0.05,
p<0.01,
p<0.001 between race/ethnicity group separately for <65 and ≥65 years old.
UnDx=undiagnosed; Dx=diagnosed; T Chol = total cholesterol; SBP = systolic blood pressure; D = diastolic.
Non-HDL was lower in whites and blacks than Hispanics. LDL was lower in whites than blacks. Prevalent hypercholesterolemia (non-HDL) was similar across groups. Hypercholesterolemia awareness and treatment were greater in whites than Hispanics. The proportion of treated patients with non-HDL controlled was higher in blacks than Hispanics.
Systolic and diastolic blood pressures and prevalent hypertension were higher in black than white or Hispanic adults. Prevalent hypertension was greater in whites than Hispanics. Hypertension awareness and treatment were higher in blacks and whites than Hispanics. Blacks and Hispanics had fewer treated adults controlled than whites.
In adults ≥65 years old, HbA1c was lower in white than black or Hispanic adults. The proportion of undiagnosed adults with HbA1c >% was larger in Hispanics than whites. Diagnosed diabetes and percent treated were higher in blacks than whites. Self-reported duration of diabetes was greater in black than white patients. The proportion of treated diabetes controlled was comparable across groups.
Non-HDL was lower in black than Hispanic, and LDL was lower in white and Hispanic than black adults. Systolic and diastolic BP did not vary by race/ethnicity. Prevalent hypertension and hypertension awareness and treatment were greater in blacks than whites or Hispanics. Proportions of treated adults controlled did not vary by race/ethnicity.
Modifiable variables associated with risk factor attainment were explored and the impact of diabetes duration on diabetes control assessed. Of note, in adults <65 years old, duration of diabetes per one year increment, a non-modifiable variable was inversely related to HbA1c <7% (Odds Ratio [95% Confidence Interval] {0.95 [0.94–0.97]}) and concurrent control of all three risk factors (0.97 [0.95–0.99]). HbA1c <7% was independently related to health insurance (1.35 [1.01–1.81]), visit frequency (1.61 [1.15–2.24]) and BP medications (1.45 [1.12–1.88]).
Non-HDL <130 was independently linked with lipid medications (2.48 [1.84–3.34]), although health insurance (1.49 [1.10–2.03]) and visit frequency (1.80 [1.35–2.39]) were univariable predictors. BP <140/<90 was independently related to health insurance (1.43 [1.10–1.86]) and diabetes medications (1.43 [1.11–1.83]). Concurrent control of all three risk factors was independently linked to lipid medications (2.04 [1.38–3.00]) with health insurance (1.80 [1.21–2.68]) and visit frequency (1.88 [1.14–3.08]) as univariable predictors.
In patients ≥65 years old, diabetes control showed a marginal inverse relationship to duration of diabetes (0.99 [0.98–1.0]) and was independently linked with BP medications (1.64 [1.23–2.19]). Lipid medications were independent linked to non-HDL <130 (4.05 [3.17–5.18]), BP <140/<90 (1.30 [1.04– 1.62]) and concurrent (2.52 [1.78–3.58]) target attainment. Visit frequency (2.03 [1.24–3.33]) and BP medications (2.07 [1.35–3.16]) were univariable predictors of concurrent control.
Discussion
The principal objective was to assess differences by race/ethnicity and age in controlling vascular risk factors in patients with diabetes. Concomitant target attainment for HbA1c, non-HDL, and BP, despite improvement from 1999–2004 to 2005–2010 (Figure 4) was low [31] irrespective of race/ethnicity and age (Figure 2). Black and Hispanic patients <65 years old were the least likely to attain concurrent control.
While better glucose control is beneficial [32], treatment and control of blood pressure and cholesterol are more strongly linked to improved macrovascular outcomes in adults with diabetes [5,6,18,23]. Concurrent target attainment for blood pressure and cholesterol was also lower in younger Hispanic than white adults. In younger Hispanics, men were less likely than women to attain blood pressure and cholesterol control (Figure 3). Thus, younger Hispanic men with diabetes emerge as an especially high-risk population for preventable vascular events.
The second objective was to identify medically modifiable factors that could improve concurrent control of HbA1c, non-HDL and BP among patients with diabetes and equity in target attainment. Of note, not all patients with diabetes have hypercholesterolemia or hypertension. Since patients without the risk factor meet the target goal, race/ethnicity differences in prevalent hypercholesterolemia and hypertension can impact target attainment.
Glycosylated hemoglobin
The likelihood of attaining HbA1c <7% was lower in black and Hispanic than white adults <65 years. The better control of diabetes in older than younger adults was observed, despite the fact that older adults are more likely to have frailty and major comorbid health conditions where less aggressive HbA1c targets may be appropriate [16,17]. Hispanic in contrast to white and black adults with undiagnosed diabetes were more likely to have HbA1c >7%, which could reflect more rapid progression to diabetes and/or lower frequency of screening in Hispanics. Among younger adults treated for diabetes, whites were more likely to attain goal HbA1c than blacks or Hispanics, which could reflect differences in treatment intensity and access to and/or adherence with appropriate medications.
Among older adults, black-white differences in HbA1c declined, although HbA1c <7% was more often attained by white than Hispanic patients. As in younger adults, older Hispanics with undiagnosed diabetes were more likely to have HbA1c >7% than older whites and blacks. More screening programs for diabetes in Hispanics populations could facilitate earlier diagnosis and treatment of diabetes in this ethnic group. HbA1c control was generally greater in older than younger adults (Figure 2), although older adults have more CVD and CKD, cited as reasons to consider less stringent HbA1c control [16,17].
Among modifiable variables, health insurance and ≥2 healthcare visits/year were independently associated with Hb1c <7% in younger adults, while adults reportedly taking BP medications were more likely to have HbA1c <7% in both age groups. The linkage of diabetes control to insurance and visit frequency in younger patients is consistent with previous reports [33], whereas linkage to BP medication is more speculative and may not be causal.
Non-HDL-cholesterol
Among younger adults, target non-HDL-cholesterol was more often obtained in whites than Hispanics. Younger Hispanic patients were less likely to be aware of and treated for hypercholesterolemia than younger whites, which may be explained by differences in healthcare insurance and access (visit frequency) [12,34,35]. Non-HDL targets were more often met than in older adults and race/ethnicity differences were not seen as gaps in insurance narrowed and visit frequency disappeared.
Blood Pressure
In younger adults, whites were more likely than blacks and Hispanics to have blood pressure <140/<90 for two principal reasons. First, prevalent hypertension was greater in younger blacks than whites and Hispanics. Second, when treated, whites were more likely to attain control than blacks. Awareness and treatment of hypertension were lower in Hispanic than black adults, yet blacks were less likely to attain target BP. This apparent paradox is explained by less prevalent hypertension in younger Hispanics than blacks, i.e., 54.4% of Hispanics vs. 30.9% of blacks met goal BP <140/<90 without treatment. Similarly, prevalent hypertension was greater and blood pressure targets attained less often in older than younger adults. Race/ethnicity differences in target BP were not seen in older adults (Figure 2).
NHANES 1999–2010 data were aggregated to provide power for assessing differences between race/ethnicity and age, which obscures changes within that time. When comparing 1999–2004 to 2005–2010, concomitant targets for all three risk factors increased in all six age by race/ethnicity groups except for younger Hispanics. High percentages of younger Hispanics without health insurance (41.2%) and with infrequent healthcare (32.0% [0–1 healthcare visits/year) emerge as potential explanatory factors [12,34–36]. Moreover, concurrent target attainment in Hispanics ≥65 years was nearly double that of Hispanics <65 years (19.5% vs. 10.3%) as the uninsured proportion declined from 41.2% for younger Hispanics to 7.0% for older Hispanics. Disparities in care frequency between younger Hispanic and white patients were not evident in their older counterparts. Health insurance was a significant independent predictor of diabetes and hypertension control and a univariable predictor of concurrent control in younger patients. The observations suggest that insuring a larger proportion of younger adults would improve concurrent risk factor control in diabetes and reduce disparities.
Fewer than 40% of younger adults with diabetes achieved target non-HDL, which sets a low ceiling for concurrent control. Only ~50% of younger adults with hypercholesterolemia were treated and <50% of treated adults controlled. Hypercholesterolemia treatment emerged as the a key medically modifiable variable in concurrent risk factor control in younger and older adults. The explanation may reflect evidence that statins are related to better control of both non-HDL and blood pressure. In fact, among older adults, cholesterol treatment was independently related to target blood pressure attainment. Statins were linked statins to better blood pressure control and reductions in AT1 receptors, pressor responses to angiotensin II, and treatment resistant hypertension [37–39].
Our report focused on non-HDL- rather than LDL-cholesterol. LDL-cholesterol was missing on more than half of adults, whereas >95% of patients had non-HDL-cholesterol [18]. Adults with and without LDL-cholesterol differ on other important variables [18], so extrapolation from one group to the other is not straightforward. Non-HDL-cholesterol is a better predictor than LDL-cholesterol of vascular risk [23,40].
Limitations include cross-sectional, single time-point data in NHANES. Diabetes classification was based on a single glucose or HbA1c value in many individuals, which could lead to diagnostic error. Associations between modifiable clinical variables and risk factor control in logistic regression analysis do not establish cause and effect. New cholesterol guidelines in contrast to guidelines in effect during 1999 to 2010, the period of analysis, emphasize adequate statin dose rather than lipid-lipoprotein targets [41].
In adults with diabetes, whites have fewer microvascular complications and lower extremity amputations than blacks and Hispanics [8]. Concurrent risk factor control is low in all diabetics and could improve with greater statin use. Disparities in concurrent risk factor control at younger ages decline in Medicare eligible patients, consistent with prior reports [9,11–14]. Insuring younger adults, especially Hispanic, could raise risk factor awareness and treatment. Improving treatment effectiveness by treating to goal in younger black and Hispanic diabetics already receiving pharmacotherapy could also promote equity in multiple risk factor attainment and vascular outcomes. Among older adults, white and black women are less likely to attain goal blood pressure and cholesterol than race-matched men. Addressing these sex-related disparities could reduce the excess of fatal coronary heart disease outcomes in women as compared to men with diabetes [42].
Acknowledgments
Funding: This report was supported in part by NIH HL105880; NIH NS058728, and NIH HL091841, Bethesda, MD; Centers for Disease Control, Atlanta, GA (Community Transformation Grant thru the South Carolina Department of Health and Environmental Control [SC DHEC]).
None.
Footnotes
Disclosures/conflict of interest: During the previous three years Dr. Egan received research support from Daiichi-Sankyo (>$10,000), Medtronic (>$10,000), Novartis (>$10,000), Takeda (>$10,000) and served as a consultant to Astra Zeneca (<$10,000), Daiichi-Sankyo (<$10,000), Medtronic (>$10,000), Novartis (<$10,000), Takeda (<$10,000), Blue Cross Blue Shield South Carolina (>$10,000).
Drs. Li, Wolfman, and Sinopoli have nothing to disclose.
Publisher's Disclaimer: This is a PDF file of an unedited manuscript that has been accepted for publication. As a service to our customers we are providing this early version of the manuscript. The manuscript will undergo copyediting, typesetting, and review of the resulting proof before it is published in its final citable form. Please note that during the production process errors may be discovered which could affect the content, and all legal disclaimers that apply to the journal pertain.
References
- 1.US Burden of Disease Collaborators. The State of US Health, 1990–2010: Burden of diseases, injuries, and risk factors. JAMA. doi: 10.1001/jama.2013.13805. [DOI] [PMC free article] [PubMed] [Google Scholar]
- 2.Grundy SM, Benjamin IJ, Burke GL, Chait A, Eckel RH, Howard BVL, Mitch W, Smith SC, Jr, Sowers JR. Diabetes and cardiovascular disease: A statement for healthcare professionals from the American Heart Association. Circulation. 1999;100:1134–46. doi: 10.1161/01.cir.100.10.1134. [DOI] [PubMed] [Google Scholar]
- 3.Abbate M, Cravedi P, Iliev I, Remuzzi G, Ruggenenti P. Prevention and treatment of diabetic retinopathy: Evidence from clinical trials and perspectives. Curr Diab Rev. 2011;7:190–200. doi: 10.2174/157339911795843168. [DOI] [PubMed] [Google Scholar]
- 4.Van Buren PN, Toto R. Current update in the management of diabetic nephropathy. Curr Diab Rev. 2013;9:62–77. [PubMed] [Google Scholar]
- 5.UK Prospective Diabetes Group. Tight blood pressure control and risk of macrovascular and microvascular complications in type 2 diabetes: UKPDS 38. Brit Med J. 1998;317:703–13. [PMC free article] [PubMed] [Google Scholar]
- 6.Valensi P, Picard S. Lipids, lipid-lowering therapy and diabetes complications. Diab Metab. 2011;37:15–24. doi: 10.1016/j.diabet.2010.10.001. [DOI] [PubMed] [Google Scholar]
- 7.Gæde P, Lund-Andersen H, Parving HH, Pedersen O. Effect of a multifactorial intervention on mortality in type 2 diabetes. N Engl J Med. 2008;358:580–91. doi: 10.1056/NEJMoa0706245. [DOI] [PubMed] [Google Scholar]
- 8.Spanakis EK, Golden SH. Race/ethnic differences in diabetes and diabetic complications. Curr Diab Rev. 2013;13:814–23. doi: 10.1007/s11892-013-0421-9. [DOI] [PMC free article] [PubMed] [Google Scholar]
- 9.Chatterji P, Joo H, Lahiri K. Racial/ethnic- and education-related disparities in the control of risk factors for cardiovascular disease among individuals with diabetes. Diab Care. 2012;35:305–12. doi: 10.2337/dc11-1405. [DOI] [PMC free article] [PubMed] [Google Scholar]
- 10.Hajjar I, Kotchen TA. Trends in prevalence, awareness, treatment, and control of hypertension in the United States, 1988–2000. JAMA. 2003;290:199–206. doi: 10.1001/jama.290.2.199. [DOI] [PubMed] [Google Scholar]
- 11.Egan BM, Shaftman SR, Wagner CS, Bandyopadhyay D, Szymanski KA. Demographic differences in the treatment and control of glucose in type 2 diabetic patients: Implications for health care practice. Ethnic Dis. 2012;22:29–37. [PubMed] [Google Scholar]
- 12.Ayanian JZ, Weissman JS, Schneider EC, Ginsburg JA, Zalavsky AM. Unmet health needs of uninsured adults in the United States. JAMA. 2000;284:2061–69. doi: 10.1001/jama.284.16.2061. [DOI] [PubMed] [Google Scholar]
- 13.McWilliams JM, Meara E, Zalavsky AM, Ayanian JZ. Health of previously uninsured adults after acquiring Medicare coverage. JAMA. 2007;298:2886–94. doi: 10.1001/jama.298.24.2886. [DOI] [PubMed] [Google Scholar]
- 14.McWilliams JM, Meara E, Zaslavsky AM, Ayanian JZ. Use of health services by previously uninsured Medicare beneficiaries. N Engl J Med. 2007;357:143–53. doi: 10.1056/NEJMsa067712. [DOI] [PubMed] [Google Scholar]
- 15.Gregg EW, Cadwell BL, Cheng YJ, Cowie CC, Williams DE, Geiss L, Engelgau MM, Vinicor F. Trends in the prevalence and ratio of diagnosed to undiagnosed diabetes according to obesity levels in the U.S. Diab Care. 2004;27:2806–12. doi: 10.2337/diacare.27.12.2806. [DOI] [PubMed] [Google Scholar]
- 16.American Diabetes Association. Standards of medical care in diabetes 2013. Diab Care. 2013;36(Suppl 1):S11–S66. doi: 10.2337/dc13-S011. [DOI] [PMC free article] [PubMed] [Google Scholar]
- 17.American Diabetes Association. Standards of medical care in diabetes 2002. Diab Care. 2002;25(Suppl 1):S33–S49. [Google Scholar]
- 18.Egan BM, Li J, Qanungo S, Wolfman TE. Blood pressure and cholesterol control in hypertensive hypercholesterolemic patients. Circulation. 2013;128:29–41. doi: 10.1161/CIRCULATIONAHA.112.000500. [DOI] [PMC free article] [PubMed] [Google Scholar]
- 19.The sixth report of the Joint National Committee on Prevention, Detection, Evaluation, and Treatment of High Blood Pressure. Arch Intern Med. 1997;157:2413–46. doi: 10.1001/archinte.157.21.2413. [DOI] [PubMed] [Google Scholar]
- 20.Chobanian AV, Bakris GL, Black HR, Cushman WC, Green LA, Izzo JL, et al. Seventh report of the Joint National Committee on Prevention, Detection, Evaluation, and Treatment of High Blood Pressure. Hypertension. 2003;42:1206–1252. doi: 10.1161/01.HYP.0000107251.49515.c2. [DOI] [PubMed] [Google Scholar]
- 21.ACCORD Study Group. Cushman WC, Evans GW, Byington RP, Goff DC, Jr, Grimm RH, Cutler JA, et al. Effects of intensive blood-pressure control in type 2 diabetes mellitus. N Engl J Med. 2010;362:1575–85. doi: 10.1056/NEJMoa1001286. [DOI] [PMC free article] [PubMed] [Google Scholar]
- 22.James PA, Oparil S, Carter BL, Cushman WC, Dennison-Himmelfarb C, Handler J, et al. 2014 Evidence-based guideline for the management of high blood pressure in adults. Report from the panel members appointed to the Eighth Joint National Committee (JNC 8) JAMA. 2013 doi: 10.1001/jama.2013.284427. [DOI] [PubMed] [Google Scholar]
- 23.Liu J, Sempos C, Donahue RP, Dorn J, Trevisan M, Grundy SM. Joint distribution of non- HDL and LDL cholesterol and coronary heart disease risk prediction among individuals with and without diabetes. Diab Care. 2005;28:1916–21. doi: 10.2337/diacare.28.8.1916. [DOI] [PubMed] [Google Scholar]
- 24.Executive Summary of the Third Report of the National Cholesterol Education Program (NCEP) Expert Panel on Detection, Evaluation, and Treatment of High Blood Cholesterol in Adults (Adult Treatment Panel III) JAMA. 2001;285:2486–2497. doi: 10.1001/jama.285.19.2486. [DOI] [PubMed] [Google Scholar]
- 25.Grundy SM, Cleeman JI, Merz CN, Brewer B, Jr, Clark LT, Hunninghake DB, et al. National Heart, Lung, and Blood Institute; American College of Cardiology Foundation; American Heart Association. Implications of recent clinical trials for the National Cholesterol Education Program Adult Treatment Panel III guidelines. Circulation. 2004;110:227–239. doi: 10.1161/01.CIR.0000133317.49796.0E. [DOI] [PubMed] [Google Scholar]
- 26.Hyre AD, Munter P, Menke A, Raggi P, He J. Trends in ATP-III-defined high blood cholesterol prevalence, awareness, treatment and control among U.S. adults. Ann Epidemiol. 2007;17:548–555. doi: 10.1016/j.annepidem.2007.01.032. [DOI] [PubMed] [Google Scholar]
- 27.Rose GA, Blackburn H, Gillium RF, Prineas RJ. Cardiovascular Survey Methods. 2. Geneva, Switzerland: World Health Organization; 1982. [Google Scholar]
- 28.Muntner P, DeSalvo KB, Wildman RP, Raggi P, He J, Whelton PK. Trends in the prevalence, awareness, treatment, and control of cardiovascular disease risk factors among non-institutionalized patients with a history of myocardial infarction and stroke. Am J Epidemiol. 2006;163:913–20. doi: 10.1093/aje/kwj124. [DOI] [PubMed] [Google Scholar]
- 29.Stevens LA, Coresh J, Feldman HI, Greene T, Lash JP, Nelson RG, et al. Evaluation of the Modification of Diet in Renal Disease equation in a large diverse population. J Am Soc Nephrol. 2007;18:2749–57. doi: 10.1681/ASN.2007020199. [DOI] [PubMed] [Google Scholar]
- 30.Jones CA, Francis ME, Eberhardt MS, Chavers B, Coresh J, Engelgau M, et al. Microalbuminura in the US population: Third National Health and Nutrition Examination Survey. Am J Kid Dis. 2002;39:445–59. doi: 10.1053/ajkd.2002.31388. [DOI] [PubMed] [Google Scholar]
- 31.Selvin E, Manzi J, Stevens LA, Van Lente F, Lacher DA, Levey AS, Coresh J. Calibration of serum creatinine in the National Health and Nutrition Examination Surveys (NHANES) 1988–1994, 1999–2004. Am J Kidney Dis. 2007;59:918–26. doi: 10.1053/j.ajkd.2007.08.020. [DOI] [PubMed] [Google Scholar]
- 32.Holman RR, Paul SK, Bethel MA, Neil HAW, Matthews DR. Long-term follow-up after tight control of blood pressure in type 2 diabetes. N Engl J Med. 2008;359:1565–1576. doi: 10.1056/NEJMoa0806359. [DOI] [PubMed] [Google Scholar]
- 33.Ali MK, Bullard KM, Saaddine JB, Cowie CC, Imperatore G, Gregg EW. Achievement of goals in U.S. diabetes care, 1999–2010. N Engl J Med. 2013;368:1613–24. doi: 10.1056/NEJMsa1213829. [DOI] [PubMed] [Google Scholar]
- 34.Wilper AP, Woolhandler W, Lasser KE, McCormick D, Bor DH, Himmelstein DU. Hypertension, diabetes, and elevated cholesterol among insured and uninsured U.S. adults. Health Affairs. 2006;28:1151–59. doi: 10.1377/hlthaff.28.6.w1151. [DOI] [PubMed] [Google Scholar]
- 35.Brooks EL, Preis SR, Hwang SJ, Murabit JM, Benjamin EJ, Kelly-Hayes M, et al. Health insurance and cardiovascular disease risk factors. Am J Med. 2010;123:741–47. doi: 10.1016/j.amjmed.2010.02.013. [DOI] [PMC free article] [PubMed] [Google Scholar]
- 36.Ostchega Y, Hugher JP, Wright JD, McDowell MA, Louis T. Are demographic characteristics and health care access and utilization, and comorbid conditions associated with hypertension among US adults? Am J Hypertens. 2008;21:159–65. doi: 10.1038/ajh.2007.32. [DOI] [PubMed] [Google Scholar]
- 37.Briasoulis A, Agarwal V, Valachis A, Messerli FH. Antihypertensive effects of statins: A meta-analysis of prospective controlled studies. J Clin Hypertens. 2013;15:310–20. doi: 10.1111/jch.12081. [DOI] [PMC free article] [PubMed] [Google Scholar]
- 38.Nickenig G, Bäumer AT, Temur Y, Kebben D, Jockenhövel F, Böhm M. Statin-sensitive dysregulated AT1 receptor function and density in hypercholesterolemic men. Circulation. 1999;100:2131–34. doi: 10.1161/01.cir.100.21.2131. [DOI] [PubMed] [Google Scholar]
- 39.Gupta AK, Nasothimiou EG, Chang CL, Sever PS, Dahlöf B, Poulter NR. Baseline predictors of resistant hypertension in the Anglo-Scandinavian Cardiac Outcome Trial (ASCOT): a risk score to identify those at high-risk. J Hypertension. 2011;29:2014–13. doi: 10.1097/HJH.0b013e32834a8a42. [DOI] [PubMed] [Google Scholar]
- 40.Boekholdt SM, Arsenault BJ, Mora S, et al. Association of LDL cholesterol, non-HDL cholesterol, and apolipoprotein B levels with risk of cardiovascular events among patients treated with statins: a meta-analysis. JAMA. 2012;307:1302–1309. doi: 10.1001/jama.2012.366. [DOI] [PubMed] [Google Scholar]
- 41.Stone NJ, Robinson J, Lichtenstein AH, Bairey Merz N, Blum CB, Stone NJ, et al. 2013 ACC/AHA guideline on the treatment of blood cholesterol to reduce atherosclerotic cardiovascular risk in adults: a report of the American College of Cardiology/American Heart Association Task Force on Practice Guidelines. Circulation. 2013 doi: 10.1161/01.cir.0000437738.63853.7a. published online ahead of print. [DOI] [Google Scholar]
- 42.Huxley R, Barzi F, Woodward M. Excess risk of fatal coronary heart disease associated with diabetes in men and women: Meta-analysis of 37 prospective cohort studies. BMJ. 2006;332:73–78. doi: 10.1136/bmj.38678.389583.7C. [DOI] [PMC free article] [PubMed] [Google Scholar]