

Abstract
Brassica napus (oilseed rape, canola) is one of the world’s most important sources of vegetable oil for human nutrition and biofuel, and also a model species for studies investigating the evolutionary consequences of polyploidisation. Strong bottlenecks during its recent origin from interspecific hybridisation, and subsequently through intensive artificial selection, have severely depleted the genetic diversity available for breeding. On the other hand, high-throughput genome profiling technologies today provide unprecedented scope to identify, characterise and utilise genetic diversity in primary and secondary crop gene pools. Such methods also enable implementation of genomic selection strategies to accelerate breeding progress. The key prerequisite is availability of high-quality sequence data and identification of high-quality, genome-wide sequence polymorphisms representing relevant gene pools. We present comprehensive genome resequencing data from a panel of 52 highly diverse natural and synthetic B. napus accessions, along with a stringently selected panel of 4.3 million high-confidence, genome-wide SNPs. The data is of great interest for genomics-assisted breeding and for evolutionary studies on the origins and consequences in allopolyploidisation in plants.
Subject terms: Next-generation sequencing, DNA sequencing, Plant genetics, Agricultural genetics, Plant breeding
Background and Summary
Detailed knowledge of genome-level diversity is an important prerequisite for understanding the inheritance of complex traits related to crop performance, and for implementation of genome-based performance prediction to accelerate breeding progress. Ultra-high throughput, array-based genotyping platforms enable cheap and efficient whole-genome profiling in any species for which suitable DNA sequence polymorphism datasets are available. The recent publications of reference sequences for the allopolyploid genome of oilseed rape1 and its diploid progenitor species, Brassica rapa2 and Brassica oleracea3, open the possibility for large-scale genomic resequencing to discover and utilise DNA sequence diversity in the primary and secondary gene pools of these important crops.
Furthermore, the unique ability to generate synthetic B. napus, from de novo interspecific hybridisation between B. rapa and B. oleracea, provides the opportunity to capture completely novel B. napus variants to diversify the primary gene pool of cultivated oilseed forms4. Synthetic B. napus has also become an important model to study homoeologous chromosome pairing, inter-subgenomic chromosome exchanges and gene conversions resulting from de novo allopolyploidisation. Numerous examples demonstrate the influence and consequences of natural or artificial selection on particular chromosome exchanges for the expression of important agronomic traits1,5. To capture, recombine and utilise such variation for high-resolution trait dissection and genomics-based pre-breeding, we first established a highly diverse panel of 50 natural and synthetic B. napus accessions. These were subsequently used as founder lines for the development of large populations for nested association mapping (NAM6) and heterotic haplotype capture (HHC4). 30 of the founder accessions were selected to sample allelic variation as evenly as possible across the gene pools of diverse winter-type B. napus morphotypes, including fodder rapes, kales, and old European and Asian oilseed forms (B. napus ssp. napus), along with rutabaga/swede (B. napus ssp. napobrassica). The remaining 20 founder accessions comprise synthetic B. napus, generated through interspecific hybrids of genetically highly divergent representatives of the diploid A and C donor genomes of the allopolyploid B. napus. Two additional, modern breeding lines were used as recurrent parents for the generation of the NAM lines and HHC populations, respectively4.
Whole-genome resequencing data was generated for the 50 accessions from the diversity panel, and for the two recurrent parents, using the Illumina HiSeq 2000 next-generation sequencing platform. Paired-end, 100 bp sequence reads were generated to an average depth of between 12x and 15x genome coverage. A total of 3.4 billion quality-trimmed paired reads (685 Gb) was utilized for the alignment to the B. napus Darmor-bzh v4.2 reference genome. Using different, stringent variant calling strategies, a total of 4.3 million high-confidence, genome-wide single-nucleotide polymorphisms (SNPs) were detected across the 52 genomes.
This paper reports these DNA sequence and SNP variant datasets in their entirety. These data are expected to be of considerable interest to breeders and geneticists working with Brassica crops, and to evolutionary biologists investigating polyploid evolution and the genome-scale consequences of natural or artificial selection. Furthermore, the data represent a foundation for development of new, ultrahigh-density variant screening arrays for population-level trait analysis and genomic selection.
Methods
The Pre-BreedYield diversity set (PBY collection)
The primary sequencing panel of 30 natural B. napus accessions was selected from a species-wide pool of more than 500 highly diverse B. napus accessions described by7. By analysing the sequences of conserved genes across this entire diversity set we selected 30 homozygous inbred accessions that best represented the species-wide diversity present in this panel. The selected accessions include fodder rapes, kales, old European and Asian oilseed forms (all B. napus ssp. napus), along with rutabaga/swede forms (B. napus ssp. napobrassica). The genetic diversity of the 30 natural B. napus accessions was further expanded by adding 20 synthetic B. napus accessions developed by embryo rescue from interspecific hybridizations between highly diverse parental origins (Table 1). The development and origins of the synthetic B. napus accessions are described in detail by Girke8 and Jesske9. The Pre-BreedYield (PBY) collection was completed by two additional, modern breeding lines that were used as recurrent parents for the generation of the NAM lines and HHC populations, respectively4. Whole-genome shotgun sequencing (WGS) was performed for each of the 52 lines included in the PBY collection (Table 2 (available online only)).
Table 1. Origins of 20 synthetic accessions.
| Accession name | Genotype Code | Form | Mother | Father |
|---|---|---|---|---|
| For each of the synthetic forms in the PBY collection the parents are given to illustrate the origin. | ||||
| Resyn-Go S4 | PBY021 | Synthetic | B. rapa ssp.rapa | B.oleracea convar. acephala |
| G 50 | PBY031 | Synthetic | B. oleracea conv. acephala var. gongyloides | B. rapa ssp. oleifera |
| H44 | PBY032 | Synthetic | B. oleracea conv. capitata var. sabauda | B. rapa ssp. pekinensis |
| H 149 | PBY033 | Synthetic | B. oleracea conv. capitata var. medullosa | B. rapa ssp. chinensis |
| H 165 | PBY034 | Synthetic | B. oleracea conv. capitata var. sabauda | B. rapa ssp. chinensis |
| H 176 | PBY035 | Synthetic | B. oleracea conv. capitata var. sabauda | B. rapa ssp. pekinensis var. laxa |
| R53 | PBY036 | Synthetic | B. oleracea conv. capitata var. sabellica | B. rapa ssp. pekinensis |
| R76 | PBY037 | Synthetic | B. oleracea conv. botrytis var. alboglabra | B. rapa ssp. oleifera |
| RS 4/6 | PBY038 | Synthetic | B. rapa ssp. pekinensis | B. oler.conv. capitata var. sabellica x B. oler. conv. gemmifera |
| RS 10/7 | PBY039 | Synthetic | B. rapa ssp. trilocularis | B. oleracea conv. fructicosa |
| RS 13/6 | PBY040 | Synthetic | B. rapa ssp. pekinensis | B. oleracea conv. botrytis var. alboglabra |
| S 13 | PBY041 | Synthetic | B. rapa ssp. oleifera 4x | B. oleracea conv. capitata var. medullosa |
| OLL 1 | PBY043 | Synthetic | B. rapa ssp. oleifera | B. oleracea ssp. oleracea |
| R 99 | PBY046 | Synthetic | B. oleracea conv. capitata var. capitata | B. rapa ssp. pekinensis |
| RS 7/6 | PBY047 | Synthetic | B. rapa ssp. pekinensis | B. oleracea conv. capitata var. medullosa |
| RS 8/6 | PBY048 | Synthetic | B. rapa ssp. pekinensis | B. oler. conv. capitata var. medullosa x B. oler. conv. gemmifera |
| S 39 | PBY049 | Synthetic | B. oleracea conv. capitata var. capitata | B. rapa ssp. chinensis |
| CRY 1 | PBY050 | Synthetic | B. rapa ssp. trilocularis | B. cretica |
| HIY 1 | PBY051 | Synthetic | B. rapa ssp. trilocularis | B. hilarionis |
| MOY 4 | PBY052 | Synthetic | B. rapa ssp. trilocularis | B. montana |
Table 2. Summary of re-sequencing data and read alignment metrics.
|
Genotype information
|
Raw reads
|
Quality- trimmed reads
|
Un-gapped read alignment (SNPs)
|
Gapped read alignment (InDels)
|
||||||||||||||||||
|---|---|---|---|---|---|---|---|---|---|---|---|---|---|---|---|---|---|---|---|---|---|---|
| Accession name | Genotype Code | Form | Paired-end reads | GC percent | X-fold coverage | Paired end reads (quality trimmed) | GC content | X-fold coverage | Number of aligned and paired reads | Properly paired in alignment [%] | Average quality | Insert size average (bp) | Insert size standard deviation (bp) | Reference genome covered by >4 reads (bp) | Percentage of reference genome covered by >4 reads | Number of aligned and paired reads | Properly paired in alignment [%] | Average quality | Insert size average (bp) | Insert size standard deviation (bp) | Reference genome covered by >4 reads (bp) | Percentage of reference genome covered by >4 reads |
| Detailed description of the whole-genome re-sequencing data from 52 Brassica napus accessions and corresponding read alignment performance. | ||||||||||||||||||||||
| Dippes | PBY001 | Oilseed | 76,678,771 | 36.07 | 13.57 | 59,784,163 | 35.15 | 10.55 | 44,694,294 | 74.76 | 69.2 | 190 | 43.3 | 574,275,985 | 67.54 | 56,268,693 | 94.12 | 69.2 | 192 | 44.70 | 621,867,140 | 73.14 |
| Gross-Luesewitzer | PBY002 | Oilseed | 94,147,683 | 36.44 | 16.66 | 70,776,879 | 35.37 | 12.49 | 51,737,830 | 73.10 | 69.1 | 180 | 42.3 | 589,786,241 | 69.36 | 66,533,247 | 94.00 | 69.2 | 181 | 43.80 | 637,384,608 | 74.96 |
| Jupiter | PBY003 | Oilseed | 82,683,075 | 36.25 | 14.63 | 60,770,841 | 35.61 | 10.72 | 42,836,550 | 70.49 | 69.1 | 289 | 93.5 | 558,142,391 | 65.64 | 53,431,420 | 87.92 | 69.1 | 278 | 85.90 | 613,742,287 | 72.18 |
| Kromerska | PBY004 | Oilseed | 221,452,664 | 35.98 | 39.20 | 156,338,699 | 35.07 | 27.59 | 105,796,574 | 67.67 | 69.0 | 298 | 97.7 | 652,752,882 | 76.77 | 137,254,345 | 87.79 | 69.0 | 287 | 90.60 | 690,951,227 | 81.26 |
| Major | PBY007 | Oilseed | 86,415,347 | 36.36 | 15.29 | 65,912,007 | 35.35 | 11.63 | 48,544,782 | 73.65 | 69.1 | 194 | 50.4 | 573,829,678 | 67.49 | 61,525,463 | 93.34 | 69.2 | 195 | 51.30 | 622,722,929 | 73.24 |
| Skziverskij | PBY010 | Oilseed | 43,855,559 | 36.66 | 7.76 | 39,006,814 | 36.33 | 6.89 | 29,448,099 | 75.49 | 69.4 | 208 | 51.7 | 426,946,858 | 50.21 | 36,559,645 | 93.73 | 69.4 | 209 | 52.70 | 486,974,475 | 57.27 |
| Start | PBY011 | Oilseed | 48,236,482 | 36.55 | 8.54 | 43,135,096 | 36.26 | 7.62 | 33,180,006 | 76.92 | 69.4 | 214 | 52.0 | 493,108,977 | 57.99 | 40,646,849 | 94.23 | 69.4 | 214 | 52.80 | 541,202,802 | 63.65 |
| Aragon | PBY012 | Oilseed | 116,546,982 | 36.26 | 20.63 | 81,161,229 | 34.92 | 14.32 | 59,827,873 | 73.71 | 69.0 | 200 | 50.4 | 612,921,838 | 72.08 | 76,074,196 | 93.73 | 69.0 | 201 | 51.60 | 655,908,047 | 77.14 |
| Beluga | PBY013 | Oilseed | 88,007,335 | 36.35 | 15.58 | 68,115,427 | 35.41 | 12.02 | 51,144,032 | 75.08 | 69.2 | 192 | 47.8 | 603,238,432 | 70.94 | 64,012,428 | 93.98 | 69.2 | 193 | 48.90 | 643,354,941 | 75.66 |
| Olimpiade | PBY014 | Oilseed | 75,136,422 | 36.71 | 13.30 | 56,571,878 | 35.34 | 9.98 | 41,071,490 | 72.60 | 69.0 | 171 | 42.0 | 535,429,640 | 62.97 | 52,992,427 | 93.67 | 69.0 | 172 | 43.40 | 593,896,859 | 69.85 |
| Wotan | PBY015 | Oilseed | 99,373,470 | 36.30 | 17.59 | 75,603,290 | 35.58 | 13.35 | 55,729,238 | 73.71 | 69.1 | 202 | 48.4 | 606,916,516 | 71.38 | 70,982,677 | 93.89 | 69.1 | 203 | 49.60 | 653,524,802 | 76.86 |
| Canberra x Courage DH | PBY017 | Oilseed | 81,363,434 | 36.24 | 14.40 | 59,434,864 | 35.62 | 10.48 | 44,036,290 | 74.09 | 69.1 | 301 | 86.3 | 566,104,615 | 66.58 | 53,994,885 | 90.85 | 69.1 | 293 | 83.60 | 611,690,770 | 71.94 |
| Darmor | PBY018 | Oilseed | 91,568,141 | 36.35 | 16.21 | 66,926,680 | 35.18 | 11.81 | 52,712,525 | 78.76 | 69.1 | 183 | 44.2 | 645,346,272 | 75.90 | 63,758,847 | 95.27 | 69.1 | 185 | 45.90 | 662,009,080 | 77.86 |
| Resyn-Go S4 | PBY021 | Synthetic | 58,724,730 | 36.41 | 10.39 | 44,243,684 | 35.81 | 7.81 | 32,413,472 | 73.26 | 69.1 | 227 | 82.3 | 476,529,225 | 56.04 | 40,339,341 | 91.18 | 69.1 | 224 | 77.40 | 535,689,158 | 63.00 |
| Alaska | PBY022 | Oilseed | 109,827,023 | 36.31 | 19.44 | 75,705,714 | 34.95 | 13.36 | 55,523,963 | 73.34 | 69.0 | 196 | 51.8 | 611,910,833 | 71.96 | 70,658,742 | 93.33 | 69.0 | 197 | 53.10 | 652,374,189 | 76.72 |
| Pirola | PBY023 | Oilseed | 66,697,170 | 36.67 | 11.80 | 48,166,363 | 35.22 | 8.49 | 35,879,099 | 74.49 | 69.0 | 160 | 38.4 | 514,381,538 | 60.49 | 45,025,535 | 93.48 | 69.0 | 161 | 40.60 | 562,153,242 | 66.11 |
| Rapid | PBY024 | Oilseed | 87,861,325 | 36.31 | 15.55 | 61,778,308 | 34.89 | 10.89 | 45,304,316 | 73.33 | 68.9 | 207 | 51.1 | 554,202,556 | 65.18 | 58,094,485 | 94.04 | 69.0 | 208 | 51.90 | 608,752,906 | 71.59 |
| Pacific | PBY025 | Oilseed | 60,057,624 | 36.09 | 10.63 | 43,187,827 | 35.44 | 7.62 | 31,745,436 | 73.50 | 69.1 | 311 | 92.7 | 461,996,374 | 54.33 | 38,168,913 | 88.38 | 69.1 | 300 | 86.90 | 511,940,298 | 60.21 |
| Savannah | PBY026 | Oilseed | 89,632,389 | 36.21 | 15.86 | 61,795,222 | 35.38 | 10.90 | 44,445,830 | 71.92 | 69.0 | 312 | 87.2 | 564,166,288 | 66.35 | 55,541,939 | 89.88 | 69.0 | 304 | 85.10 | 618,531,215 | 72.74 |
| Vivol | PBY027 | Oilseed | 84,211,160 | 36.18 | 14.90 | 57,826,789 | 35.28 | 10.20 | 41,981,621 | 72.60 | 69.0 | 319 | 83.1 | 567,378,895 | 66.73 | 51,951,765 | 89.84 | 69.0 | 310 | 81.70 | 617,267,311 | 72.59 |
| Expert | PBY029 | Oilseed | 90,794,664 | 36.19 | 16.07 | 63,499,906 | 34.94 | 11.20 | 47,915,177 | 75.45 | 69.0 | 200 | 49.7 | 588,869,405 | 69.25 | 59,906,715 | 94.34 | 69.0 | 201 | 50.90 | 628,916,009 | 73.96 |
| G 50 | PBY031 | Synthetic | 69,292,095 | 36.45 | 12.26 | 52,124,064 | 35.41 | 9.20 | 36,045,422 | 69.15 | 69.1 | 178 | 41.1 | 487,156,619 | 57.29 | 48,497,178 | 93.04 | 69.1 | 180 | 43.10 | 554,066,351 | 65.16 |
| H44 | PBY032 | Synthetic | 81,342,525 | 36.05 | 14.40 | 58,060,866 | 35.24 | 10.24 | 31,380,639 | 54.05 | 69.1 | 303 | 80.6 | 352,818,694 | 41.49 | 49,716,664 | 85.63 | 69.1 | 296 | 79.20 | 505,875,655 | 59.49 |
| H 149 | PBY033 | Synthetic | 119,715,932 | 36.84 | 21.19 | 87,460,199 | 35.41 | 15.41 | 56,753,965 | 64.89 | 69.0 | 180 | 44.3 | 518,733,148 | 61.01 | 80,844,771 | 92.44 | 69.0 | 182 | 45.90 | 596,578,095 | 70.16 |
| H 165 | PBY034 | Synthetic | 84,221,458 | 36.51 | 14.91 | 65,696,304 | 35.42 | 11.58 | 41,587,341 | 63.30 | 69.1 | 172 | 38.6 | 437,676,631 | 51.47 | 60,464,043 | 92.04 | 69.1 | 173 | 40.40 | 532,940,940 | 62.68 |
| H 176 | PBY035 | Synthetic | 61,418,643 | 36.55 | 10.87 | 45,834,995 | 35.30 | 8.08 | 31,463,046 | 68.64 | 69.0 | 158 | 36.7 | 445,138,849 | 52.35 | 42,526,409 | 92.78 | 69.0 | 160 | 39.30 | 513,594,698 | 60.40 |
| R53 | PBY036 | Synthetic | 83,546,570 | 36.15 | 14.79 | 60,205,621 | 35.37 | 10.62 | 37,056,142 | 61.55 | 69.1 | 296 | 79.2 | 430,083,214 | 50.58 | 53,441,660 | 88.77 | 69.1 | 290 | 77.90 | 540,628,366 | 63.58 |
| R76 | PBY037 | Synthetic | 98,794,991 | 35.98 | 17.49 | 64,143,850 | 35.04 | 11.31 | 35,388,261 | 55.17 | 69.0 | 317 | 91.8 | 359,020,986 | 42.22 | 53,433,110 | 83.30 | 69.0 | 305 | 85.40 | 506,095,979 | 59.52 |
| RS 4/6 | PBY038 | Synthetic | 81,483,259 | 36.08 | 14.42 | 54,498,882 | 35.20 | 9.62 | 31,029,708 | 56.94 | 69.0 | 304 | 92.1 | 336,708,852 | 39.60 | 46,201,391 | 84.77 | 69.0 | 295 | 86.30 | 479,768,131 | 56.42 |
| RS 10/7 | PBY039 | Synthetic | 94,857,523 | 36.48 | 16.79 | 67,633,538 | 35.06 | 11.91 | 38,084,714 | 56.31 | 68.9 | 204 | 48.7 | 339,969,197 | 39.98 | 61,088,658 | 90.32 | 69.0 | 205 | 49.00 | 493,189,002 | 58.00 |
| RS 13/6 | PBY040 | Synthetic | 82,610,127 | 36.24 | 14.62 | 55,260,011 | 35.31 | 9.75 | 29,984,948 | 54.26 | 69.0 | 293 | 89.3 | 368,149,785 | 43.30 | 46,680,728 | 84.47 | 69.0 | 284 | 83.80 | 530,955,765 | 62.44 |
| S 13 | PBY041 | Synthetic | 70,965,496 | 36.39 | 12.56 | 59,586,472 | 35.91 | 10.53 | 44,004,589 | 73.85 | 69.2 | 212 | 50.7 | 562,282,029 | 66.13 | 55,810,435 | 93.66 | 69.3 | 213 | 51.40 | 617,298,198 | 72.60 |
| OLL 1 | PBY043 | Synthetic | 126,776,353 | 36.55 | 22.44 | 91,718,467 | 35.20 | 16.17 | 55,323,797 | 60.32 | 69.0 | 169 | 39.5 | 557,150,401 | 65.52 | 84,932,745 | 92.60 | 69.0 | 169 | 40.30 | 631,219,134 | 74.24 |
| Chuosenshu | PBY044 | Vegetable | 100,155,618 | 36.04 | 17.73 | 73,046,310 | 34.90 | 12.89 | 53,417,179 | 73.12 | 69.1 | 191 | 48.3 | 582,060,841 | 68.45 | 68,384,909 | 93.62 | 69.1 | 193 | 49.70 | 633,249,610 | 74.47 |
| Grüner Schnittkohl | PBY045 | Vegetable | 71,064,314 | 36.85 | 12.58 | 53,814,404 | 35.51 | 9.48 | 39,276,697 | 72.98 | 69.1 | 185 | 43.4 | 504,681,041 | 59.35 | 50,391,710 | 93.64 | 69.1 | 186 | 45.00 | 567,794,080 | 66.78 |
| R 99 | PBY046 | Synthetic | 50,101,606 | 36.41 | 8.87 | 39,869,551 | 35.43 | 7.03 | 27,671,055 | 69.40 | 69.1 | 158 | 41.1 | 378,685,300 | 44.54 | 36,736,402 | 92.14 | 69.1 | 159 | 41.80 | 441,672,434 | 51.94 |
| RS 7/6 | PBY047 | Synthetic | 89,334,621 | 36.46 | 15.81 | 63,532,993 | 34.96 | 11.19 | 32,635,263 | 51.36 | 69.0 | 199 | 46.3 | 376,174,589 | 44.24 | 57,141,393 | 89.94 | 69.0 | 200 | 47.70 | 541,252,777 | 63.65 |
| RS 8/6 | PBY048 | Synthetic | 112,253,074 | 36.39 | 19.87 | 79,432,078 | 34.97 | 14.00 | 44,616,185 | 56.16 | 69.0 | 197 | 46.3 | 495,240,889 | 58.24 | 73,354,735 | 92.35 | 69.0 | 198 | 47.30 | 605,072,064 | 71.16 |
| S 39 | PBY049 | Synthetic | 94,470,389 | 36.16 | 16.72 | 71,720,158 | 35.46 | 12.67 | 48,963,355 | 68.27 | 69.1 | 209 | 50.6 | 540,592,853 | 63.58 | 66,876,537 | 93.25 | 69.1 | 209 | 51.20 | 606,649,247 | 71.35 |
| CRY 1 | PBY050 | Synthetic | 90,794,664 | 36.19 | 16.07 | 61,950,538 | 35.36 | 10.93 | 30,156,437 | 48.68 | 69.0 | 307 | 88.5 | 252,335,100 | 29.68 | 51,093,132 | 82.47 | 69.0 | 298 | 83.50 | 466,891,231 | 54.91 |
| HIY 1 | PBY051 | Synthetic | 78,128,948 | 36.35 | 13.83 | 54,999,607 | 35.56 | 9.70 | 29,920,622 | 54.40 | 69.0 | 306 | 89.1 | 311,071,983 | 36.58 | 46,187,021 | 83.98 | 69.1 | 297 | 84.40 | 482,891,235 | 56.79 |
| MOY 4 | PBY052 | Synthetic | 79,060,123 | 36.38 | 13.99 | 55,935,096 | 35.60 | 9.87 | 25,379,215 | 45.37 | 69.0 | 306 | 84.7 | 210,927,095 | 24.81 | 45,743,860 | 81.78 | 69.1 | 297 | 81.40 | 445,926,978 | 52.44 |
| English Giant 194 | PBY053 | Fodder | 83,612,186 | 36.06 | 14.80 | 61,894,909 | 35.23 | 10.92 | 43,333,520 | 70.01 | 69.1 | 303 | 93.8 | 550,031,128 | 64.69 | 53,944,017 | 87.15 | 69.1 | 292 | 87.70 | 610,712,975 | 71.82 |
| Nunsdale | PBY054 | Fodder | 91,414,162 | 36.67 | 16.18 | 69,396,326 | 35.42 | 12.24 | 50,155,140 | 72.27 | 69.0 | 179 | 42.3 | 570,416,274 | 67.08 | 65,012,943 | 93.68 | 69.0 | 180 | 44.10 | 625,170,716 | 73.52 |
| Palu | PBY055 | Fodder | 100,184,910 | 36.60 | 17.73 | 79,508,952 | 35.56 | 14.02 | 56,721,442 | 71.34 | 69.1 | 161 | 38.7 | 590,851,827 | 69.49 | 74,144,376 | 93.25 | 69.1 | 162 | 40.20 | 643,983,682 | 75.74 |
| Abukuma Natane | PBY056 | Oilseed | 98,085,738 | 36.22 | 17.36 | 67,332,540 | 34.87 | 11.88 | 49,633,312 | 73.71 | 69.0 | 204 | 47.3 | 589,653,819 | 69.35 | 63,121,031 | 93.75 | 69.0 | 205 | 48.80 | 634,545,437 | 74.63 |
| E94197 | PBY057 | Oilseed | 111,406,405 | 36.25 | 19.72 | 80,774,762 | 35.07 | 14.25 | 60,211,568 | 74.54 | 69.1 | 199 | 48.0 | 620,305,628 | 72.95 | 76,312,738 | 94.48 | 69.1 | 200 | 49.00 | 658,435,307 | 77.44 |
| Evvin | PBY058 | Oilseed | 92,253,176 | 36.41 | 16.33 | 71,127,080 | 35.43 | 12.55 | 49,724,957 | 69.91 | 69.2 | 199 | 47.8 | 540,442,856 | 63.56 | 66,073,934 | 92.90 | 69.2 | 200 | 48.80 | 617,691,761 | 72.64 |
| Fortin Family | PBY059 | Swede | 80,681,462 | 36.26 | 14.28 | 58,661,174 | 35.09 | 10.35 | 43,027,470 | 73.35 | 69.1 | 198 | 47.2 | 577,626,135 | 67.93 | 55,233,597 | 94.16 | 69.1 | 200 | 48.40 | 621,256,303 | 73.06 |
| Sensation NZ | PBY060 | Swede | 78,213,230 | 36.36 | 13.84 | 65,223,432 | 35.84 | 11.52 | 28,683,721 | 43.98 | 69.2 | 209 | 53.0 | 392,095,197 | 46.11 | 60,543,301 | 92.82 | 69.3 | 211 | 53.70 | 590,944,858 | 69.50 |
| DH 5 (Oase*Nugget) | PBY061 | Elite | 148,656,552 | 36.52 | 26.31 | 123,516,260 | 35.98 | 21.82 | 90,648,622 | 73.39 | 69.2 | 204 | 50.1 | 658,910,322 | 77.49 | 116,942,074 | 94.68 | 69.2 | 205 | 50.40 | 689,284,408 | 81.06 |
| MSL007C | PBY062 | Elite | 115,141,387 | 36.03 | 20.38 | 87,228,004 | 35.23 | 15.40 | 60,380,183 | 69.22 | 69.1 | 292 | 81.4 | 621,299,530 | 73.07 | 79,299,560 | 90.91 | 69.1 | 286 | 79.20 | 664,007,118 | 78.09 |
| Total | 4,673,308,987 | 1,889.61 | 827.13 | 3,440,929,123 | 1,838.34 | 607.06 | 2,328,627,012 | 3,517.77 | 3,591.9 | 11,743 | 3,106.8 | 26,336,526,251 | 3,097.31 | 3,143,897,619 | 4,745.76 | 3,592.7 | 11,637 | 3,076.70 | 30,420,496,830 | 3,577.61 | ||
| Average | 89,871,327 | 36.34 | 15.91 | 66,171,714 | 35.35 | 11.67 | 44,781,289 | 67.65 | 69.1 | 226 | 59.7 | 506,471,659 | 59.56 | 60,459,570 | 91.26 | 69.1 | 224 | 59.17 | 585,009,554 | 68.80 | ||
| Minimum | 43,855,559 | 35.98 | 7.76 | 39,006,814 | 34.87 | 6.89 | 25,379,215 | 43.98 | 68.9 | 158 | 36.7 | 210,927,095 | 24.81 | 36,559,645 | 81.78 | 69.0 | 159 | 39.30 | 441,672,434 | 51.94 | ||
| Maximum | 221,452,664 | 36.85 | 39.20 | 156,338,699 | 36.33 | 27.59 | 105,796,574 | 78.76 | 69.4 | 319 | 97.7 | 658,910,322 | 77.49 | 137,254,345 | 95.27 | 69.4 | 310 | 90.60 | 690,951,227 | 81.26 | ||
| Q1 quartile | 78,192,160 | 36.19 | 13.84 | 56,412,683 | 35.13 | 9.95 | 33,043,820 | 62.86 | 69.0 | 189 | 44.3 | 435,778,277 | 51.25 | 50,222,949 | 89.87 | 69.0 | 190 | 45.90 | 535,002,104 | 62.92 | ||
| Q3 quartile | 98,263,051 | 36.46 | 17.39 | 71,275,350 | 35.47 | 12.58 | 51,292,482 | 73.66 | 69.1 | 294 | 82.5 | 583,762,982 | 68.65 | 66,619,070 | 93.73 | 69.1 | 286 | 79.75 | 631,726,753 | 74.30 | ||
Sample preparation and whole-genome sequencing
The 52 B. napus accessions, including 30 adapted, 20 resynthesized and 2 elite lines, were resequenced using an Illumina HiSeq 2000 platform. For each sample 1 ug of gDNA has been fragmented into small fragments of 400 bp using the Covaris standard technology without any genomic reduction. The NEBNext DNA library kit was used to prepare the library, following the standard protocol. Cleaning and size selection were done using Ampure magnetic beads. Each amplified fragment has been paired end sequenced, generating short-reads of 100 bp to an average coverage of 12–15x (corresponding to 20 Gb per accession). The full sequence data for all 52 accessions is archived at the European Nucleotide Archive (www.ebi.ac.uk/ena) under the project numbers PRJEB5974 (Data Citation 1) and PRJEB6069 (Data Citation 2).
Raw data processing
The quality of the raw sequence data was validated using the FastQC software (http://www.bioinformatics.babraham.ac.uk/projects/fastqc/). Adapters were removed using cutadapt (https://cutadapt.readthedocs.org/) and the reads were trimmed for low quality bases with the fastx quality trimmer algorithm (http://hannonlab.cshl.edu/fastx_toolkit/), using the settings −t 30 −l 90 for trimming bases with a Phred quality score below 30 and removing reads shorter than 90 nt. Paired reads were then synchronized using an in-house Perl script (Data Citation 3). General quality statistics of raw and trimmed reads were generated using fastx_quality_stats (http://hannonlab.cshl.edu/fastx_toolkit/). In total over 3.4 billion quality-trimmed, paired-end reads were used, providing a total pre-processed data volume of 685 Gbp. Average G/C content changed slightly from 36.34 to 35.35 percent after trimming of raw reads, whereby the diverse genotype collection showed a range of G/C content from 34.87 to 36.33%, emphasizing the high variability. These values are comparable to previous calculations of 35.4% in B. rapa and 36.0% in B. oleracea10. In consequence of the stringent quality trimming the average sequencing depth per genotype decreased to ~11.7 fold, with a Q1 quartile of ~10.0 fold and a Q3 quartile of ~12.6 fold. This provides a sufficient coverage for in-depth diversity study across all genotypes. Table 2 (available online only) gives a complete list of basic statistics describing the raw and trimmed sequence data.
Whole genome alignment against the Brassica napus Darmor-bzh reference genome
The 1,130 Mb genome of the allopolyploid species B. napus1 is characterized by two highly similar sub-genomes. The A subgenome, derived from B. rapa, consists of 10 chromosomes, while the C subgenome contributed by B. oleracea has 9 chromosomes. The preprocessed sequence reads were mapped to the B. napus Darmor-bzh v4.2 reference genome using the SOAP2 software11 with the options −m 0, −x 500, −v 2. To achieve high confidence when aligning reads to the allopolyploid genome, we used an un-gapped alignment. This approach considers the close similarity of the two subgenomes, increasing the ratio of reads that were aligned to the correct subgenome. The SOAP2 output files with the positions of the aligned reads were converted to the Sequence Alignment/Map (SAM) format applying the 'soap2sam.pl' script (http://soap.genomics.org.cn/down/soap2sam.tar.gz), and then further converted into the binary version of the SAM format (BAM) using SAMtools view command12.
For the 52 different accessions an average of ~90 million reads per accession were aligned as proper read pairs, ranging from ~66.0 million reads at the first quartile (Q1) to ~102.6 million reads at the third quartile (Q3). A high average mapping quality was observed, with an average MAPQ value of ~69.1. The average insert sizes between corresponding read pairs ranged from 158 to 319 bp for the individual genotypes (Table 2 (available online only)). Regarding the proportion of the reference genome with sufficient read coverage, we observed large differences between genotypes particularly between natural versus synthetic accessions. This is expected due to large-scale chromosome rearrangements, including homoeologous non-reciprocal translocations, which are known to occur in synthetic B. napus during de novo allopolyploidisation [8]. Therefore we included only reference positions having a minimum of 4 reads aligned per reference position. The percentage of reference positions with sufficient read coverage (4) ranged between 51.3% (Q1) and 68.6% (Q3). Overall we discovered sufficient coverage for the natural B. napus accessions lines at 66.5% of all reference positions (Q1: 64.4% and Q3: 71.1%). In comparison, the synthetic B. napus accessions showed a significant overrepresentation of reference positions with missing data, with an average of only 48.4% (Q1: 41.1% and Q3: 57.5%) reference positions covered by at least 4 reads. Among the sequences with sufficient coverage in both groups, a higher sequence diversity compared to the B. napus Darmor-bzh reference sequence was observed in the synthetic accessions than in the adapted accessions.
To reveal INDEL mutations a gapped alignment is required that was constructed independently using Bowtie2 (ref. 13). To achieve high confidence the respective alignments were performed using ‘−-very-sensitive’ setting plus usage of long seed length (‘−L 28’) and suppressing of unpaired alignment (--no-mixed’). We observed a 35% increase in the percentage of aligned read pairs when comparing the total number of properly paired reads between the un-gapped and the gapped read alignment. In comparison to the un-gapped read alignment a lower stringency was applied to tolerate gaps. As a consequence the number of sequence mismatches increased, however we observed good concordance when comparing the respective alignments. The resulting average insert size of corresponding read pairs, calculated for each genotype individually, proved to have only a slight difference of ~4 bp, whereby the percentage of observed difference in insert sizes ranged from 0.6% in the Q1 quartile to 2.4% in the Q3 quartile. Together with an identical global alignment quality (average MAPQ value >69) we conclude a high quality and a good overall alignment confidence. For visual inspection of the constructed alignments we used Tablet14, a graphical viewer for sequence assembly and alignment resources.
The B. napus Darmor-bzh v4.2 reference genome1 was constructed with extensive sequencing capacities using an estimated 21.2-fold coverage of the genome by 454 sequences. For subsequent scaffolding these were extended by multiple long distance mate pair sequence libraries (8 and 20 kb) and Sanger BES of an available BAC library. The construction of the final assembly involved careful investigation to fill the gaps between scaffolds and improve the sequences by error correction applied in the post-assembly phase. However, the final assembly still consists in 13.2% of the sequence base pairs of ‘N’s indicating an ambiguity for the respective nucleotides bases. The structure of the reference genome sequence is organized in 19 B. napus chromosomes. In addition, around 25% (204.9 Mbp) of the sequences of the Darmor-bzh v4.2 reference genome could not be assigned within the assembly process. These contigs were concatenated either in random chromosomes, where the contigs could be assigned to a chromosome, and in a random 'unknown' chromosome where no specific assignment was possible. Altogether, these reported characteristics of the reference genome indicate that the complexity of a genome and its repetitive regions even with today’s sequencing capacities is not an easy task, especially in an allopolyploid plant like B. napus.
In our read alignments (Table 2 (available online only)) both the natural and the adapted accessions show on average only a low proportion of reference bases covered by reads (on average 66.5% in the adapted and 48.4% in the synthetic lines for the stringent read alignment). One reason might be homopolymer repeat lengths errors in the B. napus Darmor-bzh v4.2 reference sequence, which appear extensively in data sequenced with the 454 technology15. This is consistent with the increased coverage rate monitored in the gapped alignment. Another possible cause may be the parameters used for the alignment. In this study we focused on the detection of high quality, position-specific SNPs. Therefore, we selected stringent options for the SOAP2 alignment that exclude reads which are mapping with the same probability to more than one position within the genome. As the two subgenomes in the adapted accessions show a similarity of around 95%, a high proportion of reads was excluded from the alignment. The resynthesized lines include accessions with different parental origin. Due to this diversity we expect them to have only a low similarity with the reference genome of the adapted accession Darmor-bzh. Therefore stringent alignment parameters, allowing only two mismatches and no gaps, also lead to a high rate of unaligned reads, potentially leading to a low portion of reference bases being covered. This is also concordant with the results from the less stringent gapped alignment, showing a significantly higher rate of sequence coverage. Finally, for >13% the genomic sequence is not known and therefore is excluded from the read alignment process. In consequence, the genome coverage calculation relies on very stringent and cautious estimation settings and thus might be an underestimation. Relaxing the number of aligned reads (>=4), that are required to be considered as covered positions, affects this calculation substantially. Reducing this requirement to a single read the proportion of the genome coverage is substantially increased. On average 75.6% of the B. napus genome is covered for adapted and 65.1% for synthetic lines when analyzing the stringent SOAP2 read alignment. This further is increased to 81.4% and 77.4, respectively, when the relaxed Bowtie2 alignment is used. In summary, we are confident that the established read alignment resources are of high quality.
SNP discovery
For the genome-wide discovery of variant positions (VP), a single sample SNP calling was utilized individually for each of the accessions. To reveal diversity with highest sensitivity we performed an approach using multiple variant-calling methods. Significant variability can be found in variant sites detected by different SNP calling methods16, making it advisable to apply multiple alternative tools to avoid overlooking informative sites. On the other hand, the low concordance of different variant-calling pipelines17 makes it necessary to carefully investigate variant positions. Hence we performed variant calling with three different prediction methods, using the tools FaSD18, Freebayes19 and SAMtools12, followed by analysis of the concordance of the calls during the variant filtering. The schematic workflow of the SNP discovery process is depicted in Fig. 1. For VP calling with FaSD we applied the parameter ‘−d 4’ and the two-score cutoff thresholds of ‘−c1 3.2’ and ‘−c2 15.8’. For VP calling with Freebayes we used the parameter settings ‘−C 4’, ‘−R 0’, ‘−m 20’ and ‘−F 0.002’. For VP calling using SAMtools we used the parameter settings ‘−q 20’ and ‘−Q 13’.
Figure 1. Schematic pipeline of the data processing procedures.

The workflow is divided into six phases. Each genotype was processed individually by the pipeline to process the 685 Gbp of sequence data.
Variant filtering
A first posterior filtering was applied independently to all variant data sets (VCF files) before merging of the results from the multiple calling methods for construction of the final variant set. The independent application of multiple variant calling methods allowed us to use the variant caller count (VCC) as an additional confidence value for the prediction of variant positions. The VCC indicates how many variant calling methods predict a particular VP. All successful VP calls fulfil the following criteria in at least one of the genotypes: bi-allelic, SNP quality score >=100, homozygous, read depth >=4 and a VCC >=2. The final diversity set is published as a SNP matrix (Data Citation 4). To construct the SNP matrix the BAM files were converted into the PILEUP format using SAMtools ‘mpileup’ and together with the discovered variant positions these information is integrated by a custom script (Data Citation 3). For each variant position and genotype the putative allele(s) for the different variants are shown. For differentiation of homozygous and heterozygous positions all alternative alleles are required to succeed the minimal read depth >=4. Genotypes with insufficient or no read information (read depth <4) are presented as ‘NA’, while positions with no alternative allele call are presented with the reference allele. A variant position is defined as homozygous when the allele frequency (AF) in one of the variants is <10% or >90%. Homozygous positions are displayed by the corresponding nucleotides (‘AA’, ‘CC’, ‘GG’, ‘TT’), heterozygous positions (10% <=AF <=90%) with both observed alleles. Per genotype we only present the bi-allelic relationship using the first two major alleles. For the minimum quality score per variant site a cut-off value of 100 was used. Due to the complex polyploid nature of the B. napus genome, heterozygous positions caused by mis-aligned reads from paralogues regions are common, hence we only report homozygous SNPs. The distribution of unique, genome-wide B. napus variant positions the 52 resequenced genomes were depicted graphically in a condensed circular layout constructed using the tool Circos20 (Fig. 2). For clarity of the layout all reference sequences without a defined chromosome position (‘random’) were discarded from the plot. The high number of unassigned contigs indicates putative assembly problems, which might affect the distribution of genomic variation. However, the read alignment and variant calling was performed on the complete reference genome to achieve a comprehensive representation of diversity within the studied genotypes.
Figure 2. Diversity plot of 3.28 million variant positions (VPs, including SNPs and InDels) with defined chromosome positions visualized with Circos20.

The illustration shows the 19 chromosomes of the Brassica napus genome, ten from the A subgenome and nine from the C subgenome. The outermost track (A) displays the position of genes and the corresponding scale in Mbp. The distribution of gene models shows that genes are abundant in distal euchromatin compared to the marginal packing in centromeric regions. The two subsequent tracks (B) illustrate the comparative mean diversity between the two subgroups of natural and synthetic B. napus accessions as a blue histogram plot, and the average read coverage as red line plot, respectively. The mean diversity is calculated for each of the subgroups by using the number of identified VPs in a 500 kb window, divided by the number of accessions per subgroup. The inner tracks (C) display the observed diversity (number of VPs) for each of the resequenced 52 genotypes, illustrated as heatmaps by using SNP densities in 500 kb windows. Genotypes are ordered by the six subgroups (synthetic, fodder, elite, vegetable, swede and oilseed) and within each subgroup by descending number of VPs.
Repeat investigation
The B. napus Darmor-bzh genome assembly contains 34.5% transposable elements1. To gain knowledge about the repeat constitution in our genotype collection we performed a k-mer analysis, using an adapted Kmasker21 method focused on the repeat constitution of sequences surrounding the detected VP sites. For each of the 52 resequenced accessions we used ~1-fold sequence data (down sampling) to construct individual k-mer indices (totaling ~50-fold coverage). Each of these genotype-specific k-mer index was used to analyze the 100 bp flanking sequence (upstream and downstream) of a VP site. The combined and normalized results provided as data record represent a useful resource to estimate repeat occurrence (Data Citation 5). We found 545,846 VPs with increased k-mer values (>20) when calculating the average k-mer frequencies of flanking sequences. Within all these positions more than 40 genotypes (Q3) exhibited an increased k-mer frequency in either the left or the right flanking sequence. Validation in the B. napus Darmor-bzh reference genome demonstrated that, among the 4.3 million detected VPs, 693,004 (16.1%) were located in repeat regions and 3,610,807 (~83.9%) in non-repetitive reference positions. This analysis enables a more profound selection of VPs that are less likely to be affected by repeats.
Discovery of insertion-deletion polymorphisms
Calling of insertion-deletion polymorphisms (InDels) was performed independently from the SNP calling as a separate process, using a gapped alignment constructed with Bowtie2. BAM files of the read alignments were converted into PILEUP files using SAMtools ‘mpileup’. These were further processed by BCFtools22 to screen for insertion and deletions using the setting ‘−V indels’. Stringent parameter setting required a minimal base quality of ‘−Q 30’ and a minimal read alignment quality of ‘−q 20’. A posterior filtering was performed subsequently that is prioritizing InDel sites with a minimal (8) and maximal read depth (50), as well as a stringent IMF (0.9) and IDV (8) setting to identify high quality and homozygous sites. The latter two parameter control the maximal fraction of reads (IMF) and set the maximum number of reads (IDV) that support an InDel. In total we detected 633,844 insertions and 469,860 deletions in the range between −20 and 20 bp, whereby the large majority (~90%) are <=3 bp in length (Fig. 3). The highest number of InDels was detected in the synthetic B. napus accessions, where 9 out of 20 exceed the Q3 quartile (15,993 insertions and 11,852 deletions), whereas for the oilseed forms in only 3 of the 32 accessions an exaggerated InDel number was observed. On the other hand 13 accessions were detected to have fewer InDels than the Q1 quartile (7,313 insertions and 4,913 deletions), of which 10 are oilseed forms like the Darmor-bzh reference genotype. Accessions PBY047, which exhibited the highest number of insertions (28,972), and PBY0039, which exhibited the highest number of deletions (23,485), had more than 52.000 InDels, illustrating the high diversity within synthetic accessions. Analysis of InDels within coding regions of B. napus genes revealed a moderate enrichment of in-frame InDels (multiples of three nucleotides). This result is in accordance with previous findings in other species23.
Figure 3. Distribution of discovered InDel sizes.
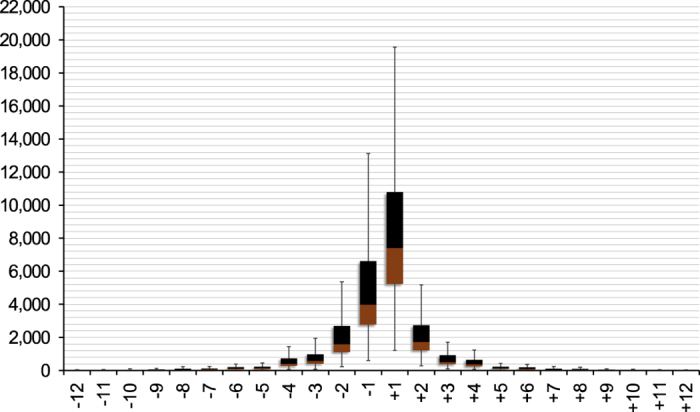
InDel calls of all 52 genotypes were evaluated. The plot displays the range between the quartiles Q1 and Q3 for a particular InDel size. Around 50% of all genotypes had InDel numbers within the depicted range. The boundary between the lower (brown) and upper (black) field for a particular InDel length represents the average number of InDels of that length which were detected in all of the 52 sequenced accessions.
Functional annotation of variations
We investigated the functional effects of SNP and InDel variant positions (VPs), distinguishing between synonymous and non-synonymous variations using the tool COOVAR24. For SNPs the class of non-synonymous SNPs (nsSNPs) was further differentiated into ‘radical’ SNPs, which can cause loss of function (LoF), and ‘moderate’ SNPs, which have lower potential to affect the gene function. The third class ‘low’ includes synonymous SNPs (synSNPs). These variations locate in coding regions, but do not affect the protein sequence. The fourth class ‘other’ includes non-coding SNPs (ncSNPs) that locate in intronic or intergenic regions. As expected, the majority of detected SNPs belong to the latter two classes, with 85.2% classified as ‘other’ and 7.8% as ‘low’. The complete listing of the distribution of SNPs within these 4 classes is given in Table 3. A total of 67,892 SNPs were classified as LoF, hence these results provide a valuable resource to study functional sequence diversification in B. napus. In total 39,446 different genes are affected in at least one of the studied genotypes by at least one radical SNP leading to a predicted LoF. A total of 5,121 genes are modified by InDels that lead to a predicted LoF. For InDels again, the classes ‘LoF’ and ‘moderate’ have minor proportions, with 1.32% and 0.48% respectively. With 98.2% the large majority of InDels is observed in intronic or intergenic regions (‘other’). The full set of gained functional annotation of SNPs and InDels are provided as a GVF file for each genotype (Data Citation 6).
Table 3. Functional annotation of SNPs and InDels.
| Variant type | Minor allele frequency | LoF (frame shift InDel, splice acceptor or donor, stop gained or lost, non-conservative) | Moderate (inframe InDel, conservative missense) | Low (synonymous) | Other (intronic or intergenic) | Total |
|---|---|---|---|---|---|---|
| The functional annotation of detected variants is summarised for different minor allele frequencies (MAF) and is categorized in 4 impact groups: 1) Loss of function (LoF), 2) moderate, 3) low and 4) other. An explanation of each group is provided in the text. Displayed percentages illustrate the proportion of each impact group within a MAF sub-category (row). | ||||||
| SNP | >=0.5% | 865 (1.46%) | 2,802 (4.74%) | 3,549 (6.00%) | 51,891 (87.79%) | 59,107 |
| 0.1–0.5% | 12,115 (1.64%) | 42,667 (5.79%) | 59,778 (8.11%) | 622,693 (84.46%) | 737,253 | |
| <0.1% | 54,912 (1.57%) | 186,261 (5.31%) | 272,773 (7.77%) | 2,994,658 (85.35%) | 3,508,604 | |
| all | 67,892 (1.58%) | 231,730 (5.38%) | 336,100 (7.81%) | 3,669,242 (85.23%) | 4,304,964 | |
| InDel | all | 14,051 (1.32%) | 5,083 (0.48%) | — | 1,043,726 (98.20%) | 1,062,860 |
A considerable proportion of the 101k B. napus gene models showed disruptions of the coding sequence by mutations (LoF, moderate or low). In total, we observed 488 highly diverse genes, affected in more than 32 genotypes. Furthermore, 11,818 genes were disrupted in a medium number of genotypes (>5 and <=32) and 24,708 genes in a low numbers of genotypes (<5=). Interestingly, a total of 61,594 (61.0%) gene models showed little or no nucleotide variability.
Code availability
All custom scripts applied for data processing are deposited as DOI (Data Citation 3). The developed custom scripts are available without restrictions. Applied software including version details are BLASTN (version 2.2.30), SOAP2 (version 2.21), Bowtie2 (version 2.2.5), cutadapt (version 1.8), FastQC (version 0.11.2), FaSD (version downloaded January 2015), Freebayes (version 0.9.21), SAMtools (version 0.1.19), BCFtools (version 1.2) and e!DAL (version 2.3.9). Applied parameter settings are described in the corresponding sections.
Data Records
The SNP matrix of the 4.3 million variant positions is published as DOI (Data Citation 4)4. Functional annotation of SNPs and InDels are available as GVF files (Data Citation 6). Repeat investigations of sequences encapsulating the variant positions are available as DOI (Data Citation 5). Scripts applied for data processing are deposited as DOI (Data Citation 3). All DOIs were generated using the tool e!DAL25.
Technical Validation
Overlap with Brassica napus 60k genotyping data
As a measure of quality we compared the results of the VP calling method with the outcome from the Illumina 60k SNP Brassica Consortium Infinium genotyping array applied on the same samples. Flanking sequences from the SNP markers on the genotyping array were anchored to the B. napus Darmor-bzh reference sequence (v. 4.2), utilising a stringent BLASTN analysis26,27 with parameter ‘−perc_identity 98’, ‘−evalue 10’, ‘−word_size 11’. The majority of SNP markers are embedded in 201 bp (N50 length is 201 bp, with overall lengths ranging from 62 to 301 bp). This information was used to set anchoring criteria requiring that 90% of the marker sequence is linked with 98% identity to the reference sequence. From 52,157 functional, polymorphic markers called by the array in the 52 genotypes, we assigned 35,534 different positions for 32,333 unique, high-confidence markers. Among these, 23,871 diverse reference positions (corresponding to 73.7% or 23,841 SNP markers) showed a direct overlap to a detected VP in the 52 accessions. In addition, we utilized a less stringent anchoring, using only the 50 bp oligonucleotide sequences of the SNP markers, and found an additional set of 6,371 SNPs overlapping the VPs that were identified in our study. In total, 30,242 diverse reference positions (23,871 with high stringency and 6,371 with relaxed stringency) could be directly validated by a marker from the 60k SNP array.
To verify the correctness of variant calling we further validated the concordance of alleles at detected positions with the allele information of the genotyping assay. In 99.87% of the stringently assigned SNP markers (99.08% in the relaxed assignment) we found concordance between the two data sets, except for cases where missing marker calls from the Infinium assay can be attributed to excessively stringent filtering of SNPs in the variant calling process. Non-concordance can also result from incomplete anchoring of markers to the reference sequence. Nevertheless, with over 30,000 validated marker positions and a high allele concordance of over 99.76%, we conclude an exceptionally high quality of the SNP predictions.
Usage Notes
Access to the plant materials described in this paper is possible for research purposes via a material transfer agreement with the material owners. Please contact Dr. Gunhild Leckband (g.leckband@german-seed-alliance.de).
Additional Information
Table 2 is only available in the online version of this paper.
How to cite this article: Schmutzer, T. et al. Species-wide genome sequence and nucleotide polymorphisms from the model allopolyploid plant Brassica napus. Sci. Data 2:150072 doi: 10.1038/sdata.2015.72 (2015).
Supplementary Material
Acknowledgments
The resources described here were generated within the German Plant 2030 research consortium ‘Pre-BreedYield: Precision breeding for yield gain in oilseed rape’. Funding was provided by grant FKZ0315964 from the German Federal Ministry of Education and Research (BMBF) with co-funding from the breeding companies German Seed Alliance GmbH, Norddeutsche Pflanzenzucht H.G. Lembke KG, Deutsche Saatveredelung AG, KWS Saat AG, Limagrain GmbH, Bayer Crop Science AG, and Syngenta Seeds GmbH. We thank all participants of the ‘Pre-BreedYield’ consortium for fruitful discussions.
Footnotes
E.D. and D.L. are employees of Syngenta Seeds GmbH. S.A. is full-time employees of Limagrain GmbH. F.B. is an employee of KWS Saat AG, P.D. is an employee of Bayer Crop Science AG, Z.M. is an employee of Deutsche Saatveredelung AG. A.A. is an employee of NPZ Innovation GmbH and G.L. is an employee of German Seed Alliance GmbH. The remaining authors declare no competing financial interests.
Data Citations
- Pre-BreedYield Consortium 2015. EMBL Nucleotide Sequence Database. http://www.ebi.ac.uk/ena/data/view/PRJEB5974
- Pre-BreedYield Consortium 2015. EMBL Nucleotide Sequence Database. http://www.ebi.ac.uk/ena/data/view/PRJEB6069
- Schmutzer T. 2015. IPK Gatersleben. http://dx.doi.org/10.5447/IPK/2015/7
- Schmutzer T. 2015. IPK Gatersleben. http://dx.doi.org/10.5447/IPK/2015/5
- Schmutzer T. 2015. IPK Gatersleben. http://dx.doi.org/10.5447/IPK/2015/8
- Schmutzer T. 2015. IPK Gatersleben. http://dx.doi.org/10.5447/IPK/2015/9
References
- Chalhoub B. et al. Early allopolyploid evolution in the post-Neolithic Brassica napus oilseed genome. Science (80-.) 345, 950–953 (2014). [DOI] [PubMed] [Google Scholar]
- Wang X. et al. The genome of the mesopolyploid crop species Brassica rapa. Nat. Genet. 43, 1035–1039 (2011). [DOI] [PubMed] [Google Scholar]
- Liu S. et al. The Brassica oleracea genome reveals the asymmetrical evolution of polyploid genomes. Nat. Commun 5, 3930 (2014). [DOI] [PMC free article] [PubMed] [Google Scholar]
- Snowdon R. J., Abbadi A., Kox T., Schmutzer T. & Leckband G. Heterotic Haplotype Capture: precision breeding for hybrid performance. Trends Plant Sci. 20, 410–413 (2015). [DOI] [PubMed] [Google Scholar]
- Harper A. L. et al. Associative transcriptomics of traits in the polyploid crop species Brassica napus. Nat. Biotechnol. 30, 798–802 (2012). [DOI] [PubMed] [Google Scholar]
- Yu J., Holland J. B., McMullen M. D. & Buckler E. S. Genetic design and statistical power of nested association mapping in maize. Genetics 178, 539–551 (2008). [DOI] [PMC free article] [PubMed] [Google Scholar]
- Bus A., Körber N., Snowdon R. J. & Stich B. Patterns of molecular variation in a species-wide germplasm set of Brassica napus. Theor. Appl. Genet. 123, 1413–1423 (2011). [DOI] [PubMed] [Google Scholar]
- Girke A. Neue Genpools aus resynthetisiertem Raps (Brassica napus L.) für die Hybridzüchtung. Doctoral dissertation, Georg-August-Universität Göttingen, Retrieved from https://ediss.uni-goettingen.de/handle/11858/00-1735-0000-0006-AEB2-3 (2002).
- Jesske T. Brassica-Wildarten als neue genetische Ressource für die Rapszüchtung. Doctoral dissertation, Georg-August-Universität Göttingen, Retrieved from https://ediss.uni-goettingen.de/handle/11858/00-1735-0000-0006-AB3E-3 (2011).
- Bus A., Hecht J., Huettel B., Reinhardt R. & Stich B. High-throughput polymorphism detection and genotyping in Brassica napus using next-generation RAD sequencing. BMC Genomics 13, 281 (2012). [DOI] [PMC free article] [PubMed] [Google Scholar]
- Li R. et al. SOAP2: An improved ultrafast tool for short read alignment. Bioinformatics 25, 1966–1967 (2009). [DOI] [PubMed] [Google Scholar]
- Li H. et al. The Sequence Alignment/Map format and SAMtools. Bioinformatics 25, 2078–2079 (2009). [DOI] [PMC free article] [PubMed] [Google Scholar]
- Langmead B. & Salzberg S. L. Fast gapped-read alignment with Bowtie 2. Nat. Methods 9, 357–359 (2012). [DOI] [PMC free article] [PubMed] [Google Scholar]
- Milne I. et al. Tablet--next generation sequence assembly visualization. Bioinformatics 26, 401–402 (2010). [DOI] [PMC free article] [PubMed] [Google Scholar]
- Balzer S., Malde K. & Jonassen I. Systematic exploration of error sources in pyrosequencing flowgram data. Bioinformatics 27, i304–i309 (2011). [DOI] [PMC free article] [PubMed] [Google Scholar]
- Muraya M. M., Schmutzer T., Ulpinnis C., Scholz U. & Altmann T. Targeted Sequencing Reveals Large-Scale Sequence Polymorphism in Maize Candidate Genes for Biomass Production and Composition. PLoS ONE 10, e0132120 (2015). [DOI] [PMC free article] [PubMed] [Google Scholar]
- O’Rawe J. et al. Low concordance of multiple variant-calling pipelines: practical implications for exome and genome sequencing. Genome Med 5, 28 (2013). [DOI] [PMC free article] [PubMed] [Google Scholar]
- Wang W. et al. FaSD-somatic: a fast and accurate somatic SNV detection algorithm for cancer genome sequencing data. Bioinformatics 30, 2498–2500 (2014). [DOI] [PubMed] [Google Scholar]
- Garrison E. & Marth G. Haplotype-based variant detection from short-read sequencing. arXiv preprint arXiv:1207.3907 (2012).
- Krzywinski M. et al. Circos: an information aesthetic for comparative genomics. Genome Res. 19, 1639–1645 (2009). [DOI] [PMC free article] [PubMed] [Google Scholar]
- Schmutzer T. et al. Kmasker—A Tool for in silico Prediction of Single-Copy FISH Probes for the Large-Genome Species Hordeum vulgare. Cytogenet. Genome Res. 142, 66–78 (2014). [DOI] [PubMed] [Google Scholar]
- Li H. A statistical framework for SNP calling, mutation discovery, association mapping and population genetical parameter estimation from sequencing data. Bioinformatics 27, 2987–2993 (2011). [DOI] [PMC free article] [PubMed] [Google Scholar]
- Li S. et al. SOAPindel: Efficient identification of indels from short paired reads. Genome Res. 23, 195–200 (2013). [DOI] [PMC free article] [PubMed] [Google Scholar]
- Vergara I. a, Frech C. & Chen N. CooVar: co-occurring variant analyzer. BMC Res. Notes 5, 615 (2012). [DOI] [PMC free article] [PubMed] [Google Scholar]
- Arend D. et al. e!DAL-a framework to store, share and publish research data. BMC Bioinformatics 15, 214 (2014). [DOI] [PMC free article] [PubMed] [Google Scholar]
- Boratyn G. M. et al. BLAST: a more efficient report with usability improvements. Nucleic Acids Res. 41, W29–W33 (2013). [DOI] [PMC free article] [PubMed] [Google Scholar]
- Camacho C. et al. BLAST+: architecture and applications BMC Bioinformatics 10, 421 (2009). [DOI] [PMC free article] [PubMed] [Google Scholar]
Associated Data
This section collects any data citations, data availability statements, or supplementary materials included in this article.
Data Citations
- Pre-BreedYield Consortium 2015. EMBL Nucleotide Sequence Database. http://www.ebi.ac.uk/ena/data/view/PRJEB5974
- Pre-BreedYield Consortium 2015. EMBL Nucleotide Sequence Database. http://www.ebi.ac.uk/ena/data/view/PRJEB6069
- Schmutzer T. 2015. IPK Gatersleben. http://dx.doi.org/10.5447/IPK/2015/7
- Schmutzer T. 2015. IPK Gatersleben. http://dx.doi.org/10.5447/IPK/2015/5
- Schmutzer T. 2015. IPK Gatersleben. http://dx.doi.org/10.5447/IPK/2015/8
- Schmutzer T. 2015. IPK Gatersleben. http://dx.doi.org/10.5447/IPK/2015/9