Significance
IL-6 is an important inflammatory cytokine and treatment target in rheumatoid arthritis. Genetic variation in the IL-6 proximal promoter is well-described, but its contribution to IL-6 regulation is uncertain. Numerous studies have shown contradictory associations between disease states and IL-6 promoter polymorphisms. Synovial fibroblasts are a major IL-6 producer in rheumatoid arthritis. We report a striking association between increased fibroblast IL-6 production and the IL-6 proximal promoter single nucleotide polymorphism rs1800795 minor allele genotype. In stark contrast, no association between human monocyte or HeLa cell IL-6 production and rs1800795 association was observed. These results point to fibroblast-specific pathways in IL-6 regulation and highlight that full understanding of the effects of genetic variation requires examination across cell types.
Keywords: IL-6, genetic polymorphism, fibroblasts, monocytes
Abstract
Interleukin (IL)-6 blockade is an effective treatment for rheumatoid arthritis (RA), and synovial fibroblasts are a major IL-6 producer in the inflamed joint. We found that human RA and osteoarthritis (OA) synovial fibroblasts derived from independent donors reproducibly segregated into low, medium, and high IL-6 producers, independent of stimulus, cell passage, or disease state. IL-6 expression pattern correlated strongly with total mRNA expression, not mRNA stability, suggesting transcriptional rather than posttranscriptional regulation. High-fibroblast IL-6 expression was significantly associated with the IL-6 proximal promoter single nucleotide polymorphism (SNP) rs1800795 minor allele (CC) genotype. In contrast, no association between this SNP and IL-6 production was detected in CD14+ monocytes, another major producer of synovial IL-6. Luciferase expression assays confirmed that this SNP was associated with differential IL-6 expression in fibroblasts. To date, several association studies examining rs1800795 allele frequency and disease risk have reported seemingly conflicting results ranging from no association to association with either the major or minor allele across a spectrum of conditions, including cancer and autoimmune, cardiovascular, infectious, and metabolic diseases. This study points to a prominent contribution from promoter genetic variation in fibroblast IL-6 regulation, but not in other IL-6–producing cell types. We propose that some of the heterogeneity in these clinical studies likely reflects the cellular source of IL-6 in specific diseases, much of which may be produced by nonhematopoietic cells. These results highlight that functional analysis of disease-associated SNPs on gene expression and pathologic processes must consider variation in diverse cell types.
The joint synovium is a delicate tissue that lines the articular cavity and produces synovial fluid, which nourishes cartilage and lubricates joint motion. The synovium has a structurally unique lining layer that contacts the synovial fluid and is comprised of a mixture of synovial fibroblasts and macrophages (1). In the normal joint, synovial macrophages function to clear debris through phagocytosis, whereas synovial fibroblasts remodel connective tissue and secrete the joint lubricants hyaluronan and lubricin. In rheumatoid arthritis (RA), autoimmune activation drives marked synovial lining hyperplasia, a classic hallmark of this disease. Synovial fibroblast hyperplasia is particularly critical to disease development. Synovial fibroblasts can directly invade cartilage, independent of the immune response (2), and loss of the cell adhesion molecule cadherin-11 on synovial fibroblasts blocks both inflammation and cartilage erosion in a mouse inflammatory arthritis model (3).
In RA, synovial fibroblasts stimulate disease development both through direct cell-to-cell interactions and by secretion of many potent mediators that promote inflammation, cartilage degradation, bone erosion, and angiogenesis (4). In particular, synovial fibroblasts have been shown to be a major producer of the cytokine IL-6 (5). IL-6 is an important pleiotropic cytokine with diverse effects throughout the body, including stimulating acute phase responses, osteoclast differentiation, B-cell proliferation, and T-cell differentiation (6). Development of effective anti-IL-6 receptor therapies for RA highlights its critical role in disease pathogenesis.
Preliminary observations with activated human synovial fibroblasts suggested a wide-ranging, donor-dependent IL-6 response to inflammatory stimuli such as tumor necrosis factor (TNF)-α or IL-1. Regulation of IL-6 expression is complex and involves interactions between transcriptional factors, including NF-κB and CCAAT/enhancer-binding protein (C/EBP)-β (7–9). IL-6 mRNA stability is also posttranscriptionally regulated through AU-rich response elements and other factors (10, 11). Finally, genetic and epigenetic factors such as promoter single nucleotide polymorphisms and DNA methylation may also contribute to IL-6 expression (12–15). The objective of this study was to define the heterogeneity in human synovial fibroblast IL-6 responses and to better understand the factors regulating this heterogeneity. We show that synovial fibroblasts segregate into distinct IL-6 response patterns that are significantly associated with an IL-6 proximal promoter SNP, rs1800795, defining a genetic influence on fibroblast IL-6 expression that was not shared by other tested cell types.
Results
Synovial Fibroblasts from Different Donors Segregate Based on IL-6 Response.
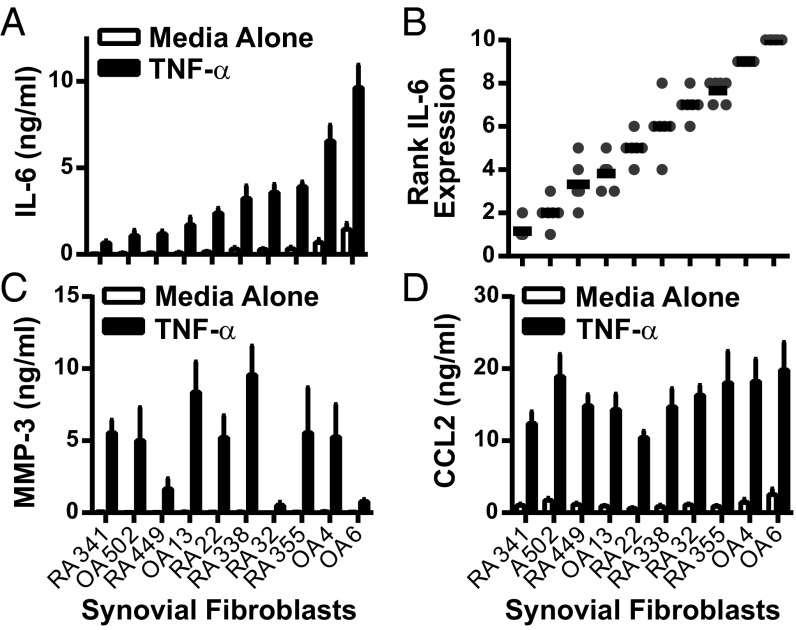
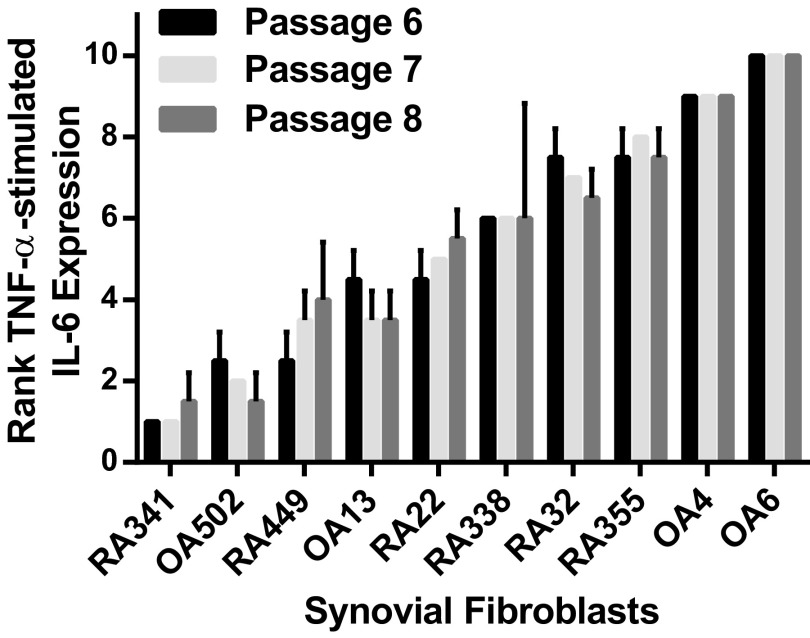
To test heterogeneity in IL-6 expression between synovial fibroblasts, we generated synovial fibroblasts from discard surgical specimens from 10 donors obtained at the time of knee replacement surgery. Fibroblasts from both RA and OA patients were isolated by serial passage, as described (16). These lines were then thawed, cultured, and stimulated by TNF-α in a synchronized fashion to test the range of IL-6 response. After TNF-α stimulation, these lines reproducibly segregated into low, intermediate, and high IL-6 expression, based on mean IL-6 production in six separate experiments (Fig. 1A). For all experiments, each cell line was also ranked for IL-6 expression by using a 10-point scale, from 1 (lowest expression) to 10 (highest expression). IL-6 response expressed as a function of rank revealed a strikingly linear pattern (Fig. 1B), confirming that IL-6 expression levels are tightly regulated. Furthermore, IL-6 response did not segregate based on disease, because lines from both RA and osteoarthritis (OA) donors were found with low and high IL-6 expression. This segregation was stable over time, because the same response pattern was seen with sequential cell passages (Fig. S1), and was different from the expression pattern seen for other important synovial fibroblast products such as matrix metalloproteinase (MMP)-3 (Fig. 1C) or chemokine (C-C motif) ligand 2 (CCL2) (Fig. 1D). Therefore, we decided to further explore this distinct regulation of synovial fibroblast IL-6 production.
Fig. 1.
Synovial fibroblasts segregate based on IL-6 expression levels. Ten RA and OA synovial fibroblast lines were cultured in a synchronized fashion. Equal numbers of each were plated in 96-well plates, serum-starved, and left unstimulated or stimulated overnight with 1 ng/mL TNF-α. (A) Mean IL-6 expression was determined by ELISA for each (n = 6, error bars represent SE of mean). (B) IL-6 expression after TNF-α stimulation was ranked by cell line in each experiment, with 1 = lowest expression and 10 = highest expression (n = 6, each symbol represents one experiment; bars represent mean rank). (C and D) Mean MMP-3 (C) and CCL2 (D) expression was determined by ELISA for each cell line (n = 6, error bars represent SE of mean).
Fig. S1.
IL-6 response pattern is stable over sequential cell passages. Ten synovial fibroblasts were thawed and cultured in a synchronized fashion. At passages 6–8, cells were serum-starved and then stimulated overnight with 1 ng/mL TNF-α. The mean rank of IL-6 expression for each cell line is shown as a function of cell passage (n = 2; error bars represent SD; 1 = lowest expression to 10 = highest expression). Pearson correlation coefficients: passage 7 vs. 6, r = 0.964, P < 0.0001; passage 8 vs. 6, r = 0.964, P < 0.0001; passage 8 vs. 7, r = 0.982, P < 0.0001.
IL-6 Response Pattern Correlates with IL-6 Transcription.
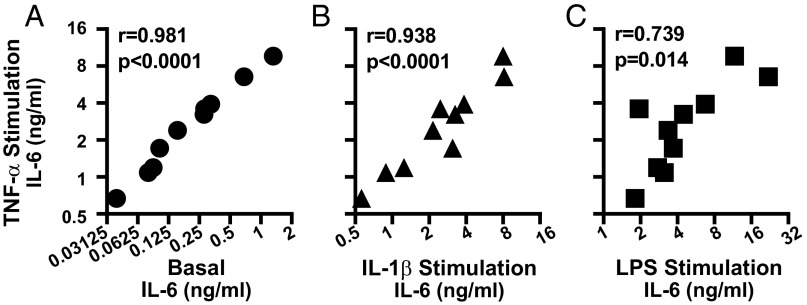
One mechanism that would explain the observed IL-6 expression pattern is TNF-α signaling strength differences between synovial fibroblasts. We, therefore, examined whether the pattern of IL-6 response was unique to TNF-α stimulation or shared by several stimuli. We compared mean IL-6 expression induced by TNF-α for each cell line against the mean IL-6 expression in several conditions: no stimulation (Basal, Fig. 2A), IL-1β stimulation (Fig. 2B), or LPS stimulation (Fig. 2C). To ensure a suitable dynamic range for the inflammatory stimuli, stimulation doses were chosen that gave an ∼10- to 15-fold difference between the highest and lowest responder. We found that the pattern of IL-6 expression after TNF-α stimulation correlated significantly with the expression pattern in unstimulated cell and cells stimulated with IL-1β or LPS, suggesting that the dominant driver of the observed differences between these cell lines is not how IL-6 is induced.
Fig. 2.
IL-6 response pattern between synovial fibroblasts is maintained across different stimulation conditions. Ten serum-starved synovial fibroblasts lines were left unstimulated or stimulated overnight with 1 ng/mL TNF-α, 1 pg/mL IL-1β, or 5 ng/mL LPS. Mean basal (A), IL-1β–stimulated (B), or LPS-stimulated (C) IL-6 expression is correlated with mean TNF-α–stimulated IL-6 levels (n = 6, r = Pearson correlation coefficient).
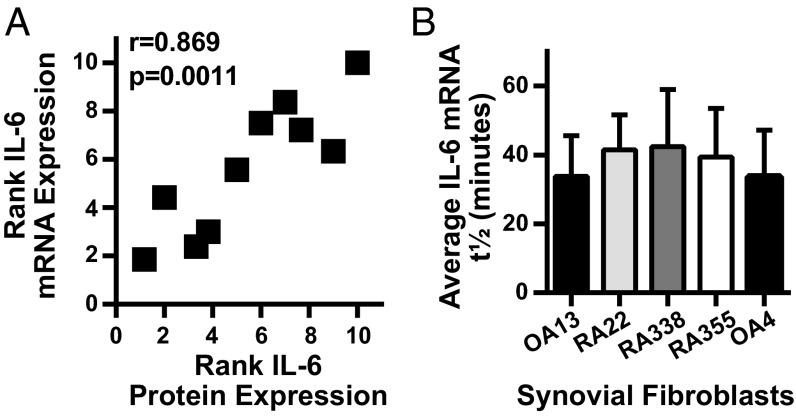
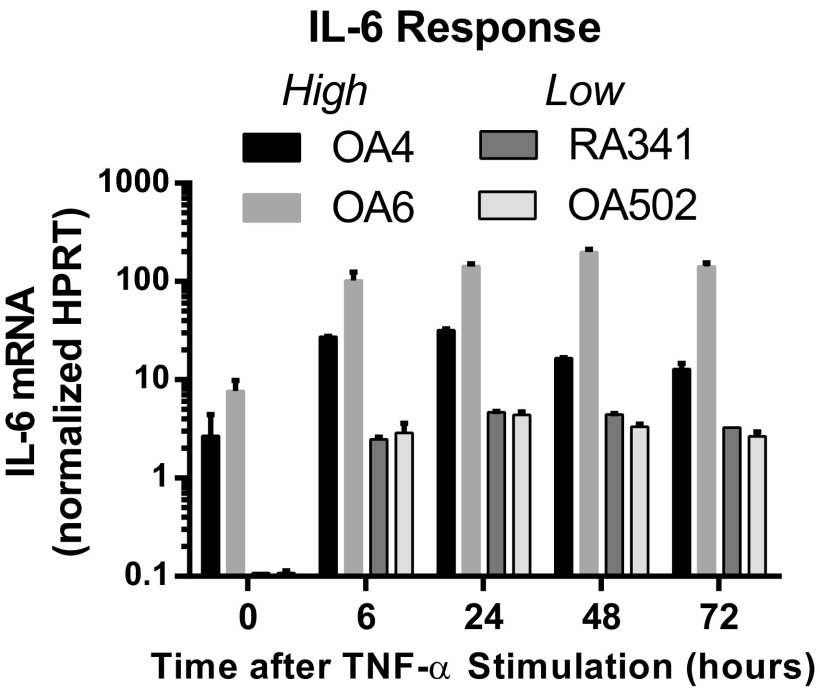
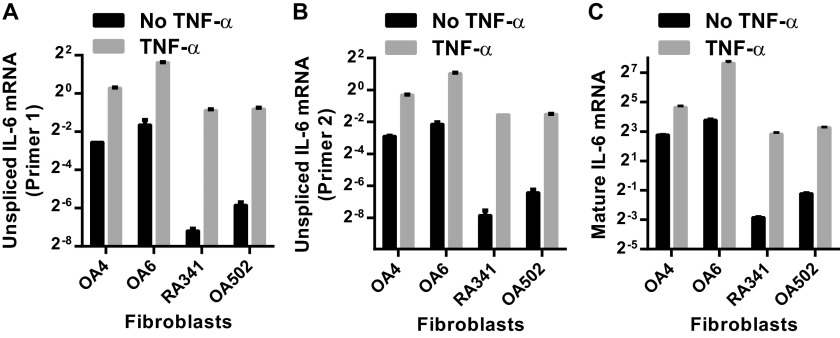
Because the expression pattern differences were not specific to a single stimulus and, indeed, also were observed in unstimulated cells, we compared IL-6 mRNA expression with mRNA stability to distinguish whether the effect was predominantly through transcriptional or posttranscriptional regulation. When IL-6 rank or protein expression for each synovial fibroblast from the preceding experiments (Fig. 1B) was compared with the rank of IL-6 mRNA expression from a distinct set of experiments (Fig. 3A), the two measures of IL-6 expression were highly correlated. IL-6 mRNA expression peaked at 24 and remained stable for 72 h after TNF-α stimulation (Fig. S2), indicating that response differences were not due to altered mRNA kinetics. In contrast, when IL-6 mRNA stability was calculated by measuring IL-6 mRNA decay after actinomycin D transcriptional inhibition, mRNA half-life (t1/2), was markedly similar across a selection of lower- and higher-producing cell lines (Fig. 3B). Furthermore, primary unspliced IL-6 mRNA levels were also increased in high-expressing compared with low-expressing cell lines (Fig. S3). This correlation of protein response with total mRNA levels rather than mRNA stability implicates transcriptional, rather than posttranscriptional, factors in differential IL-6 expression among synovial fibroblasts.
Fig. 3.
IL-6 response pattern correlates with IL-6 mRNA expression levels not mRNA stability. (A) IL-6 mRNA levels from serum-starved synovial fibroblasts stimulated with 1 ng/mL TNF-α overnight were determined by qRT-PCR and normalized by using housekeeping genes HPRT or GAPDH. Each cell line was ranked from low to high based on level of IL-6 expression (n = 2–4). The average rank of IL-6 mRNA expression for each was graphed against the average rank of IL-6 protein expression by ELISA as determined in Fig. 1 (IL-6 mRNA and protein experiments independent from each other, r = Pearson correlation coefficient). (B) After overnight stimulation with TNF-α, the half-life of IL-6 decay was determined after transcriptional inhibition with actinomycin D (n = 2, error bars represent SD of the mean).
Fig. S2.
IL-6 mRNA expression kinetics do not differ between high and low responders. Two high (OA4, OA6) and two low (RA341, OA502) IL-6–expressing synovial fibroblasts were stimulated with 1 ng/mL TNF-α. Expression of IL-6 mRNA, normalized to the housekeeping gene HPRT, was determined 6, 24, 48, and 72 h after stimulation (representative of three experiments).
Fig. S3.
Elevated unspliced mRNA levels in high-producing fibroblasts supports transcriptional regulation of the differential IL-6 response between synovial fibroblasts. Unspliced (A and B) and mature (C) IL-6 mRNA expression for two high IL-6–expressing (OA4, OA6) and two low-expressing (RA341, OA502) was determined by qRT-PCR and normalized to the housekeeping gene HPRT. Unspliced primer 1 (A) amplifies a region of intron 1. Unspliced primer 2 (B) amplifies a region of intron 2. Unspliced mRNA expression averaged 3.5 ± 1.6% of mature mRNA. Primers directed against the IL-6 proximal promoter showed low contamination with genomic DNA, averaging 1.7 ± 2.4% of unspliced mRNA.
Proximal Promoter SNP rs1800795 Is Associated with the Il-6 Response in Primary Human Fibroblasts but Not Monocytes.
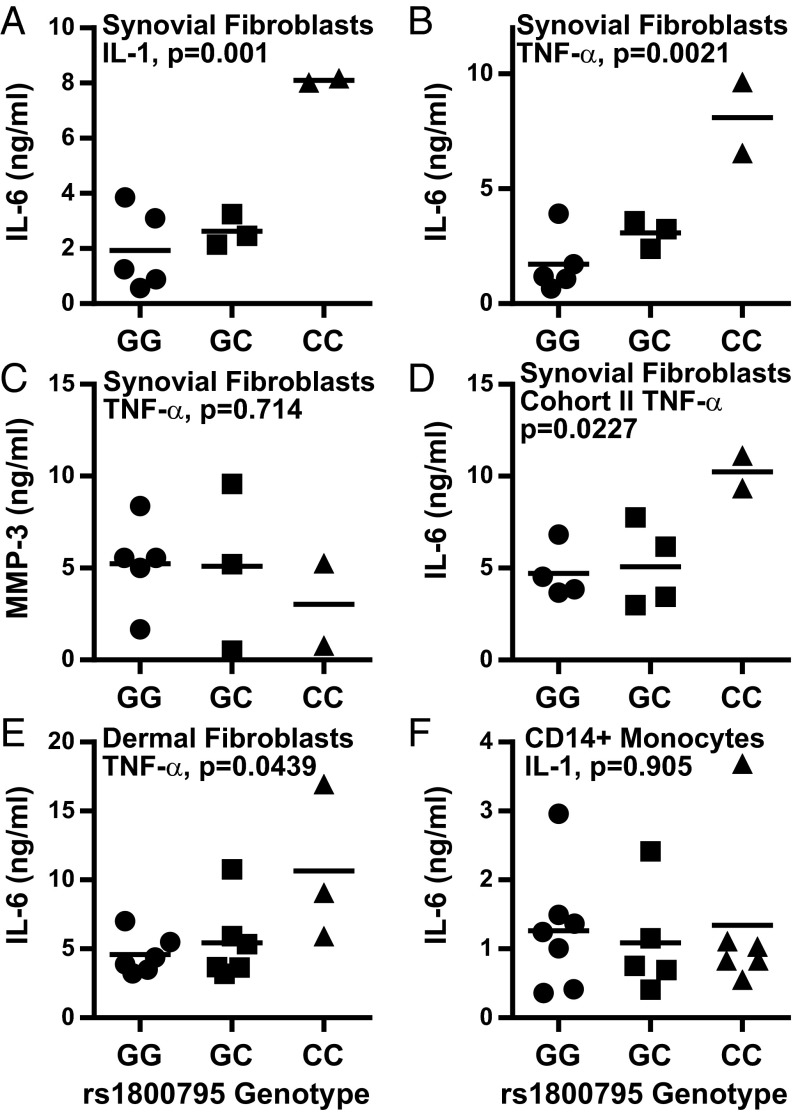
One mechanism that might account for transcriptional differences between synovial fibroblasts is genetic variation between donors. In fact, the IL-6 proximal promoter contains several SNPs. The best studied is rs1800795 (formerly known as -174G/C), which is located in the proximal promoter between the cAMP responsive element binding protein and C/EBP-β binding domains. Although the rs1800795 major G allele was first associated with increased systemic juvenile inflammatory arthritis prevalence and serum IL-6 levels (12), subsequent studies have shown conflicting associations between rs1800795 G/C alleles and IL-6 levels or disease risk across a spectrum of conditions (17–20). Despite its controversial role in IL-6 regulation, we expressed synovial fibroblast IL-6 production as a function of rs1800795 genotype. Strikingly, we found that the highest IL-6 expression was associated with the minor allele (C) homozygous genotype (Fig. 4 A and B). As a control, MMP-3 expression did not correlate with rs1800795 genotype (Fig. 4C). This finding was then confirmed in an independent panel of 10 additional OA synovial fibroblast lines (Fig. 4D). To test whether this effect was unique to synovial fibroblasts or was also seen in other primary human fibroblasts, we generated skin fibroblasts from discarded foreskin tissue. IL-6 expression in skin fibroblasts after TNF-α stimulation was also associated with rs1800795 genotype, with the minor allele homozygotes again showing the highest IL-6 production (Fig. 4E). Finally, we tested whether the association between rs1800795 and IL-6 production was also seen in another cell type that contributes to synovial IL-6 expression. We isolated CD14+ monocytes from 18 donors chosen solely based on their rs1800795 genotype. After IL-1 stimulation, IL-6 production by CD14+ monocytes did not correlate with rs1800795 genotype (Fig. 4F). These results suggest that rs1800795 may be a cell type-specific IL-6 regulator, having profound effects based on the cell expressing IL-6.
Fig. 4.
Increased IL-6 response associates with rs1800795 “CC” genotype in fibroblasts but not in CD14+ monocytes. IL-6 response as a function of rs1800795 genotype was determined for the original synovial fibroblast cohort (A–C), a second synovial fibroblast cohort (D), dermal fibroblasts (E), or CD14+ monocytes (F). Serum-started synovial or dermal fibroblasts were stimulated overnight with 1 pg/mL IL-1β (A) or 1 ng/mL TNF-α (B–E) and assayed for IL-6 (A, B, D, and E) or MMP-3 (C) by ELISA. CD14+ monocytes were isolated by positive selection and then directly stimulated overnight with 1 ng/mL IL-1β (F). Statistical analysis by one-way ANOVA.
IL-6 Promoter Activity Correlates with rs1800795 Genotype in Cell Type-Specific Manner.
To confirm that the DNA sequence containing different rs1800795 alleles directly regulates IL-6 promoter activity, we cloned a 2.1-kb proximal promoter segment from high-expressing rs1800795 “CC” fibroblasts (OA6) and low-expressing rs1800795 “GG” fibroblasts (OA502) into a luciferase expression vector. As expected (21), rs1800795 was in linkage with other known polymorphisms in the IL-6 promoter, specifically SNP rs1800797 (also known as -597G/A) and an AT run between the two SNPs (rs200115396). Surprisingly, we identified a CT deletion ∼1,300 bp upstream from rs1800795 in the “GG” fibroblast sequence. This site corresponds to former variant rs32615820, which was recently deleted from the reference database for mapping errors. We then sequenced 16 donors of defined rs1800795 genotype and found this variation in linkage disequilibrium with rs1800795, with the major “GG” allele associated with the deletion (Table S1). Therefore, the cloned fragment containing the rs1800795 “C” sequence was associated with “rs32615820” CT addition, rs1800797 “A” allele, and an eight A twelve T (A8T12) run [construct pOA6_(+CT)AA8T12C)]. In contrast, the rs1800795 “G” sequence was associated with “rs32615820” CT deletion, rs1800797 “G” allele and an A9T11 run [construct pOA502_(-CT)GA9T11G].
Table S1.
Association of putative upstream SNP rs32615820 with rs1800795 genotype in 16 donors
| rs1800795 genotype | rs32615820’ ACCACCGTCTCT(+/−CT)GTTTAGACAATC | ||
| -CT/-CT | -CT/+CT | +CT/+CT | |
| GG | 7 | 0 | 0 |
| GC | 0 | 3 | 1 |
| CC | 0 | 0 | 5 |
The genotype of putative SNP rs32615820 was determined under contract with Genewiz and associated with the known rs1800795 genotype of these donors.
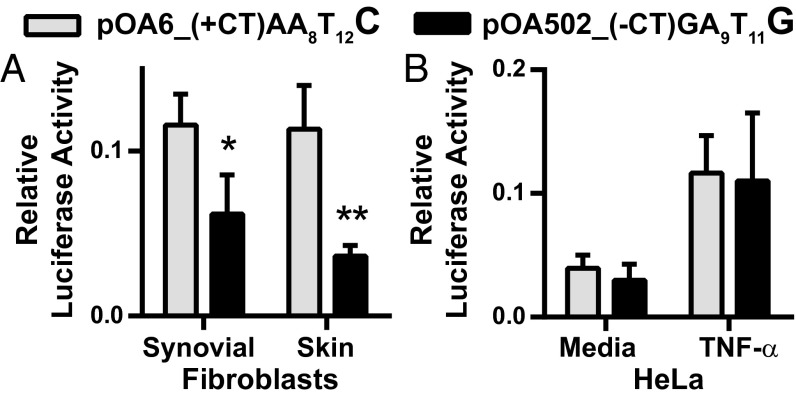
Higher promoter activity was observed with the rs1800795 “C” sequence compared with the “G” when these constructs were transfected into synovial or dermal fibroblasts (Fig. 5A). These results directly confirmed the results seen with IL-6 expression across fibroblasts from different tissues, with highest production seen in fibroblasts homozygous for the CC minor allele. In contrast, no difference in promoter activity was seen when these expression constructs were transfected into HeLa cells, an epithelial cancer line (Fig. 5B). These promoter activity assays point to an important effect for genetic variation in regulating fibroblast IL-6 expression that is not shared by the other tested IL-6-producing cell types.
Fig. 5.
Increased IL-6 promoter activity associates with rs1800795 “CC” genotype in fibroblasts but not in HeLa cells. A 2.1-kb IL-6 proximal promoter region from high (OA6) and low (OA502) IL-6–expressing fibroblasts containing the rs1800795 C and G alleles, respectively, was cloned into the pGL4.10 luciferase vector. Additional polymorphisms in linkage disequilibrium with rs1800795 were also present. High-expressing pOA6_(+CT)AA8T12C haplotype: “rs32615820” +CT, rs1800797 “A,” AT run A8T12, rs1800975 “C.” Low-expressing pOA502_(-CT)GA9T11G haplotype: “rs32615820” -CT, rs1800797 “G,” AT run A9T11, rs1800975 “G.” Luciferase vectors were transfected into fibroblasts (A) or HeLa cells (B). Luciferase activity was measured after overnight incubation in 10% serum-containing media for fibroblasts (A) or with or without an additional 10 ng/mL TNF-α in HeLa cells (B). Relative luciferase activity calculated by dividing luciferase activity by cotransfected, constitutively active Renilla activity (synovial fibroblasts n = 4; dermal fibroblasts n = 3; HeLa n = 4). Statistical analysis by paired t test: *P = 0.0109, **P = 0.0388.
IL-6 Promoter Epigenetic Analysis Shows Distinct Differences Between Human Fibroblasts and Monocytes but Not Between Different Fibroblast Promoter Variants.
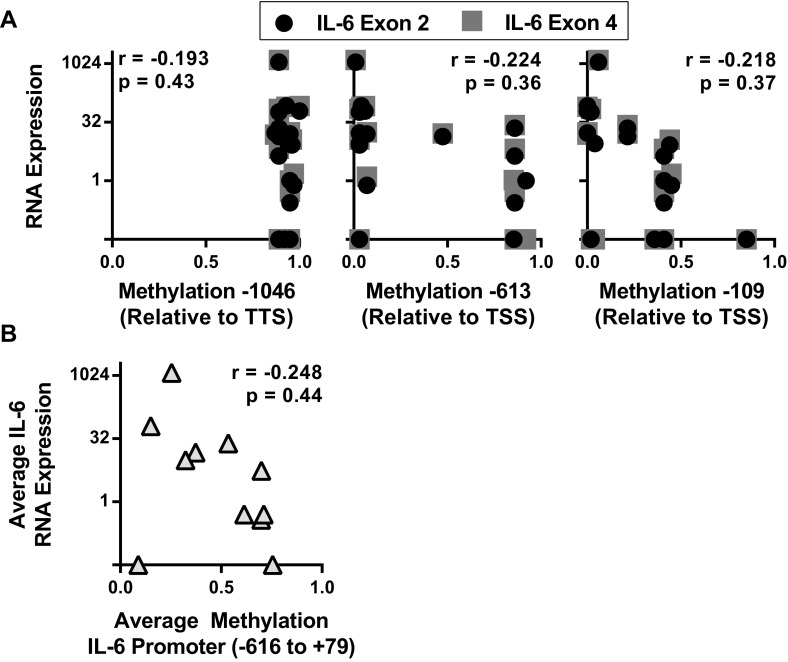
Integrative analysis of the NIH Epigenome Roadmap and Encyclopedia of DNA Elements (ENCODE) databases highlighted that genetic variation frequently leads to allele-specific epigenetic modifications (22). We used these databases to identify possible epigenetic factors involved in fibroblast IL-6 regulation. Previous studies suggested that DNA methylation differences at single CpG sites altered IL-6 expression in RA patient monocytes, although this difference was not associated with rs1800795 genotype (14, 15). Because no data were available for adult fibroblasts or monocytes, we used other cell lines and tissues and confirmed that the IL-6 promoter is largely unmethylated proximally, whereas heavily methylated distally (Fig. S4A). We then compared IL-6 expression by RNA sequencing to methylation levels at individual sites (Fig. S4A) and to the average methylation fraction across the proximal promoter (Fig. S4B). We found poor correlation between expression and methylation, consistent with the recent 111 human epigenome analysis showing that methylation patterns tend to poorly predict gene expression independent from other DNA modifications and binding proteins (22).
Fig. S4.
Weak correlation seen between IL-6 expression and promoter methylation. The WashU Epigenome browser was used to determine the correlation between IL-6 RNA expression and promoter DNA methylation for several cells and tissues by calculating the Pearson correlation coefficient (r). (A) IL-6 expression for each tissue or cell line was determined by using RNA sequencing to calculate the average peak sequencing read number at exon 2 or exon 4. IL-6 expression was then graphed as a function of the average DNA methylation fraction at three CpG sites spanning ∼1,000 bp of the IL-6 promoter (TSS, transcription start site). Methyl C sequencing data available for the following: IMR90 (fetal lung fibroblasts), ovary, spleen, aorta, thymus, H1-derived neuronal progenitor cells, human embryonic stem cells. Methyl CRF (combined methyl DNA immunoprecipitation sequencing and methylation-sensitive restriction enzyme sequencing) data available for the following: fetal brain, foreskin melanocytes, foreskin fibroblasts, foreskin keratinocytes, ganglion eminence-derived neurospheres, cortex-derived neurospheres, breast vHMEC mammary epithelial cells, breast myoepithelial cells, CD4+ naïve T cells, CD4+ memory T cells, CD8+ naïve T cells, H1 embryonic stem cells. (B) Peak RNA sequencing reads at IL-6 exon 2 and 4 was averaged and expressed as a function of the average DNA methylation fraction between base pairs −662 and +79, relative to the TSS, for the methyl-CRF cells and tissues.
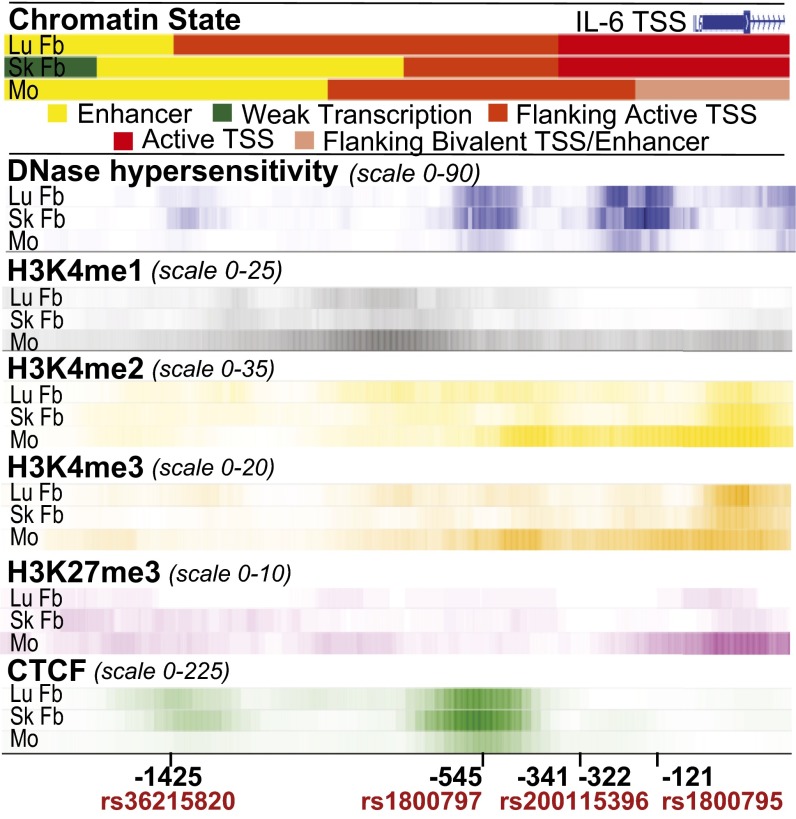
DNase hypersensitivity, histone methylation, and transcription factor binding data for the IL-6 promoter was then compared between adult human lung and skin fibroblasts and CD14+ monocytes to identify fibroblast-specific epigenetic factors that may be influenced by promoter genetic variation. We found striking differences between fibroblasts and monocytes (Fig. 6). Chromatin state algorithms predict fibroblasts are characterized by active IL-6 promoters [flanking active and active transcription start sites (TSS)], whereas monocytes are inactive or poised (flanking bivalent TSS/enhancer). Monocytes had reduced amounts of open chromatin (DNase hypersensitivity) compared with fibroblasts. Monocytes also had histone epigenetic modifications predictive of silenced genes poised to rapidly respond to stimulation, showing increased histone H3 lysine 4 (H3K4) methylations associated with gene transcription and enhancers [H3K4 monomethylation (H3K4me1), H3K4 dimethylation (H3K4me2), and H3K4 trimethylation (H3K4me3)] and increased H3 lysine 27 trimethylation (H3K27me3) associated with gene silencing. In contrast, fibroblast promoters displayed reduced H3K27me3 binding and increased binding of the transcriptional insulator and chromatin modifying transcription factor CCCTC-binding factor (CTCF). Significant H3K9me3, H3K20me1, and H3K79me2 binding was also not detected (fold change over input <3).
Fig. 6.
Analysis of chromatin state, DNase hypersensitivity, histone methylation marks, and CTCF binding reveals differences between human adult fibroblasts and monocytes. The WashU EpiGenome Browser v40.0.0 was used to compare integrated chromatin state categories and fold enrichment for DNase hypersensitivity, histone methylation, and CTCF binding for normal human lung fibroblasts (id 13057, LuFb), adult dermal fibroblast primary cells (id 13055, SkFb), and CD14+ monocytes (id 13068, Mo). IL-6 proximal promoter genetic variation location is indicated relative to the TSS. Increased color intensity reflects greater levels of open chromatin or binding.
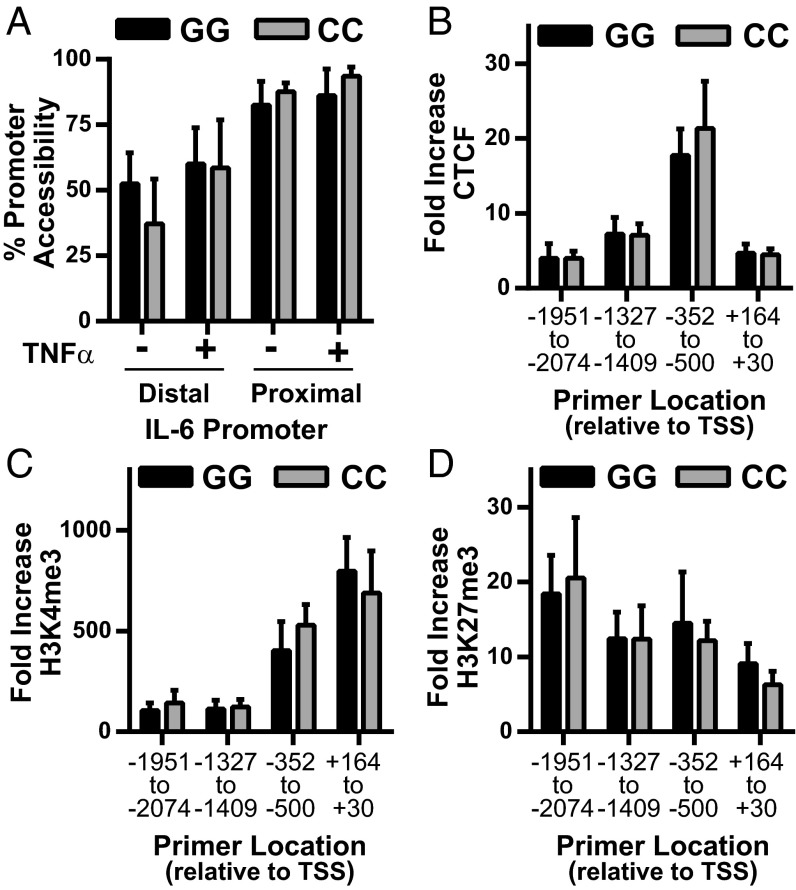
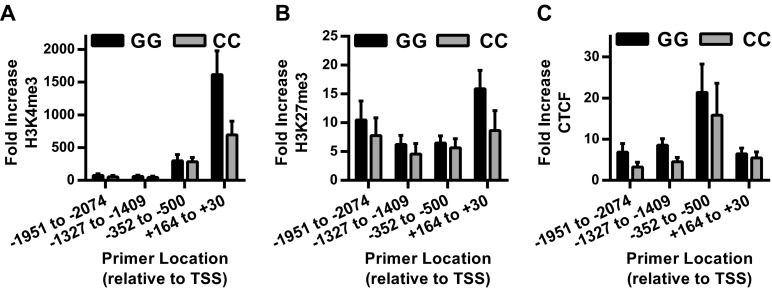
We then tested whether differences in chromatin accessibility, histone methylation, or CTCF binding at the IL-6 promoter were associated with fibroblast rs1800795 genotype. The synovial fibroblast IL-6 promoter was highly accessible, even in the unstimulated state, and was not influenced by rs1800795 genotype (Fig. 7A). Similarly, chromatin immunoprecipitation (ChIP) for H3K4me3, H3K27me3, and CTCF confirmed the binding pattern predicted by epigenetic analysis (Fig. 6), but did not show any changes associated with IL-6 promoter genotype either basally (Fig. S5) or after TNF-α stimulation (Fig. 7 B–D).
Fig. 7.
No association between rs1800795 genotype and IL-6 promoter chromatin accessibility or H3K4me3, H3K27me3, or CTCF binding in human fibroblasts. (A) Open chromatin, expressed as percent promoter accessibility relative to constitutively silenced gene (hemoglobin), was assessed in the proximal and distal IL-6 promoter by DNA digestion in synovial fibroblasts treated overnight without or with 1 ng/mL TNF-α [average two experiments, GG (n = 3 cell lines), CC (n = 2 cell lines), error bars represent SD]. (B–D) Average fold binding increase over isotype after ChIP for CTCF (B), HeK4me3 (C), and HeK27me3 (D) was determined after 4 h TNF-α stimulation by qPCR using primers scanning the IL-6 promoter [pooled data skin and synovial fibroblasts, GG (n = 7), CC (n = 6), error bars represent SEM].
Fig. S5.
No association between rs1800795 genotype and basal IL-6 promoter chromatin H3K4me3, H3K27me3, or CTCF binding in human fibroblasts. (A–C) Average fold binding increase over isotype after ChIP for HeK4me3 (A), HeK27me3 (B), and CTCF (C) was determined in unstimulated cells by qPCR using primers scanning the IL-6 promoter [pooled data skin and synovial fibroblasts, GG (n = 7), CC (n = 6), error bars represent SEM, P > 0.5 for all GG v. CC comparisons by multiple t test].
Discussion
Genetic association studies have provided tremendous insight into the diversity of genetic factors contributing to the risk of acquiring a complex genetic disease. They also highlight current limits to our understanding about how genetic variation causes disease. Taking RA as an example, there are now 101 identified genetic loci associated with RA. Strikingly, these currently identified loci account for less than half the genetic risk, with the HLA shared epitope accounting for 12% and the non-HLA loci accounting for an additional 5% of the total variance (23). The missing heritability is thought to arise from several factors, including epigenetic changes, gene–environment interactions, rare genetic variants, and common variants with effect sizes below current detection limits (24). In addition, with a few exceptions, how these loci contribute to disease is not understood. In this study, we show that common promoter polymorphisms strikingly regulate IL-6 expression fibroblasts, but not other cells, pointing to cell type-specific effects as an additional level of complexity.
IL-6 is a pathogenic cytokine in rheumatoid arthritis and other diseases, as proven by the efficacy of IL-6 blockade as a treatment agent. Several genetic polymorphisms near the IL-6 gene have been extensively studied as obvious targets for disease risk. However, despite numerous studies, how these variants affect IL-6 expression or disease is not clear. In RA, no IL-6 locus SNPs are associated with disease risk in genome-wide association studies (24, 25). However, smaller studies show associations between IL-6 promoter SNPs and different disease aspects, including cardiovascular risk (26, 27), progression to joint deformities (28), and treatment responses (29–31). Adding to the confusion, the reported associations do not clearly track with one polymorphic allele. For rs1800795, sometimes the major allele associates with increased serum IL-6 levels (12), endothelial dysfunction (26), or joint erosions (28). At other times, the minor allele associates with poor treatment responses (29–31) or increased IL-6 levels and cardiovascular risk (27).
Given these divergent reports, we were surprised to identify a reproducible association between the IL-6 proximal promoter SNP rs1800795 CC genotype and high-fibroblast IL-6 production. The absence of association between this SNP and IL-6 expression in monocytes was equally striking. Luciferase expression driven by cloned IL-6 proximal promoters confirmed the role of genetic variation in this effect, with the haplotype containing the minor allele (C) having higher transcriptional activity than the corresponding major allele (G) haplotype in synovial and skin fibroblasts (Fig. 5). In contrast, no difference in transcriptional activity by haplotype was seen in HeLa cells. This lack of effect in HeLa cells confirms one prior study (21), but stands in contrast to another report that showed the rs1800795 major allele (G) drove higher transcriptional activity (12). These differences may be due to varying promoter DNA lengths cloned into expression vectors, with the study that showed a difference using a significantly shorter promoter sequence.
Similar to our observations, others have reported lack of association with rs1880795 in the ECV304 (21), human endothelial (32), and peripheral blood mononuclear cells (33) basally or after stimulation with proinflammatory cytokines. An additional study reported that IL-6 expression in macrophages and B cells did not vary with rs1800795 in unstimulated cells, but did show higher transcriptional activity after norepinephrine stimulation from DNA constructs containing the major allele (G) (17). Taken together, these data indicate that genetic variation at the IL-6 locus has profoundly different effects depending on cell type and stimulation, with the rs1800795 SNP having a prominent effect on fibroblast IL-6 regulation.
In fibroblasts, no or modest differences in IL-6 expression are seen between rs1800795 major allele (G) homozygotes or heterozygotes. Rather, increased IL-6 expression correlates most strongly with a minor allele homozygote genotype. In addition, rs1800795 is in tight linkage disequilibrium with other genetic variation in the IL-6 proximal promoter, and our data adds an additional possible genetic variant, a CT addition/depletion 1,541 bp upstream from the TSS (Fig. 5 and Table S1). It is not clear which genetic variation is critical for IL-6 regulation. However, given that different effects of transcriptional activity were seen in HeLa cells using different length promoter constructs (our study and refs. 12 and 21), a cooperative effect between multiple loci should be considered.
Our epigenetic analysis using the NIH Roadmap and ENCODE databases showed striking differences between fibroblasts and monocytes at the IL-6 promoter. Fibroblast IL-6 promoters showed open chromatin, even in an unstimulated state, with histone methylation patterns consistent with gene activation (Fig. 6). Macrophages, in contrast, had less open chromatin with methylation patterns consistent with a poised, ready-to-respond state. This pattern supports prior work showing tight control of IL-6 production in macrophages but sustained production in synovial fibroblasts (34). Interestingly, although CpG DNA methylation is associated with low gene expression, our analysis showed poor correlation between IL-6 expression and promoter CpG methylation (Fig. S4), supporting a recent genome-wide integrative analysis that showed CpG methylation poorly predicts gene expression without additional epigenetic context (22).
We do not understand how IL-6 promoter genetic variation drives fibroblast IL-6 expression. We speculate that histone acetylation or transcription factor binding may be regulated in an allele-specific fashion. A Japanese study showed synovial fibroblast segregation based on IL-6 expression and promoter nuclear factor kappa-light-chain enhancer of activated B cells (NF-κB) binding (35). However, because the Japanese population has low rs1800795 minor allele frequency, it is unlikely to be associated with IL-6 expression in this population. Our study showed allele-specific differences in IL-6 production regardless of disease state (OA versus RA) or tissue (synovium versus skin), pointing to a more general regulation mechanism. The above study also reported that IL-6 expression is lower in OA compared with RA fibroblasts. Differences between OA and RA fibroblasts are more likely seen in freshly isolated or early passage fibroblasts, pointing to additional complexity in the synovial regulation of IL-6.
This study highlights the complexity in determining how genetic variation affects protein expression contributing to disease development. We show that genetic differences in the proximal promoter changed IL-6 production in fibroblasts but not monocytes. This result has important implications for the interpretation of genetic association studies. For proteins such as IL-6 produced by many different cell types, determining whether a genetic polymorphism correlates with overall disease risk or modifies particular disease aspects (e.g., treatment response or cardiovascular risk) likely depends on how that polymorphism affects protein expression in the cells responsible for that phenotype. Clearly, a one-size-fits-all approach to evaluating biologic effects of genetic variation will likely miss important details of gene regulation. Understanding how a given genetic locus alters disease must consider not only the pathways that a locus sits in, but also how those pathways are expressed in different cells and tissues.
Methods
All primers sequences and additional experimental details are described in SI Methods.
Ethics Statement.
All human sample research was approved by the Brigham and Women’s Hospital Institutional Review Board, and informed consent was obtained from each blood donor volunteer as part of the Brigham and Women’s Hospital Phenogenetics Project.
Cells, Media, and Culture Conditions.
Human synovial fibroblasts were isolated and cultured as described from discarded surgical specimens (16). Human skin fibroblasts were isolated from discarded human foreskin specimens by dermal fragment digestion after epithelial removal by dispase and serially passaged. Human CD14+ monocytes were isolated by CD14+ magnetic bead positive selection (Miltenyi Biotec) from thawed peripheral blood mononuclear cells obtained from Brigham and Women’s Hospital Phenogenetics. Project donors were selected by SNP rs1800795 genotype.
Cell Stimulation Assays.
Human skin and synovial fibroblasts were serum-starved overnight in 1% FBS-containing media before stimulation as indicated. Freshly isolated CD14+ monocytes were plated in RPMI 1640 media containing FBS (2% total volume), l-glutamine, and Hepes without or with indicated stimuli. Reagents include the following: Human TNF-α, IL-1β, and ELISA kits for IL-6, CCL2, and MMP-3 (R&D Systems); Samonella LPS (Sigma-Aldrich).
RNA Studies.
RNA was isolated by using manufacturer’s instructions (RNeasy Micro kit; Qiagen) and analyzed by quantitative reverse-transcription PCR (qRT-PCR; QuantiTect Reverse Transcription kit, Qiagen; Brilliant III Ultra-Fast SYBR Green, Agilent). Synovial fibroblast mRNA stability was measured after overnight stimulation with 1 ng/mL TNF-α followed by transcriptional inhibition with actinomycin D (5 µg/mL). RNA isolated 0, 60, 90, and 240 min after actinomycin D addition was analyzed by qRT-PCR. RNA half-life (t1/2) was calculated by using a nonlinear fit of the exponential decay (GraphPad Prism).
Restriction Fragment Length Polymorphism Genotyping.
A 308-bp PCR product containing rs1800795 was amplified from isolated genomic DNA (DNeasy Blood and Tissue Kit; Qiagen) and digested with NlaIII. Agarose gel cleavage fragments based on rs1800795 allele: G: 236 bp, 72 bp; C: 125 bp, 111 bp, 72 bp.
Luciferase Assay.
A 2.1-kb IL-6 promoter sequence was PCR amplified as described (36) from IL-6 high-expressing (OA6) and low-expressing (OA502) fibroblasts and ligated into the luciferase vector pGL4.10[luc2] (Promega) after digestion with XhoI and SacI. IL-6 promoter plasmids were cotransfected overnight with a control CMV promoter-driven Renilla luciferase (ratio 19:1) by using Lipofectamine 3000 (Life Technologies) following manufacturer’s directions and then incubated in 10% FBS containing media with or without TNF-α as indicated. Luciferase assays were performed by using the Dual-Glo Luciferase Assay system (Promega).
Epigenetic Assays.
The WashU Epigenome Browser was used to analyze epigenetic factors and transcription factor binding in the IL-6 proximal promoter. DNase hypersensitivity was measured by using the EpiQ Chromatin Analysis Kit (Bio-Rad). ChIP was performed by using anti-CTCF, anti-H3K4me3, or anti-H3K27me3 or appropriate isotype controls antibodies (Millipore) on DNA isolated from formaldehyde fixed cells that were lysed and sonicated. Promoter binding was assayed by qPCR.
SI Methods
Primers.
Mature IL-6: CCACTCACCTCTTCAGAACG, CATCTTTGGAAGGTTCAGGTTG; glyceraldehyde 3-phosphate dehydrogenase (GAPDH): ACATCGCTCAGACACCATG, TGTAGTTGAGGTCAATGAAGGG); hyptoxantine-guanine phosphoribosyltransferase (HPRT): GGGCTATAAATTCTTTGCTGAC, CTGGTCATTACAATAGCTCTTCAG); Unspliced IL-6 #1: CCGACTAGACTGACTTCTGTATTT, CAAAGGTGGGCATGGATTTC. Unspliced IL-6 #2: AGATCCAGGCAGCAACAAA, GGCCATACCTGTCCAAGAATAA.
Restriction fragment length polymorphism (RFLP) rs 1800795 Genotyping: ATGCCAAAGTGCTGAGTCACTA, GAGGCTCATTCTGCCCTCGA.
IL-6 Promoter Cloning Sequencing Primers: CTAGCAAAATAGGCTGTCCC, GCATGCCCTGATGTCCTATT, GAAGCAGATTCAGAGCCTAGAG, and GAGAGCCAGAACACAGAAGAA.
IL-6 DNase Hypersensitivity Primers: Proximal: CCACCCTCACCCTCCAACAAAGATTTA, CCTGCACTTACTTGTGGAGAAGGAGTT; Distal: GCTGGGAGCAGTGGCTTCGTTTCAT, GTGCATAACATTTCAGGACCCGCCTGT.
IL-6 ChIP Primers: +164 to +30: AGGACTGGAGATGTCTGAGGCTCATTCT, GTTCCAGGGCTAAGGATTTCC TGCACTT; −352 to −500: CACAGAAGAACTCAGAT IL-6 ChIP Primers: +164 to +30GACTGGTAGTA, ATTAACAGGCTAGAATTTAGCGTTCCA; −1327 to −1409: GAAGAATGGAT-GACCTCACT, CTGTTGGGCATTTACTCAAG; −1951 to −2074: AGCATGTATTGTGGGATTAC, GCCCTTGTTTATTCACCTAT.
Cells, Media, and Culture Conditions.
Synovial fibroblasts isolated from discard surgical specimens were used experimentally between passages 5 and 8. They were maintained in DMEM media containing FBS (10% total volume), 2 mM l-glutamine, 50 µM 2-mercaptoethanol (2-ME), antibiotics, and essential and nonessential amino acids (Life Technologies). Normal human skin fibroblasts were obtained from discarded human foreskin specimens that were first digested overnight at 4 °C to remove the epithelium with a 10 mg/mL dispase II solution (Sigma-Aldrich) mixed 1:1 in RPMI medium 1640 containing 1% BSA, 100 units/mL penicillin, 100 µg/mL streptomycin, 100 µg/mL gentamicin, and 0.25 µg/mL fungizone (Life Technologies). Fibroblasts were then isolated from the remaining dermal fragments by digestion at 37 °C in DMEM containing 2 mg/mL type IV collagenase (Worthington Biochemicals), 0.8 mg/mL dispase (Roche Applied Science), and 0.1 mg/mL DNase I (Roche) and sequentially passaged in DMEM/F12 media containing FBS (10% total volume), N-2-hydroxyethylpiperazine-N-2-ethane sulfonic acid (Hepes), l-glutamine, and antibiotics. Peripheral blood mononuclear cells were isolated by Ficoll gradient from freshly drawn blood samples collected from donors selected for SNP rs1800795 genotype through the Phenogenetics Project at Brigham and Women’s Hospital and then frozen. On the day of assay, CD14+ cells were positively selected from thawed PBMCs by using CD14 magnetic microbeads (Miltenyi Biotec).
ChIP.
Serum-starved fibroblasts were treated with or without TNF (1 ng/mL) for 4 h followed by fixation in 1% formaldehyde for 10 min. Cells were lysed in swelling buffer for 15 min (25 mM Hepes pH 7.8, 1.5 mM MgCl2, 10 mM KCl, 0.1% Nonidet P-40, 1 mM DTT, protease inhibitor mixtures then in sonication buffer (50 mM Hepes pH 7.8, 140 mM NaCl, 1 mM EDTA, 0.1% SDS, 1% Triton X-100 supplemented with protease inhibitors mixtures). Samples were sonicated for 3 min with 20-s pulse intervals and 1 min off at each interval at 4 °C by using a Qsonica sonicator. Chromatin was immunoprecipitated by using anti-CTCF, H3K4me3, or H3K27me antibodies or appropriate isotype controls. Cross-linking was reversed and DNA purified by using phenol/chloroform precipitation. Real-time PCR was used to quantify promoter’s binding.
Acknowledgments
Support for E.H.N. was provided by the Rheumatology Research Foundation (RRF) New Investigator Award and NIH Grant K08 AR063696. Support for M.B.B. was provided by the RRF Disease Targeted Research Grant and NIH Grant 5 R01 AR048114.
Footnotes
The authors declare no conflict of interest.
This article contains supporting information online at www.pnas.org/lookup/suppl/doi:10.1073/pnas.1520861112/-/DCSupplemental.
References
- 1.Noss EH, Brenner MB. The role and therapeutic implications of fibroblast-like synoviocytes in inflammation and cartilage erosion in rheumatoid arthritis. Immunol Rev. 2008;223:252–270. doi: 10.1111/j.1600-065X.2008.00648.x. [DOI] [PubMed] [Google Scholar]
- 2.Müller-Ladner U, et al. Synovial fibroblasts of patients with rheumatoid arthritis attach to and invade normal human cartilage when engrafted into SCID mice. Am J Pathol. 1996;149(5):1607–1615. [PMC free article] [PubMed] [Google Scholar]
- 3.Lee DM, et al. Cadherin-11 in synovial lining formation and pathology in arthritis. Science. 2007;315(5814):1006–1010. doi: 10.1126/science.1137306. [DOI] [PubMed] [Google Scholar]
- 4.Bottini N, Firestein GS. Duality of fibroblast-like synoviocytes in RA: Passive responders and imprinted aggressors. Nat Rev Rheumatol. 2013;9(1):24–33. doi: 10.1038/nrrheum.2012.190. [DOI] [PMC free article] [PubMed] [Google Scholar]
- 5.Firestein GS, Alvaro-Gracia JM, Maki R. Quantitative analysis of cytokine gene expression in rheumatoid arthritis. J Immunol. 1990;144(9):3347–3353, and correction (1990) 145(3)1037. [PubMed] [Google Scholar]
- 6.Calabrese LH, Rose-John S. IL-6 biology: Implications for clinical targeting in rheumatic disease. Nat Rev Rheumatol. 2014;10(12):720–727. doi: 10.1038/nrrheum.2014.127. [DOI] [PubMed] [Google Scholar]
- 7.Georganas C, et al. Regulation of IL-6 and IL-8 expression in rheumatoid arthritis synovial fibroblasts: The dominant role for NF-kappa B but not C/EBP beta or c-Jun. J Immunol. 2000;165(12):7199–7206. doi: 10.4049/jimmunol.165.12.7199. [DOI] [PubMed] [Google Scholar]
- 8.Matsusaka T, et al. Transcription factors NF-IL6 and NF-kappa B synergistically activate transcription of the inflammatory cytokines, interleukin 6 and interleukin 8. Proc Natl Acad Sci USA. 1993;90(21):10193–10197. doi: 10.1073/pnas.90.21.10193. [DOI] [PMC free article] [PubMed] [Google Scholar]
- 9.Vanden Berghe W, et al. Signal transduction by tumor necrosis factor and gene regulation of the inflammatory cytokine interleukin-6. Biochem Pharmacol. 2000;60(8):1185–1195. doi: 10.1016/s0006-2952(00)00412-3. [DOI] [PubMed] [Google Scholar]
- 10.Neininger A, et al. MK2 targets AU-rich elements and regulates biosynthesis of tumor necrosis factor and interleukin-6 independently at different post-transcriptional levels. J Biol Chem. 2002;277(5):3065–3068. doi: 10.1074/jbc.C100685200. [DOI] [PubMed] [Google Scholar]
- 11.Paschoud S, et al. Destabilization of interleukin-6 mRNA requires a putative RNA stem-loop structure, an AU-rich element, and the RNA-binding protein AUF1. Mol Cell Biol. 2006;26(22):8228–8241. doi: 10.1128/MCB.01155-06. [DOI] [PMC free article] [PubMed] [Google Scholar]
- 12.Fishman D, et al. The effect of novel polymorphisms in the interleukin-6 (IL-6) gene on IL-6 transcription and plasma IL-6 levels, and an association with systemic-onset juvenile chronic arthritis. J Clin Invest. 1998;102(7):1369–1376. doi: 10.1172/JCI2629. [DOI] [PMC free article] [PubMed] [Google Scholar]
- 13.Iliopoulos D, Hirsch HA, Struhl K. An epigenetic switch involving NF-kappaB, Lin28, Let-7 MicroRNA, and IL6 links inflammation to cell transformation. Cell. 2009;139(4):693–706. doi: 10.1016/j.cell.2009.10.014. [DOI] [PMC free article] [PubMed] [Google Scholar]
- 14.Ishida K, et al. Interleukin-6 gene promoter methylation in rheumatoid arthritis and chronic periodontitis. J Periodontol. 2012;83(7):917–925. doi: 10.1902/jop.2011.110356. [DOI] [PubMed] [Google Scholar]
- 15.Nile CJ, Read RC, Akil M, Duff GW, Wilson AG. Methylation status of a single CpG site in the IL6 promoter is related to IL6 messenger RNA levels and rheumatoid arthritis. Arthritis Rheum. 2008;58(9):2686–2693. doi: 10.1002/art.23758. [DOI] [PubMed] [Google Scholar]
- 16.Kiener HP, Lee DM, Agarwal SK, Brenner MB. Cadherin-11 induces rheumatoid arthritis fibroblast-like synoviocytes to form lining layers in vitro. Am J Pathol. 2006;168(5):1486–1499. doi: 10.2353/ajpath.2006.050999. [DOI] [PMC free article] [PubMed] [Google Scholar]
- 17.Cole SW, et al. Computational identification of gene-social environment interaction at the human IL6 locus. Proc Natl Acad Sci USA. 2010;107(12):5681–5686. doi: 10.1073/pnas.0911515107. [DOI] [PMC free article] [PubMed] [Google Scholar]
- 18.Giannitrapani L, Soresi M, Balasus D, Licata A, Montalto G. Genetic association of interleukin-6 polymorphism (-174 G/C) with chronic liver diseases and hepatocellular carcinoma. World J Gastroenterol. 2013;19(16):2449–2455. doi: 10.3748/wjg.v19.i16.2449. [DOI] [PMC free article] [PubMed] [Google Scholar]
- 19.Smith AJ, Humphries SE. Cytokine and cytokine receptor gene polymorphisms and their functionality. Cytokine Growth Factor Rev. 2009;20(1):43–59. doi: 10.1016/j.cytogfr.2008.11.006. [DOI] [PubMed] [Google Scholar]
- 20.Yin YW, et al. The lack of association between interleukin-6 gene -174 G/C polymorphism and the risk of type 1 diabetes mellitus: A meta-analysis of 18,152 subjects. Gene. 2013;515(2):461–465. doi: 10.1016/j.gene.2012.11.062. [DOI] [PubMed] [Google Scholar]
- 21.Terry CF, Loukaci V, Green FR. Cooperative influence of genetic polymorphisms on interleukin 6 transcriptional regulation. J Biol Chem. 2000;275(24):18138–18144. doi: 10.1074/jbc.M000379200. [DOI] [PubMed] [Google Scholar]
- 22.Kundaje A, et al. Roadmap Epigenomics Consortium Integrative analysis of 111 reference human epigenomes. Nature. 2015;518(7539):317–330. doi: 10.1038/nature14248. [DOI] [PMC free article] [PubMed] [Google Scholar]
- 23.Sparks JA, Costenbader KH. Genetics, environment, and gene-environment interactions in the development of systemic rheumatic diseases. Rheum Dis Clin North Am. 2014;40(4):637–657. doi: 10.1016/j.rdc.2014.07.005. [DOI] [PMC free article] [PubMed] [Google Scholar]
- 24.Yarwood A, Huizinga TW, Worthington J. The genetics of rheumatoid arthritis: Risk and protection in different stages of the evolution of RA. Rheumatology (Oxford) 2014:keu323. doi: 10.1093/rheumatology/keu323. [DOI] [PMC free article] [PubMed] [Google Scholar]
- 25.Okada Y, et al. RACI consortium; GARNET consortium Genetics of rheumatoid arthritis contributes to biology and drug discovery. Nature. 2014;506(7488):376–381. doi: 10.1038/nature12873. [DOI] [PMC free article] [PubMed] [Google Scholar]
- 26.Palomino-Morales R, et al. Interleukin-6 gene -174 promoter polymorphism is associated with endothelial dysfunction but not with disease susceptibility in patients with rheumatoid arthritis. Clin Exp Rheumatol. 2009;27(6):964–970. [PubMed] [Google Scholar]
- 27.Panoulas VF, et al. Association of interleukin-6 (IL-6)-174G/C gene polymorphism with cardiovascular disease in patients with rheumatoid arthritis: The role of obesity and smoking. Atherosclerosis. 2009;204(1):178–183. doi: 10.1016/j.atherosclerosis.2008.08.036. [DOI] [PubMed] [Google Scholar]
- 28.Marinou I, et al. Association of interleukin-6 and interleukin-10 genotypes with radiographic damage in rheumatoid arthritis is dependent on autoantibody status. Arthritis Rheum. 2007;56(8):2549–2556. doi: 10.1002/art.22814. [DOI] [PMC free article] [PubMed] [Google Scholar]
- 29.Dávila-Fajardo CL, et al. Confirmation of -174G/C interleukin-6 gene promoter polymorphism as a genetic marker predicting antitumor necrosis factor treatment outcome. Pharmacogenet Genomics. 2014;24(1):1–5. doi: 10.1097/FPC.0000000000000013. [DOI] [PubMed] [Google Scholar]
- 30.Fabris M, et al. The CC homozygosis of the -174G>C IL-6 polymorphism predicts a lower efficacy of rituximab therapy in rheumatoid arthritis. Autoimmun Rev. 2012;11(5):315–320. doi: 10.1016/j.autrev.2010.06.012. [DOI] [PubMed] [Google Scholar]
- 31.Jančić I, et al. -174G/C interleukin-6 gene promoter polymorphism predicts therapeutic response to etanercept in rheumatoid arthritis. Rheumatol Int. 2013;33(6):1481–1486. doi: 10.1007/s00296-012-2586-y. [DOI] [PubMed] [Google Scholar]
- 32.Kiszel P, Makó V, Prohászka Z, Cervenak L. Interleukin-6 -174 promoter polymorphism does not influence IL-6 production after LPS and IL-1 beta stimulation in human umbilical cord vein endothelial cells. Cytokine. 2007;40(1):17–22. doi: 10.1016/j.cyto.2007.08.001. [DOI] [PubMed] [Google Scholar]
- 33.de Almeida ER, Petzl-Erler ML. Expression of genes involved in susceptibility to multifactorial autoimmune diseases: Estimating genotype effects. Int J Immunogenet. 2013;40(3):178–185. doi: 10.1111/j.1744-313X.2012.01152.x. [DOI] [PubMed] [Google Scholar]
- 34.Lee A, et al. Tumor necrosis factor α induces sustained signaling and a prolonged and unremitting inflammatory response in rheumatoid arthritis synovial fibroblasts. Arthritis Rheum. 2013;65(4):928–938. doi: 10.1002/art.37853. [DOI] [PMC free article] [PubMed] [Google Scholar]
- 35.Igarashi H, et al. A pro-inflammatory role for A20 and ABIN family proteins in human fibroblast-like synoviocytes in rheumatoid arthritis. Immunol Lett. 2012;141(2):246–253. doi: 10.1016/j.imlet.2011.10.011. [DOI] [PubMed] [Google Scholar]
- 36.Xiao W, et al. Co-operative functions between nuclear factors NFkappaB and CCAT/enhancer-binding protein-beta (C/EBP-beta) regulate the IL-6 promoter in autocrine human prostate cancer cells. Prostate. 2004;61(4):354–370. doi: 10.1002/pros.20113. [DOI] [PubMed] [Google Scholar]


