

Significance
Cyanobacteria are model organisms for photosynthesis in the laboratory, are key producers of the chemical energy that drives life, and are being developed as biofuel and chemical producers for industry. Despite the importance of these organisms for environmental and biotechnological applications, only a small percentage of cyanobacterial genes and intergenic regions have been experimentally evaluated for their impact on the organisms’ survival. Here, we present experimental analysis of the complete set of genomic regions necessary for survival in a cyanobacterium achieved by screening for the fitness of hundreds of thousands of mutants. In addition to improving our fundamental understanding of Cyanobacteria, this research more broadly provides a snapshot of the essential genes and intergenic regions necessary to live the photosynthetic lifestyle.
Keywords: RB-TnSeq, transposon mutagenesis, Tn-seq, cyanobacteria, photosynthesis
Abstract
Synechococcus elongatus PCC 7942 is a model organism used for studying photosynthesis and the circadian clock, and it is being developed for the production of fuel, industrial chemicals, and pharmaceuticals. To identify a comprehensive set of genes and intergenic regions that impacts fitness in S. elongatus, we created a pooled library of ∼250,000 transposon mutants and used sequencing to identify the insertion locations. By analyzing the distribution and survival of these mutants, we identified 718 of the organism’s 2,723 genes as essential for survival under laboratory conditions. The validity of the essential gene set is supported by its tight overlap with well-conserved genes and its enrichment for core biological processes. The differences noted between our dataset and these predictors of essentiality, however, have led to surprising biological insights. One such finding is that genes in a large portion of the TCA cycle are dispensable, suggesting that S. elongatus does not require a cyclic TCA process. Furthermore, the density of the transposon mutant library enabled individual and global statements about the essentiality of noncoding RNAs, regulatory elements, and other intergenic regions. In this way, a group I intron located in tRNALeu, which has been used extensively for phylogenetic studies, was shown here to be essential for the survival of S. elongatus. Our survey of essentiality for every locus in the S. elongatus genome serves as a powerful resource for understanding the organism’s physiology and defines the essential gene set required for the growth of a photosynthetic organism.
Determining the sets of genes necessary for survival of diverse organisms has helped to identify the fundamental processes that sustain life across an array of environments (1). This research has also served as the starting point for efforts by synthetic biologists to design organisms from scratch (2, 3). Despite the importance of essential gene sets, they have traditionally been challenging to gather because of the difficulty of observing mutations that result in lethal phenotypes. More recently, the pairing of transposon mutagenesis with next generation sequencing, referred to collectively as transposon sequencing (Tn-seq), has resulted in a dramatic advance in the identification of essential gene sets (4–7). The key characteristic of Tn-seq is the use of high-throughput sequencing to screen for the fitness of every transposon mutant in a pooled population to measure each mutation’s impact on survival. These data can be used to quantitatively ascertain the effect of loss-of-function mutations at any given locus, intragenic or intergenic, in the conditions under which the library is grown (8). Essential gene sets for 42 diverse organisms distributed across all three domains have now been defined, largely through the use of Tn-seq (9). A recently developed variation on Tn-seq, random barcode transposon site sequencing (RB-TnSeq) (10), further minimizes the library preparation and sequencing costs of whole-genome mutant screens.
Despite the proliferation of genome-wide essentiality screens, a complete essential gene set has yet to be defined for a photosynthetic organism. A collection of phenotyped Arabidopsis thaliana mutants has been created but extends to only one-tenth of Arabidopsis genes (11). In algae, efforts are underway to produce a Tn-seq–like system in Chlamydomonas reinhardtii; however, the mutant library currently lacks sufficient saturation to determine gene essentiality (12). To date, the essential genes for photoautotrophs have only been estimated by indirect means, such as by comparative genomics (13). The absence of experimentally determined essential gene sets in photosynthetic organisms, despite their importance to the environment and industrial production, is largely because of the difficulty and time required for genetic modification of these organisms.
Cyanobacteria comprise an extensively studied and ecologically important photosynthetic phylum. They are responsible for a large portion of marine primary production and have played a foundational role in research to decipher the molecular components of photosynthesis (14, 15). Synechococcus elongatus PCC 7942 is a particularly well-studied member of this phylum because of its genetic tractability and streamlined genome (16). As a result, it has been developed as a model photosynthetic organism and a production platform for a number of fuel products and high-value chemicals (17). Despite the importance of S. elongatus for understanding photosynthesis and industrial production, 40% of its genes have no functional annotation, and only a small portion of those that do have been studied experimentally.
Here, we use RB-TnSeq, a method that pairs high-density transposon mutagenesis and pooled mutant screens, to probe the S. elongatus genome for essential genes and noncoding regions. We categorized 96% of 2,723 genes in S. elongatus as either essential (lethal when mutated), beneficial (growth defect when mutated), or nonessential (no phenotype when mutated) under standard laboratory conditions. Furthermore, we determined the genome-wide essentiality of noncoding RNAs (ncRNAs), regulatory regions, and intergenic regions. Our investigation has produced an extensive analysis of the loci essential for the growth of a photosynthetic organism and developed a powerful genomic tool that can be used for additional screens under a wide array of ecologically and industrially relevant growth conditions.
Results
Transposon Library Creation and Insertion Site Mapping.
Our RB-TnSeq library in S. elongatus was constructed by mutagenesis with a Tn5-derived transposon delivered by conjugation. The transposon contains a kanamycin resistance cassette for selection of mutants. As an addition to the traditional Tn-Seq approach, in RB-TnSeq, a 20-bp random DNA barcode is also inserted with the resistance marker. These unique barcodes, after being linked to the surrounding sequences, serve as identifier tags for each insertion’s location and simplify downstream genome-wide screens using BarSeq (10, 18). To achieve the efficiency of transposition necessary to create a high-density insertion library and minimize contamination by Escherichia coli DNA in sequencing reactions, several improvements were made to traditional S. elongatus conjugation protocols (16, 19), including increasing the light intensity during conjugation approximately fourfold, decreasing the conjugation time, and using an additional outgrowth step (Materials and Methods and Table S1). In total, ∼375,000 individual transposon mutants were pooled to create the final library. The pooled library was sequenced before storage or outgrowth to map the location of each transposon insertion as well as its random DNA barcode (Tn-Seq). We identified 246,913 mutants with unique insertion locations that were supported by at least two sequencing reads. Insertion locations showed a relatively even distribution, with an average density of one insertion mutation present in the population for every 11 bp of the 2.7-Mbp genome (Fig. 1). The locations of all transposon insertions are presented in Dataset S1. The associated barcodes that could be mapped with high confidence are presented in Dataset S2.
Table S1.
The major variations of techniques used for conjugation
| Conjugation light intensity (μmol·m−2⋅s−1) | Ratio (mL:mL) of Synechococcus elongatus:Escherichia coli | Conjugation medium | Conjugation time (h) | Efficiency* |
| 10–40 | 5:1 | Filter (directly transferred to selective plate) | 6–8 | 1.1 × 10⁻⁸ (n = 1) |
| 10–40 | 2:1 | Filter | 6–8 | 1.5 × 10⁻⁸ (n = 1) |
| 10–40 | 10:1 | Filter | 24 | 2.2 × 10⁻⁸ (n = 1) |
| 10–40 | 10:1 | Filter | 6–8 | 3.3 × 10⁻⁸ (n = 1) |
| 10–40 | 10:1 | Agar transferred by wash to selective plate | 24 | 4.4 × 10⁻⁸ (n = 2) |
| 10–40 | 10:1 | Agar transferred by wash to selective plate | 6–8 | 4.7 × 10⁻⁸ (n = 2) |
| 100–140 | 5:1 | Filter | 24 | 2.1 × 10⁻⁷ (n = 1) |
| 100–140 | 5:1 | Filter | 6–8 | 2.1 × 10⁻⁷ (n = 1) |
| 100–140 | 2:1 | Filter | 24 | 2.8 × 10⁻⁷ (n = 1) |
| 10–40 | 1:1 | Filter | 6–8 | 3.0 × 10⁻⁷ (n = 2) |
| 100–140 | 2:1 | Filter | 6–8 | 3.3 × 10⁻⁷ (n = 1) |
| 10–40 | 1:1 | Filter | 24 | 5.0 × 10⁻⁷ (n = 2) |
| 10–40 | 1:1 | Agar with selective agent underlayed | 24 | 7.8 × 10⁻⁷ (n = 1) |
| 10–40 | 1:1 | Filter | 48 | 1.1 × 10⁻⁶ (n = 1) |
| 100–140 | 1:1 | Filter | 24 | 2.0 × 10⁻⁶ (n = 1) |
| 100–140 | 1:1 | Filter | 6–8 | 3.9 × 10⁻⁶ (n = 4)† |
Colony forming units (CFU) of conjugated mutants per CFUs of S. elongatus culture.
The conditions used for generation of the RB-TnSeq library.
Fig. 1.

The distribution of transposon mutations in the library overlaid across the S. elongatus main chromosome and two plasmids. Upper, the number of transposons (in 1,000-bp bins for the main chromosome and 100-bp bins for the plasmids) is represented by the length of the green bars in the outer circles. The locations of essential genes are shown in red in the inner circles. Lower shows a blown-up view of a region with underrepresentation of transposon insertions that encodes subunits of RNA polymerase. Lengths of black vertical bars represent numbers of sequence reads, and green bars indicate positions of insertions. Essential genes are in red, and nonessential genes are in blue (numbers represent SynPCC7942 gene numbers from the Joint Genome Institute annotation).
S. elongatus maintains three to six copies of its genome (20, 21). Therefore, mutants containing a transposon insertion in an essential region can acquire a kanamycin resistance insertion on one copy of the chromosome and retain viability by maintaining at least one copy of the essential WT allele. Indeed, removal of the selective agent from a transposon library in Methanococcus maripaludis has been previously shown to cause heterozygous mutants to lose their resistance-encoding insertions (22). To test the possibility that the pooled S. elongatus library is harboring heterozygous mutants, we performed an outgrowth of an aliquot of the mutant library in the absence of kanamycin alongside a control aliquot of the library containing kanamycin. Before and after this outgrowth, the abundances of the mutants comprising these library aliquots were assayed by sequencing only their DNA barcodes (BarSeq), which had been previously associated with insertion sites. The kanamycin and no kanamycin libraries had minimal divergence over seven to eight generations (R2 = 0.89) (Fig. S1). These data suggest that heterozygosity had largely been resolved before analysis of the library and should have minimal impact on the conclusions drawn from this library.
Fig. S1.

Divergence of antibiotic and no antibiotic library outgrowths. Each gene’s fitness score is plotted after outgrowth with kanamycin (y axis) or without kanamycin (x axis) for seven generations. Negative values represent genes that had negative effects when mutated (beneficial genes), and positive values represent genes that had positive effects when mutated (disadvantageous genes).
Determining Gene Essentiality.
To use the distribution of transposons in the library to make conclusions about essential genomic regions, it was necessary to first rule out potential sources of bias in our transposon insertion data. Polar effects, in which a transposon disrupts expression of downstream genes in a transcript, seem to have some influence but are not pervasive in the data (SI Results). Although previous studies have shown increased transposon insertion density around the origin of replication (23), our library did not contain such skewing (Fig. 1). Another concern was bias toward insertions occurring at specific sequence motifs; however, there was not strong enrichment for specific sequences around the insertion site (24) (Fig. S2). There was, however, a positive bias for insertion into guanine-cytosine (GC) rich regions. Thus, during the determination of gene essentiality, insertion frequency was normalized to GC content (Fig. S3).
Fig. S2.

Lack of sequence bias around insertion locations. The y axis shows bit score, a measure of sequence conservation, with a perfectly conserved base denoted by a score of two (24). The insertion location is between −1 and 0 bp.
Fig. S3.

Normalizing for GC bias of insertion density. A, Upper shows the insertion density (y axis) for each gene compared with its GC% (x axis) before normalization. These values were normalized by dividing each insertion density by the trend line value for its GC%. A, Lower shows the insertion density normalized for GC% (insertion index). B, Upper shows the insertion density for each of the recently annotated ncRNAs (45) compared with its GC% before normalization. B, Lower shows the insertion density normalized for GC% (insertion index).
To identify essential genes, we determined the number of insertions present in the library that mapped to each S. elongatus gene. Insertions within essential genes were expected to be underrepresented in the library, because such mutants should not be viable. To create a comparable measure of insertion density for genes, an insertion index, we normalized for the GC% bias of insertions (Fig. S3A) and divided the number of insertions in each gene by its length to get an insertion density. We also removed 25 genes from consideration that were either too short or too similar to other genes to measure confidently, and excluded the beginning and end 10% of every gene from analysis, because the extremes of otherwise essential genes can be permissive of insertions (25). In this way, we calculated an insertion index for 2,698 of 2,723 genes in S. elongatus (details are in Materials and Methods). The index had a bimodal distribution, with a group of putative essential genes with zero or very few insertions and a group of putative nonessential genes that could tolerate insertions (Fig. 2A). Using methods developed previously (5), we found a subset of genes that was four times more likely to belong to the distribution of genes with low insertion indexes and categorized them as essential genes. Genes that were four times more likely to be part of the set of genes with high insertion indexes were classified as nonessential genes, whereas those genes that fell in between these cutoffs were put in the ambiguous category. This initial survey of essentiality allowed the categorization of 1,889 nonessential genes, 764 likely essential genes, and 45 ambiguous genes.
Fig. 2.

The determination of gene essentiality. (A) The distribution of insertion indexes of all analyzed genes immediately after creation of the library, which was used to determine gene essentiality. The y axis indicates the number of genes, with the insertion index shown on the x axis. (B) The distribution of fitness for each gene after six generations used to refine the essentiality measurements and assign genes that are beneficial (growth defect when mutated). The y axis indicates the number of genes, with the fitness score shown on the x axis. The cutoff for beneficial genes that have significant growth defects when mutated is denoted by a dotted vertical line. Each gene’s fitness is averaged from four growth samples in control conditions and normalized to zero, which represents a neutral fitness contribution. (C) The number of genes in the genome that are nonessential, essential, beneficial, ambiguous, or not analyzed.
These essentiality calls were further refined by thawing an aliquot of the library, growing it for an additional six generations, and assaying the abundance of its constitutive mutants by BarSeq. The results of this outgrowth were made more generalizable by conducting it in four commonly used laboratory conditions (Materials and Methods). Mutant abundance before and after outgrowth was used to determine a fitness score for each gene in the library over approximately six generations (Fig. 2B). Thus, in addition to both essential and nonessential genes, we were able to identify 157 genes where insertions reduced average fitness across the four common laboratory conditions (average fitness ≤−1.32) over the period of the outgrowth [P < 0.01 and false discovery rate (FDR) < 0.1; t test]. These genes were assigned to the new category of beneficial genes, which cause a growth defect when they are mutated in standard laboratory conditions. Interestingly, we identified no deleterious genes for which insertion mutations conferred a growth advantage to S. elongatus under the conditions tested.
Data from these outgrowths were also used to make our essentiality calls more stringent. Genes were moved to the ambiguous bin when the data from the prefreeze characterization of the library and the outgrowth were conflicting (Materials and Methods). In this way, the final essentiality calls were made, in which 1,748 S. elongatus genes were called as nonessential, 718 were categorized as essential, 157 were binned as beneficial, and 75 were considered ambiguous (Fig. 2C and Dataset S3).
Comparisons to Other Essentiality Measures.
The essential gene set experimentally derived in this study was compared with indirect measurements of gene importance to both provide support for our experimental results and identify potentially informative disagreements. One indirect assessment of gene importance was provided by gene conservation among different species of cyanobacteria. We compared 682 genes conserved across 13 diverse cyanobacterial genomes (26) with the set of essential genes identified in our study. Sixty percent of these conserved genes were also part of our essential gene set (Fig. 3A and Dataset S3), which represents a significant enrichment over random chance (P < 0.001; Fischer's exact test) and thus, a strong correlation between essentiality and conservation. The analysis was repeated with two other cyanobacterial conserved gene sets, which had very similar size overlaps with our essential gene set (27, 28), providing validation of the essentiality calls made using the library.
Fig. 3.

Comparing the essential gene set with other predictors of gene importance. (A) The numbers of essential, conserved (26), and hypothetical genes that are overlapping and unique. (B) Fold enrichment for functional categories (TIGR function roles) that were significantly enriched or underrepresented in the essential gene sets of E. coli (29) (black bars) and S. elongatus (white bars).
The genes that fall outside the overlap of essential and conserved genes are also of interest; 312 S. elongatus genes that we identified as essential but are not in the conserved gene set illustrate the limitation of determining gene importance by conservation and the necessity of using experimental approaches, such as RB-TnSeq, to determine essentiality. Conversely, 276 genes that are conserved but not essential may be important under environmental conditions that were not tested in this study.
The essential gene set was also probed for any enrichment in particular functional categories. The set was highly enriched for genes involved in synthesis of proteins, nucleic acids, and small molecules as well as lipid metabolism (P < 0.05 and FDR < 0.05) (Fig. 3B and Dataset S3). Very similar enrichment patterns have previously been observed in the E. coli set of essential genes (29), with the notable exception of energy metabolism, which is significantly enriched among S. elongatus essential genes and significantly underrepresented in the essential genes of E. coli. This discrepancy may be explained by the necessity of photosynthesis and carbon fixation in S. elongatus, which is extremely limited in the types of metabolism that it can perform; in contrast, E. coli can be grown on a wide variety of carbon sources. The enrichment in the S. elongatus essential gene set for conserved genes and core functional groups as well as its tight correlation with E. coli essential genes offer significant support to the validity of our essentiality calls.
A much broader measure of gene functionality is the mere presence or absence of a functional annotation. S. elongatus genes were divided into those that are annotated with functional predictions and those that are not (hypothetical genes). Hypothetical genes make up 40% of the genome; however, in the essential gene set, the portion of unannotated genes is only 15%. This difference likely represents the conservation of essential genes in other well-studied organisms as well as a bias toward studying genes that can be linked to measurable phenotypes. Despite their underrepresentation in the essential gene set, there are 109 genes called as essential that have no functional annotation in S. elongatus (Fig. 3A and Dataset S3). Among these genes, 21 are conserved throughout cyanobacteria (26), and 10 are conserved throughout the Greencut2 dataset of green plant and algae conserved genes (30) (Dataset S3). These unstudied but indispensable genes and specifically, those that are broadly conserved represent important targets for future research.
Essentiality of Energy Metabolism.
Carbon metabolism.
To further validate our essential gene set and explore any inconsistencies that it may have with predictions of gene importance based on conservation and functionality, we examined central carbon metabolism. This area is ideal for the verification of our essentiality predictions, because it is at the core of all life and must be leveraged for the development of cyanobacteria as a bioproduction platform. Any differences between our expectations for gene importance in these pathways and the experimental evidence from the transposon library suggest either incorrect calls of essentiality or interesting and unexpected biological findings.
We first examined genes in the following pathways of central carbon metabolism for their essentiality: the pentose phosphate pathway, glycolysis, the Calvin–Benson cycle, and the TCA cycle. For each pathway, we identified the S. elongatus genes and any functional redundancy of these genes using BioCyc (31). Our expectation was that genes in these essential pathways of metabolism that are not functionally redundant and are conserved among cyanobacteria are likely to be essential. Of a total of 27 conserved nonredundant genes in these pathways, 22 agreed with this expectation and were called as likely essential from our library (Fig. 4A and Table S2), significantly more than could be expected by chance (P < 0.001; Fischer’s exact test). Of five nonessential “disagreements” to this expectation, four were in the pentose phosphate pathway. One of these, transaldolase (tal; SynPCC7942_2297), acts in the nonoxidative phase of the pentose phosphate pathway. To validate its nonessentiality, we regenerated an insertion mutant in the tal gene to show that it is not required for growth under standard laboratory conditions (Fig. S4). The other three disagreements in the pentose phosphate pathway encode 6-phosphogluconolactonase (pgl; SynPCC7942_0529), glucose-6-phosphate 1-dehydrogenase (zwf; SynPCC7942_2334), and 6-phosphogluconate dehydrogenase (gnd; SynPCC7942_0039). These proteins make up the oxidative branch of the pathway, where reducing equivalents are produced in the form of NADPH. This finding is supported by previous literature, which has shown that both zwf and gnd mutants are viable (32, 33), although both mutants have decreased growth in light–dark cycles. This defect is likely because the cell relies on the oxidative branch of the pentose phosphate pathway for reducing equivalents when cells are in the dark and photosynthesis is inactive, whereas this pathway would be dispensable under the constant light of standard laboratory conditions.
Fig. 4.

Gene essentiality in central metabolism. (A) The number of genes that are conserved and nonredundant members of the Calvin–Benson cycle (CBC), the TCA cycle, glycolysis (Gly), and the pentose phosphate pathway (PPP). In the disagreements column, conserved nonredundant members of these pathways that are not essential are shown. (B) Genotypic characterization of the recreated fumC mutant. Lane 1, standard 1-kb ladder (New England BioLabs); lane 2, amplification of WT DNA with primers surrounding the fumC gene; lane 3, amplification of fumC mutant (8S42-O6), in which a 1.3-kb insertion is present, with the same primers. Each band is representative of three colonies tested. (C) Growth curves of the WT and fumC mutant strain. The error bars indicate the SDs for three independent replicates. (D) Essentiality in the TCA cycle. For enzymes that are present in S. elongatus, their names are shown: acnB (SynPCC7942_0903), icd (SynPCC7942_1719), sdhB (SynPCC7942_1533), fumC (SynPCC7942_1007), gltA (SynPCC7942_0612), maeA (SynPCC7942_1297), and ppc (SynPCC7942_2252). Abbreviations for enzymes that are missing are shown in white boxes: MDH, malate dehydrogenase; MQO, malate:quinone oxidoreductase; 2-OGDH, 2-oxoglutarate dehydrogenase; STK, succinate thiokinase.
Table S2.
Essential genes in central carbon metabolism
| Synechococcus elongatus identification | Name | Pathway* | Essentiality | Conserved† | Redundant‡ |
| SynPCC7942_2297 | tal | Pentose phosphate pathway | Nonessential | 1 | 0 |
| SynPCC7942_0538 | tktA | Pentose phosphate pathway | Essential | 1 | 0 |
| SynPCC7942_0604 | cbbE | Pentose phosphate pathway | Essential | 1 | 0 |
| SynPCC7942_0584 | rpiA | Pentose phosphate pathway | Essential | 1 | 0 |
| SynPCC7942_0529 | pgl | Pentose phosphate pathway | Nonessential | 1 | 0 |
| SynPCC7942_2334 | zwf | Pentose phosphate pathway | Nonessential | 1 | 0 |
| SynPCC7942_0039 | gnd | Pentose phosphate pathway | Nonessential | 1 | 0 |
| SynPCC7942_0098 | pyk | Glycolysis | Essential | 1 | 0 |
| SynPCC7942_0639 | eno | Glycolysis | Essential | 1 | 0 |
| SynPCC7942_0469 | pgmM | Glycolysis | Essential | 1 | 1 |
| SynPCC7942_1116 | pgk | Glycolysis | Essential | 1 | 0 |
| SynPCC7942_1939 | gap3 | Glycolysis | Nonessential | 0 | 1 |
| SynPCC7942_0245 | gap1 | Glycolysis | Nonessential | 0 | 1 |
| SynPCC7942_1261 | tpiA | Glycolysis | Essential | 1 | 0 |
| SynPCC7942_1443 | cbbA | Glycolysis | Essential | 1 | 0 |
| SynPCC7942_0592 | pfkA | Glycolysis | Nonessential | 0 | 0 |
| SynPCC7942_2029 | pgi | Glycolysis | Essential | 1 | 0 |
| SynPCC7942_0781 | ppsA | Glycolysis | Nonessential | 0 | 0 |
| SynPCC7942_2335 | fbp | Glycolysis | Nonessential | 0 | 1 |
| SynPCC7942_0505 | fbpI | Glycolysis | Essential | 1 | 1 |
| SynPCC7942_0485 | pgam1 | Glycolysis | Essential | 1 | 1 |
| SynPCC7942_1516 | pgam2 | Glycolysis | Essential | 0 | 1 |
| SynPCC7942_2078 | pgam3 | Glycolysis | Nonessential | 0 | 1 |
| SynPCC7942_0612 | gltA | TCA cycle | Essential | 1 | 0 |
| SynPCC7942_0903 | acnB | TCA cycle | Essential | 0 | 0 |
| SynPCC7942_1007 | fumC | TCA cycle | Nonessential | 1 | 0 |
| SynPCC7942_1719 | icd | TCA cycle | Essential | 0 | 0 |
| SynPCC7942_1533 | sdhB | TCA cycle | Nonessential | 0 | 0 |
| SynPCC7942_1427 | cbbS | Calvin–Benson–Bassham cycle | Essential | 1 | 0 |
| SynPCC7942_1426 | cbbL | Calvin–Benson–Bassham cycle | Essential | 1 | 0 |
| SynPCC7942_1116 | pgk | Calvin–Benson–Bassham cycle | Essential | 1 | 0 |
| SynPCC7942_1742 | gap2 | Calvin–Benson–Bassham cycle | Essential | 1 | 0 |
| SynPCC7942_1261 | tpiA | Calvin–Benson–Bassham cycle | Essential | 1 | 0 |
| SynPCC7942_1443 | cbbA | Calvin–Benson–Bassham cycle | Essential | 1 | 0 |
| SynPCC7942_2335 | fbp | Calvin–Benson–Bassham cycle | Nonessential | 0 | 1 |
| SynPCC7942_0538 | tktA | Calvin–Benson–Bassham cycle | Essential | 1 | 0 |
| SynPCC7942_0505 | fbpI | Calvin–Benson–Bassham cycle | Essential | 1 | 1 |
| SynPCC7942_0604 | cbbE | Calvin–Benson–Bassham cycle | Essential | 1 | 0 |
| SynPCC7942_0977 | prk | Calvin–Benson–Bassham cycle | Essential | 0 | 0 |
| SynPCC7942_0584 | rpiA | Calvin–Benson–Bassham cycle | Essential | 1 | 0 |
Fig. S4.
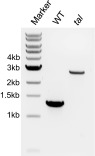
Genotypic characterization of the recreated tal mutant. Lane 1, standard 1-kb ladder (New England BioLabs); lane 2, amplification of WT DNA with primers surrounding the tal gene; lane 3, amplification of tal mutant (UGS-3-C-11), which carries a 1.3-kb insertion, with the same primers. Each band is representative of three colonies tested.
The only other nonredundant member of central metabolism that is conserved but not essential is fumarate hydratase (fumC; SynPCC7942_1007). This finding was unexpected, because the absence of fumC would likely block cyclic flow through the TCA cycle. Furthermore, fumC is thought to be important for the recycling of fumarate in another freshwater cyanobacterium, Synechocystis sp. PCC 6803 (34). To validate this finding, we regenerated an insertion mutant of fumC. In accordance with our library-based call, we were able to obtain a fully segregated mutant (Fig. 4B) that grew at a statistically indistinguishable rate from the WT (Fig. 4C). Furthermore, the nonconserved enzyme directly upstream of fumC, succinate dehydrogenase (sdhB; SynPCC7942_1533), is also nonessential (Fig. 4D). The dispensability of these enzymes suggests that a complete TCA cycle is not required in S. elongatus under standard laboratory conditions.
Photosynthesis.
Because S. elongatus serves as a model for photosynthesis, we examined the essentiality of some of the central components of the photosynthetic lifestyle. To provide a broad overview of core genes in the green lineage, we produced Table S3 of the S. elongatus genes called as essential here that are also present in the greencut2 dataset (30), which contains genes conserved among plants and green algae that are not present in nonphotosynthetic organisms (Table S3). These data provide a synopsis of some of the most conserved and important components of photoautotrophism. However, central components of photosynthesis that are not ubiquitous are not included in Table S3. As an example, carboxysome components are not contained in Table S3 because of their absence in most plants and algae, although many of them are essential for survival in S. elongatus according the literature (35) and the essential gene set (Dataset S3).
Table S3.
Essential genes for the photosynthetic lifestyle
| Synechococcus elongatus identification | Name | Description | Cyano conserved* |
| SynPCC7942_0027 | bioF | 8-Amino-7-oxononanoate synthase | No |
| SynPCC7942_0203 | ribD | 5-Amino-6-(5-phosphoribosylamino)uracil reductase… | Yes |
| SynPCC7942_0222 | Hypothetical protein | No | |
| SynPCC7942_0226 | Sec-independent protein translocase TatA | No | |
| SynPCC7942_0257 | Protein of unknown function DUF92, transmembrane | Yes | |
| SynPCC7942_0297 | ftsH | FtsH peptidase homolog, chloroplast; metallopeptidase | No |
| SynPCC7942_0320 | galE | UDP-galactose 4-epimerase | No |
| SynPCC7942_0322 | ycf44 | c-Type cytochrome biogenesis protein | Yes |
| SynPCC7942_0323 | ccdA | Cytochrome c biogenesis protein-like | Yes |
| SynPCC7942_0330 | atp1 | Hypothetical protein | Yes |
| SynPCC7942_0333 | atpG | F0F1 ATP synthase subunit B′ | Yes |
| SynPCC7942_0439 | chlM | Mg-protoporphyrin IX methyl transferase | Yes |
| SynPCC7942_0450 | nifU | Putative NifU-like protein | Yes |
| SynPCC7942_0485 | gpmB | Phosphoglycerate mutase | Yes |
| SynPCC7942_0492 | ribF | Bifunctional riboflavin kinase/FMN adenylyltransferase | Yes |
| SynPCC7942_0537 | fabF | 3-Oxoacyl-(acyl carrier protein) synthase II | Yes |
| SynPCC7942_0560 | ATPase | No | |
| SynPCC7942_0584 | rpiA | Ribose-5-phosphate isomerase A | Yes |
| SynPCC7942_0632 | rplJ | 50S ribosomal protein L10 | Yes |
| SynPCC7942_0684 | fabG | 3-oxoacyl-[acyl-carrier-protein] reductase | Yes |
| SynPCC7942_0694 | rps1 | 30S ribosomal protein S1 | Yes |
| SynPCC7942_0775 | Hypothetical protein | No | |
| SynPCC7942_0853 | dapL1 | l,l-diaminopimelate aminotransferase | No |
| SynPCC7942_0884 | EF-Tu | Elongation factor Tu | Yes |
| SynPCC7942_0894 | aroK | Shikimate kinase | Yes |
| SynPCC7942_0897 | minE | Cell division topological specificity factor MinE | Yes |
| SynPCC7942_0912 | dnaX | DNA polymerase III, τ-subunit | Yes |
| SynPCC7942_0928 | Outer envelope membrane protein | No | |
| SynPCC7942_0942 | ftsH | FtsH peptidase homolog, chloroplast, metallo peptidase | No |
| SynPCC7942_0959 | obgE | GTPase ObgE | Yes |
| SynPCC7942_0977 | prk | Phosphoribulokinase | No |
| SynPCC7942_0978 | petH | Ferredoxin-NADP oxidoreductase | Yes |
| SynPCC7942_0988 | ycf54 | Conserved hypothetical protein YCF54 | No |
| SynPCC7942_1002 | psaD | Photosystem I reaction center subunit II | Yes |
| SynPCC7942_1068 | pdhC | Branched-chain α-keto acid dehydrogenase subunit E2 | Yes |
| SynPCC7942_1083 | Probable glycosyltransferase | Yes | |
| SynPCC7942_1086 | hemE | Uroporphyrinogen decarboxylase | Yes |
| SynPCC7942_1198 | phdD | Dihydrolipoamide dehydrogenase | Yes |
| SynPCC7942_1232 | petC | Cytochrome b6-f complex iron-sulfur subunit | Yes |
| SynPCC7942_1274 | ycf37 | TPR repeat | Yes |
| SynPCC7942_1351 | HAD-superfamily hydrolase subfamily IA, variant 3 | No | |
| SynPCC7942_1359 | Coenzyme F420 hydrogenase | No | |
| SynPCC7942_1427 | rbcS | Ribulose 1,5-bisphosphate carboxylase small subunit | Yes |
| SynPCC7942_1457 | plsC | 1-Acyl-sn-glycerol-3-phosphate acyltransferase | Yes |
| SynPCC7942_1497 | Hypothetical protein | No | |
| SynPCC7942_1499 | petF | Ferredoxin (2Fe-2S) | No |
| SynPCC7942_1520 | rpsT | 30S ribosomal protein S20 | Yes |
| SynPCC7942_1590 | Hypothetical protein | No | |
| SynPCC7942_1673 | Hypothetical protein | Yes | |
| SynPCC7942_1734 | ftrC | Ferredoxin-thioredoxin reductase catalytic chain | No |
| SynPCC7942_1737 | sufD | Iron-regulated ABC transporter permease protein SufD | Yes |
| SynPCC7942_1830 | trxA | Thioredoxin | Yes |
| SynPCC7942_1883 | ycf53 | Conserved hypothetical protein YCF53 | No |
| SynPCC7942_1907 | acsF | Mg-protoporphyrin IX monomethyl ester (oxidative) cyclase | No |
| SynPCC7942_1959 | proS | Prolyl-tRNA synthetase | Yes |
| SynPCC7942_1983 | pds | ζ-Carotene desaturase/three-step phytoene desaturase | No |
| SynPCC7942_2017 | Hypothetical protein | Yes | |
| SynPCC7942_2062 | crtL | Lycopene cyclase (CrtL-type) | No |
| SynPCC7942_2084 | chlG | Bacteriochlorophyll/chlorophyll a synthase | Yes |
| SynPCC7942_2089 | Thioredoxin domain 2 | Yes | |
| SynPCC7942_2113 | kprS | Ribose-phosphate pyrophosphokinase | Yes |
| SynPCC7942_2117 | gatA | Aspartyl/glutamyl-tRNA amidotransferase subunit A | Yes |
| SynPCC7942_2136 | dapB | Dihydrodipicolinate reductase | Yes |
| SynPCC7942_2274 | chlD | Protoporphyrin IX magnesium-chelatase | Yes |
| SynPCC7942_2312 | murG | UDP-N-acetylglucosamine-N-acetylmuramyl-(pentapeptide)… | Yes |
| SynPCC7942_2330 | ctpA | C-terminal processing peptidase-2; serine peptidase | No |
| SynPCC7942_2359 | nha3 | Na+/H+ antiporter | No |
| SynPCC7942_2415 | lysS | Lysyl-tRNA synthetase | Yes |
| SynPCC7942_2503 | por | Protochlorophyllide oxidoreductase | Yes |
| SynPCC7942_2524 | tig | Trigger factor | Yes |
| SynPCC7942_2531 | tsf | Elongation factor Ts | Yes |
| SynPCC7942_2537 | clpPIII | ATP-dependent Clp protease proteolytic subunit | Yes |
| SynPCC7942_2538 | clpR | ATP-dependent Clp protease-like protein | Yes |
| SynPCC7942_2581 | petF | Ferredoxin (2Fe-2S) | Yes |
S. elongatus essential genes conserved in the green lineage (plants and green algae) but not in nonphotosynthetic organisms as determined using the greencut2 dataset (30). GTPase, guanosine triphosphate hydrolase.
Refers to conservation among all 13 of the cyanobacterial genomes studied in the work by Shi and Falkowski (26).
We also examined the main complexes of photosynthetic light reactions for their essentiality in our dataset. We could not analyze the photosystem II core reaction center genes using our library, because the high sequence identity within the paralogous psbA (SynPCC7942_0424, SynPCC7942_0893, and SynPCC7942_1389) and psbD (SynPCC7942_0655 and SynPCC7942_1637) genes complicated transposon mapping; however, previous work has shown that the psbA genes and psbDII (SynPCC7942_1637) are not individually necessary (36, 37). The genes encoding the cytochrome b559 complex, psbE (SynPCC7942_1177) and psbF (SynPCC7942_1176), and the internal antenna proteins, psbB (SynPCC7942_0697) and psbC (SynPCC7942_0656), of photosystem II were all classified as essential. These data are in agreement with studies in Synechocystis sp. PCC 6803, where cytochrome b559, PsbB, and PsbC are required for photoautotrophic growth (38–40). Of the remaining 16 supportive and stabilizing proteins in photosystem II, only 4 [psbH (SynPCC7942_0225), psbM (synPCC7942_0699), psbL (SynPCC7942_1175), and psbV (SynPCC7942_2010)] were classified as essential. In the cytochrome b6f complex, the genes that encode the four large core subunits [petA (SynPCC7942_1231), petB (SynPCC7942_2331), petC (SynPCC7942_1232), and petD (SynPCC7942_2332)] were all called as essential. In accordance with the literature, the smaller subunits petG (SynPCC7942_1479) and petN (SynPCC7942_0475) were classified as essential (41), whereas petM (SynPCC7942_2426) was ambiguous. In photosystem I, the core genes, psaA (SynPCC7942_2049) and psaB (SynPCC7942_2048), were classified as essential along with two of three proteins that make the docking site for ferredoxin: psaC (SynPCC7942_0535) and psaD (SynPCC7942_1002). Only one of five remaining supporting genes, psaJ (SynPCC7942_1249), was called as essential. Overall, as expected, the genes at the core of the photosynthetic light reactions were largely classified as essential, whereas genes with a more supportive role were largely predicted by the library to be nonessential or beneficial.
Beyond Coding Sequence.
Essentiality of ncRNAs.
The saturation of the library is such that it was possible to do an extensive analysis of ncRNAs. There are currently three ncRNA loci in the National Center for Biotechnology Information (NCBI) S. elongatus genome annotation (NC_007604.1) that do not encode ribosomal or tRNAs. These widely conserved ncRNAs are ssrA (SynPCC7942_R0017), which mediates tagging of polypeptides for degradation, rnpB (SynPCC7942_R0036), a member of the RNase P complex involved in tRNA processing, and ffs (SynPCC7942_R0047), the RNA component of the signal recognition particle (SRA), a ribonucleoprotein that targets proteins to the plasma membrane. We classified all three of these ncRNAs as essential in S. elongatus, which corresponds to findings in E. coli that rnpB and ffs are essential (42, 43). Although not essential in E. coli, ssrA is essential in a number of other species (44). These three ncRNAs are included in the 718-gene essential gene set (Dataset S3).
Recently, 1,579 putative ncRNAs beyond those in the current NCBI annotation were identified in S. elongatus by RNA sequencing (45). To address the importance of these ncRNAs to the survival of the organism, we used the same approach taken for determining the gene essentiality of the previously annotated genes. Those ncRNAs that overlap each other or are too small to confidently predict essentiality were eliminated from the analysis. In addition, the ncRNAs encoded within genes that had been characterized by the library as essential, beneficial, ambiguous, or unanalyzed were not considered. This elimination was made, because ncRNAs in this set may be falsely called as essential when the gene surrounding or overlapping them is the true essential element. For the remaining 847 putative ncRNAs, we calculated insertion density and normalized it for GC bias to create an insertion index (Fig. S3B). The insertion indexes of these recently discovered ncRNAs, unlike the NCBI annotated genes described in Fig. 2A, did not contain a clear “essential peak” of ncRNA with low insertion indexes (Fig. 5A). The ncRNA insertion distribution was very similar to the previously analyzed nonessential genes, with a larger variance, presumably because of the short average length of the ncRNAs. Therefore, under standard laboratory conditions, these recently identified ncRNAs have little effect on survival of the organism relative to the largely protein-coding set of genes, which were previously annotated.
Fig. 5.

Essentiality of ncRNAs. (A) The distribution of insertion indexes for the recently discovered ncRNAs (45). Axes are the same as in Fig. 2A. (B) The insertion distribution in and around the group I intron: ncRNA136. Lengths of black vertical bars represent numbers of sequence reads, and green bars indicate positions of insertions. The nonessential genes surrounding the essential ncRNA136 (red arrow) are shown as blue arrows. Black triangles indicate the locations of insertion mutations used to support the essentiality of ncRNA136. (C) Genotypic characterization of the failure to create a mutant of ncRNA136. Lane 1, standard 1-kb ladder (New England BioLabs); lane 2, amplification of WT DNA with primers surrounding ncRNA136 and both flanking genes; lane 3, amplification with the same primers of the region, in which the gene that flanks the ncRNA136 on the left, SynPCC7942_0413 (2E11-E-C4), carries a 1.3-kb insertion; lane 4, amplification with the same primers of a putative transformant, in which interruption of ncRNA136 (2E11-E-N7) was attempted, but the 1.3-kb insertion is absent; lane 5, amplification with the same primers of the region, in which the gene that flanks the ncRNA136 on the right, SynPCC7942_0414 (2E11-E-N11), carries a 1.3-kb insertion. Each band is representative of genotyping of three colonies.
Although most of the analyzed ncRNAs are nonessential, we identified 35 ncRNAs with normalized insertion densities below the essentiality cutoff as determined for annotated genes (Dataset S4). We manually examined the transposon insertion coverage around each of these 35 ncRNAs to ensure that the ncRNA did not fall in an area where transposons were underrepresented, such as regulatory regions for essential genes, or nonessential genes with below-average transposon numbers. Of 35 ncRNAs with normalized insertions densities below the cutoff, 10 were both visually and statistically considered to be underrepresented for insertions (P < 0.01 and FDR < 0.05; Poisson distribution) and called as likely essentials. Overall, we identified 13 likely essential ncRNAs that are not tRNAs or ribosomal: 10 from the recently discovered ncRNAs (45) and 3 with loci that had previously been annotated.
The 10 ncRNAs from the recently discovered set were searched against known ncRNAs families using the RNA families database (RFAM) (46). One of the likely essential ncRNAs, ncRNA136, was identified as a putative group I intron (Fig. 5B). These introns are inserted into some cyanobacterial tRNALeu genes (47, 48) and have been shown to catalyze their own splicing out of pre-tRNALeu transcripts in vitro (49). In S. elongatus, ncRNA136 interrupts tRNALeu (UAA). There are four other uninterrupted tRNALeus in S. elongatus with anticodons that were determined by tRNAscan-SE (50). Taking wobble into account, the anticodons of these four tRNAs cover five of six possible leucine codons. The ncRNA136 identified here as likely essential represents the fifth and final tRNALeu anticodon necessary to complement all six leucine codons. Therefore, this group I intron is likely essential to S. elongatus, because proper splicing of this nonredundant tRNALeu (UAA) cannot occur when it is mutated. The essentiality of this ncRNA was supported by our failure to regenerate insertion loss-of-function mutants for ncRNA136 in parallel with successful generation of mutants for both surrounding genes (Fig. 5C). In conclusion, there is no evidence for nonribosomal, non-tRNA ncRNAs having global importance close to that of protein-coding genes, but there is a smaller set of 13 likely essential ncRNAs, including ncRNA136, a group I intron.
Essential regulatory regions.
To characterize the essential regulatory regions of S. elongatus, we examined insertion frequencies upstream from the predicted start codon of every essential gene. It might be expected that insertions in the regulatory regions of essential genes would have a lesser effect if the promoter for the transposon’s antibiotic resistance gene lay in the same direction as the essential gene. However, we found that the average insertion frequency in the 100 bp upstream of essential genes was very similar for insertions in the same or opposite orientation as the essential gene (0.044 and 0.050, respectively). Therefore, we ignored directionality of upstream transposon insertions and analyzed them as a group. To define the average regulatory region for essential genes, we compared the insertion density upstream of the translation start site for essential genes with that of nonessential genes. We found that the region from the start codon to 52 bp upstream had a significantly lower transposon insertion rate in essential genes relative to nonessential genes (P < 0.05 and FDR < 0.05; Poisson distribution) (Fig. 6A). This region is large enough to encompass the Shine–Dalgarno sequence and basal promoter (51, 52).
Fig. 6.

Essential regulatory regions. (A) Transposon insertion density (insertions per base pair) on the y axis is plotted against the distance upstream from the translational start sites of essential genes (red) and nonessential genes (blue). Shading around the solid lines represents 95% confidence intervals (Poisson distribution). (B) For 557 essential genes that had an insertion before the nearest upstream gene and within 200 bp of the translation start site, the location of the closest insertion relative to the start site is shown.
It is of note that, even in the regulatory positions with the lowest average insertion density, the upstream regions of essential genes are still reasonably permissive of insertions. The density of insertions at this low point is one insertion mutant every 15 bp compared with a genome-wide average of one insertion mutant every 11 bp. Therefore, it is likely that many essential genes can still be transcribed sufficiently to support cell survival, even with transposon mutations directly upstream of the start codon.
To further explore the essential genes with insertions directly upstream of their start codons, essential genes were examined individually. Of those 557 essential genes that contained an insertion within either 200 bp upstream of their translation start site or before the closest upstream gene, 382 were able to sustain transposon insertions within 20 bp of the translation start site (Fig. 6B). Only 138 of the essential genes had no upstream insertions or genes within 40 bp of the start codon, and these upstream regions were categorized as likely essential (P < 0.01 and FDR < 0.05). For all essential genes, the regulatory regions and the length for which they are uninterrupted by a transposon insertion are presented in Dataset S5. The small number of essential upstream regions that we identified and the prevalence of insertions near start codons suggest that sufficient transcription can occur in the absence of typical regulatory elements or that the polymerase is able to read through the transposon cassette.
Essential intergenic regions.
To ensure that no essential regions had been missed by our survey for essentiality in genes, ncRNAs, and regulatory regions, we performed an unbiased analysis of insertion mutants present in the library to identify essential intergenic regions that we had not otherwise analyzed. Specifically, we searched the genome for regions of at least 100 bp for which there are no insertion mutants in the library. Forty-eight such regions were identified, with a maximum uninterrupted region of 222 bp and an average size of 130 bp (Dataset S6). Many of these regions, however, have very low GC%, and because insertion rate is GC%-dependent (Fig. S3), we only called the regions with GC% above 40% as “high-likelihood essentials.” There are 15 of these high-likelihood essential intergenic regions in the genome. Therefore, there are no large previously undetected essential regions; however, a small number of short likely essential regions could be detected, which may be regulatory regions or previously undiscovered ncRNAs.
SI Results
As an additional measure of bias in our calls of essential genes, we assayed these calls for polar effects, in which transposon insertions disrupt expression of downstream genes. We reasoned that, if there were strong polar effects, mutations in a nonessential gene would be lethal if they stopped expression of the downstream essential gene in the transcript; thus, we would not expect to find an operon with a nonessential gene upstream of an essential gene. To check for this possibility, we examined all adjacent genes within annotated operons (45) for essentiality. There were 87 instances of nonessential genes upstream from essential genes and 125 instances of essential genes upstream of nonessential genes. The similar frequency of these two arrangements indicates that there are not pervasive polar effects of the transposon, and conclusions of essentiality within an operon can be made for individual genes.
Discussion
The density of the transposon library created for this study, with one insertion per 11 bp on average, enabled a rich and complete investigation of the genes and intergenic regions that are necessary for the photosynthetic lifestyle. In summary, we identified 718 putative essential genes, 13 likely essential non-tRNA, nonribosomal ncRNAs, 138 potential essential regulatory regions, and 15 other likely essential intergenic regions. The RB-TnSeq approach greatly extends the utility of the library, because it enables fast and inexpensive resequencing of the barcoded transposons in the population after an outgrowth period under standard laboratory conditions and can be used similarly to query the fitness contributions of each locus under additional growth conditions in the future.
There are certain limitations to the essentiality information determined here. Although we identified genes that are essential to the organism when individually mutated, they do not represent a minimal gene set. Essential processes for which there are redundant genes will not be discovered using an approach based on single mutants. In S. elongatus, however, this complication is of lesser concern than in most other cyanobacteria because of its small genome size, which at a streamlined 2.7 Mbp, harbors little redundancy. In addition, the findings of essentiality reported here apply only to the specific laboratory conditions used and are likely to be different for a subset of genes under other growth conditions. Finally, because ncRNAs, regulatory regions, and other intergenic regions are much smaller, on average, than protein-coding genes, the essentiality calls for these regions are inherently of lower confidence than those made for protein-coding genes. Therefore, conclusions of essentiality for noncoding loci and to a lesser extent, protein-coding genes must be validated by targeted mutation before definitive statements can be made about their essentiality.
TCA Cycle in Cyanobacteria.
The ability to compare our essentiality results and predictions of gene importance based on conservation and function yielded fresh insights into fundamental S. elongatus biological processes. An example is the finding that two of the genes of the TCA cycle, including the widely conserved fumC, are dispensable in S. elongatus. The nature of the TCA cycle in cyanobacteria has been a subject of frequent debate. Until recently, it was assumed that the TCA cycle in cyanobacteria is incomplete because of the absence of the enzyme 2-oxoglutarate dehydrogenase (53, 54). More recent research, however, has closed the cyanobacterial TCA cycle with a number of bypasses, such as the 2-oxoglutarate decarboxylase pathway (55), the GABA shunt (56), and the glyoxylate cycle (57). The search for bypasses around missing elements of the TCA cycle presumes that having a complete cycle is important. Here, we found that the TCA cycle enzymes sdhB and fumC are nonessential in S. elongatus. Furthermore, no functionally annotated genes in S. elongatus account for the function of the TCA cycle enzymes malate dehydrogenase, malate:quinone oxidoreductase, succinate thiokinase, or 2-oxoglutarate dehydrogenase, and the 2-oxoglutarate decarboxylase bypass seems to be absent (Fig. 4D) (28). In agreement with the finding that these enzymes are nonessential or missing, the metabolites whose synthesis that they catalyze, with the exception of oxaloacetate, are not required for essential biosynthetic pathways in Synechocystis sp. PCC 6803 (58). Oxaloacetate is required for aspartate biosynthesis but can be produced without cyclic flux through the TCA cycle by phosphoenolpyruvate carboxylase (ppc; SynPCC7942_2252), shown here to be essential. Therefore, a large portion of the TCA cycle between 2-oxoglutarate and oxaloacetate seems to be nonessential for S. elongatus survival (Fig. 4D).
In light of these data, the traditional complete TCA cycle should be reconsidered in S. elongatus. The relevant pathways of the TCA cycle for the organism may resemble more closely the metabolism of certain obligate autotrophs, where cyclic flow through the TCA cycle is replaced by two separate braches that produce the metabolic precursors succinyl-CoA and 2-oxoglutarate independently (59). In S. elongatus, however, none of the necessary enzymes for the succinyl-CoA branch are functionally annotated (31) other than fumC, which is nonessential. This branch of the TCA cycle is likely dispensable because of the succinyl-CoA–independent pathway for heme biosynthesis in photosynthetic organisms (60). Therefore, the traditional understandings of the TCA cycle should be reassessed in S. elongatus, with consideration that its importance is likely not a result of its completeness or its role as an energy generator but in its provision of a few important precursor metabolites, such as oxaloacetate and 2-oxogluterate, which likely require only short linear portions of the TCA cycle. This interpretation is compatible with the organism’s strict photosynthetic metabolism, where the degradation of carbon for energy using cyclic flux through the TCA cycle would be counterproductive at times when the organism is spending its energy to fix CO2.
Beyond Coding Sequences.
Although cyanobacterial ncRNAs have been studied extensively in silico, little is known about their individual importance in vivo. Mutants of yrf1 (nc549) have been shown to be sensitive to several stresses in the closely related S. elongatus PCC 6301 (61). Another iron stress-dependent ncRNA, IsrR (nc468), regulates photosynthesis in Synechocystis sp. PCC 6803 (62). However, none of the nonribosomal, non-tRNA ncRNAs have been shown previously to be essential for survival under standard laboratory conditions in S. elongatus. In our study, we revealed 13 likely nonribosomal, non-tRNA essential ncRNAs: 10 from the recently discovered set of S. elongatus ncRNAs (45) and 3 that were previously annotated. One is a group I intron (ncRNA136), which catalyzes its own splicing out of the surrounding tRNALeu that carries the nonredundant UAA anticodon. Because the corresponding UUA codon is found 7,908 times in the S. elongatus genome (63), the inability of the pre-tRNALeu to correctly splice when this group I intron is mutated likely explains its essentiality. Although the tRNALeu (UAA) group I introns have been well-reported in cyanobacteria (48, 49, 64–67), there has been no previous work showing their importance in vivo. The other likely essential and so far unexplored ncRNAs discovered in this study represent interesting targets for additional research.
Library Stability.
Although we examined the outgrowth of the library for genes whose loss improves growth, we found none. This finding is in contrast to other Tn-seq studies on various microbial species, in which some mutants outcompeted the rest of the library under standard laboratory conditions (5, 68). It is to be expected that, in novel environments to which a microbe has not adapted, there will be loss-of-function mutants that increase fitness (69). The lack of beneficial mutations found in this study likely speaks to the unusual culturing practice used for cyanobacteria: because inoculation from a frozen sample is a lengthy process, WT cultures are repeatedly passaged on benchtops and not inoculated from a freezer stock before each use. Thus, most S. elongatus cultures have been selected for laboratory conditions for years, and it is unsurprising that the laboratory-evolved genotype has no detrimental genes in these conditions. This caveat suggests that the strains on which experimentation is performed are no longer representative of the strains found in nature. For the purposes of the RB-TnSeq library created here, however, the absence of detrimental genes and the relatively small number of beneficial genes mean that the library loses little of its diversity over each generation (Fig. 2B). After reviving the library from frozen stocks and growing it for seven to eight generations, 93% of the mutant strains barcoded before freezing could still be found in the population. This robustness enables its use in screens under conditions of interest outside of standard laboratory conditions.
Future Uses of the Library.
Essential and beneficial genes make up only about 32% of 2,723 genes in S. elongatus. Many of the remaining genes are likely important for specific biological conditions not experienced in standard laboratory conditions. We are currently exposing the library to an array of alternative conditions to determine genes specifically important for the survival of the organism under variations, such as high osmolarity and oxidative stress. We are also probing the library with targeted conditions to elucidate specific questions in cyanobacterial biology, such as the set of genes important for resistance to amoeba and the survival of light–dark cycles. This library can additionally be used for screens of phenotypes other than fitness if mutants with the phenotype of interest can be identified from the population and sequenced separately. With the use of RB-TnSeq, every additional screen requires minimal time, library preparation, and sequencing. This process is compared with previous screening techniques in Cyanobacteria, in which thousands of mutants had to be maintained and phenotyped individually (70, 71). Finally, although we have maintained the pooled nature of the library for this study, it can be easily arrayed into individual clones when viewing the mutants under noncompetitive conditions is advantageous or when the phenotype of interest cannot be screened for in a pooled library. Using these approaches, the RB-TnSeq library, used here to delve into essentiality, will be a valuable tool for improving our understanding of S. elongatus, cyanobacteria, and photosynthetic organisms.
Materials and Methods
Strains and Culture Conditions.
The library and individual insertion mutants were constructed in WT S. elongatus PCC 7942 stored in our laboratory as AMC06. All cultures were grown at 30 °C. Liquid cultures were shaken at 150 rpm (Thermo Fisher MaxQ 2000 Orbital Shaker) and grown in 100-mL flasks unless otherwise noted.
Mutant Library Creation.
The conjugal recipient S. elongatus was inoculated and grown in BG-11 liquid medium (72) in light levels of 174–199 μmol photons·m−2·s−1 for 3 d. For the E. coli donor, we used the diaminopimelic acid (DAP) auxotrophic strain APA766 that carried the library of barcoded Tn5 elements (pKMW7) (10). The donor E. coli was grown overnight in LB broth with 60 μg/mL DAP and 50 μg/mL kanamycin. E. coli cells were washed two times to remove kanamycin and resuspended in LB. The washed E. coli were mixed with S. elongatus at a 1:1 donor cell:recipient cell ratio on 0.45 μM nitrocellulose filters (Millipore) overlaid on LB agar plates with 60 μg/mL DAP. The conjugation reaction was performed for 7 h under 100–140 μmol photons·m−2·s−1 of illumination. For selection of exconjugants, the filters were transferred to BG-11 kanamycin agar plates. To minimize E. coli contamination of the library, after 8 d of growth under 100–140 μmol photons·m−2·s−1, the colonies on the filters were stamped onto new BG-11 kanamycin agar plates by pressing the filters face down onto the new plates. After 3 more d of growth with the same illumination, we scraped and flushed the colonies into BG-11 kanamycin liquid medium. At this point, cells were collected for DNA extraction (for Tn-Seq), and the remainder was frozen at −80 °C in 1-mL aliquots after adding 80 μL DMSO.
Library Preparation and DNA Sequencing for Tn-seq.
To determine transposon insertion sites and link them to random DNA barcodes within each insertion, we created an Illumina-compatible sequencing library as described previously (10). Briefly, genomic DNA was extracted by phenol-chloroform extraction (16), sheared to 300 bp (Covaris), size-selected (Ampure SPRI), end-repaired, A-tailed, and ligated with adapters. Amplification of transposon insertions and flanking DNA was conducted using the transposon-specific primer, Nspacer_barseq_universal (ATGATACGGCGACCACCGAGATCTACACTCTTTCCCTACACGACGCTCTTCCGATCTNNNNNNGATGTCCACGAGGTCT), and the adaptor-specific primer, P7_MOD_TS_index 12 primer (CAAGCAGAAGACGGCATACGAGATTACAAGGTGACTGGAGTTCAGACGTGTGCTCTTCCGATCT) (10). For PCR, 100-μL reaction volumes were used with JumpStart Taq DNA Polymerase (Sigma) and the following thermocycler protocol: 94 °C for 2 min; 25 cycles of 94 °C for 30 s, 65 °C for 20 s, and 72 °C for 30 s; and a final extension at 72 °C for 10 min. The amplicons were then purified with AMPure XP Beads (Beckman Coulter), quantified on an Agilent Bioanalyzer with a DNA1000 Chip, and sequenced on a single lane of HiSeq2500 (Illumina) in rapid run mode.
Analysis of Tn-seq Data.
Tn-seq reads were analyzed as described previously (10). Briefly, for each sequencing read, we identified the flanking sequence around the transposon and used BLAT (73) to map it to the S. elongatus genome. The part of the sequencing read internal to the transposon was used to link each transposon’s unique barcode to its location within the genome. We identified 20,401,559 reads with insertions that mapped to the genome.
Library Outgrowths.
Two sets of outgrowth experiments were conducted to examine the library for segregation and growth under control conditions. In both cases, library aliquots were thawed in a 37 °C water bath for 2 min and diluted 1:300 into BG-11 kanamycin liquid medium. The cultures were allowed to recover at 30 μmol photons·m−2·s−1 without shaking for 1 d, moved back to standard shaking conditions, and allowed to grow for 4 d under 70 μmol photons·m−2·s−1, at which point we collected cells for DNA extraction as the time 0 point of the outgrowth.
Aliquots of this culture were reinoculated into fresh BG-11 at OD750 of 0.025. For segregation testing of the library, the culture was grown in parallel in the presence and absence of 5 μg/mL kanamycin for approximately seven generations under 199 μmol photons·m−2·s−1, at which point both cultures were sampled for DNA extraction as the end point of the outgrowth. Approximately halfway through the growth period, the culture was reinoculated into fresh BG-11 liquid at OD750 of 0.025 to prevent the culture from reaching stationary phase.
For testing growth under standard laboratory conditions, cultures were grown in four conditions: on solid BG-11 kanamycin under 116 μmol photons·m−2·s−1, in liquid BG-11 kanamycin under 199 μmol photons·m−2·s−1, in liquid BG-11 kanamycin under 60 μmol photons·m−2·s−1, and in a Phenometrics ePBR v1.1 Photobioreactor (Phenometrics Inc.) maintained at a constant OD750 of 0.1 under 500 μmol photons·m−2·s−1. All liquid cultures were collected for BarSeq after six to eight generations. The growth on solid BG-11 kanamycin was conducted by spreading 100 μL library culture, diluted to have an OD750 of 0.086, onto the agar. The colonies were collected for BarSeq after 3 d of growth. The photobioreactor was inoculated with 400 mL library culture at an OD750 of 0.05 and bubbled at 50 mL/min of 0.2-μm filtered air.
BarSeq.
To use barcodes to quantify the survival of each mutant in the population, we first isolated genomic DNA through phenol-chloroform extraction (16). The procedure for sample preparation, sequencing, and preliminary analysis was described previously (10). Briefly, amplification of the barcode was done using 1 of 96 indexed forward primers for later multiplexing, BarSeq_P2_ITXXX (CAAGCAGAAGACGGCATACGAGATXXXXXXGTGACTGGAGTTCAGACGTGTGCTCTTCCGATCTGATGTCCACGAGGTCTCT), and a common reverse primer, BarSeq_P1 (AATGATACGGCGACCACCGAGATCTACACTCTTTCCCTACACGACGCTCTTCCGATCTNNNNNGTCGACCTGCAGCGTACG). For PCR, 50-μL reaction volumes were used with Q5 DNA polymerase, Q5 GC Enhancer (New England Biolabs), and the following thermocycler conditions: 98 °C for 4 min; 25 cycles of 30 s at 98 °C, 30 s at 55 °C, and 30 s at 72 °C; and a final extension at 72 °C for 5 min. The PCR products were then combined, purified with the DNA Clean & Concentrator Kit (Zymo Research), quantified using the Qubit dsDNA HS Assay Kit (Thermo Fisher Scientific), and sequenced using Illumina HiSeq 2500. Barcodes were mapped to their previously identified positions in the genome using an R script. The fitness of each transposon mutant strain is its log2 change in abundance between the beginning of the experiment and the end:
where nend and nbegin are the read counts of the strain’s barcode from the end and the beginning of the experiment, eend and ebegin are small constants that prevent infinite fitness values, and C is a normalization constant. The fitness of each gene is the weighted average of the fitness of strains within the central 10–90% of each gene. The normalization constant is chosen so that the peak of the gene fitness values is at zero (10).
Essentiality Analysis.
Genes.
To determine gene essentiality, a normalized insertion index was created for the initial Tn-seq of the library and statistically analyzed for genes with underrepresentation of insertions. The JGI gene annotation was used for this mapping (chromosomes are stored under the GenBank accession nos. CP000100.1, CP000101.1, and S89470.1). The first step of creating the normalized insertion index was the elimination of genes from analysis that were shorter than 70 bp. The likelihood of the central 80% of a 70-bp gene having zero insertions by chance is P < 0.01 as calculated by the Poisson distribution. We used BLAT (73) to identify parts of genes that are nearly identical to other parts of the genome. Genes with any nearly identical parts were excluded from analysis. For the remaining genes, we divided the insertions in the middle 80% of each by the length of the middle 80% to create an insertion density for each gene. The insertion densities for all genes were then plotted against their GC%. A linear trend line was fitted to this plot and used to normalize gene insertion density by GC content (Fig. S3A). This normalized insertion density for each gene was given the label of insertion index. Finally, a preliminary essentiality measure was determined using an approach described previously (5). Briefly, γ-distributions were fit to the essential and nonessential peaks in insertion index, and log2 likelihood ratios were calculated from these distributions. Genes with log2 likelihood ratios below −2 were called as essential genes, and those with log2 likelihood ratios above 2 were called as nonessential genes; genes that fell between these log2 likelihood ratios were called as ambiguous. Scripts were adapted from the Bio::Tradis pipeline (github.com/sanger-pathogens/Bio-Tradis) (74).
To improve the accuracy and precision of these essentiality calls, data from the outgrowths under standard laboratory conditions were used. A t test was used to find genes that had significantly lower or higher fitness under the four control conditions (Library Outgrowths), and a false discovery rate was determined for each P value. Genes for which insertions reduced gene fitness below −1.32 (P < 0.01 and FDR < 0.1; t test) were called as beneficial. Furthermore, to make our calls of essentiality more stringent, genes that were previously called as essential but were not significantly different from the mean gene fitness from the outgrowth were added to the ambiguous group. Conversely, those genes that had previously been called as nonessential but were not present in the outgrowth were also added to the ambiguous group.
ncRNAs.
To determine essential ncRNAs, we calculated an insertion index using the same procedure as that used for previously annotated genes. We again only counted insertions in the middle 80% of ncRNAs and eliminated ncRNAs that overlapped each other. A length of 50 bp was set as the lower limit, because by using that cutoff, we would expect only one ncRNA that had zero insertions by chance as determined by the Poisson distribution. As had been done for essential genes, we again corrected for GC content (Fig. S3B) but in this case, also discarded ncRNAs with GC content below 35% because of the lower GC% of ncRNAs. We also eliminated ncRNAs that were overlapping essential, beneficial, ambiguous, or uncategorized genes, because it would be difficult to know whether essentiality of these ncRNAs was because of the ncRNAs themselves or the surrounding genes. The same cutoff for essentiality that had been applied to the gene insertion indexes was again applied to the ncRNAs. Those that fell on the essential side of this cutoff were visually examined to determine if they fell in likely essential regulatory regions or other areas of below-average insertion density. If they did not, they were categorized as likely essential ncRNAs.
Essential regulatory regions.
Essentiality of the region upstream of the translation start site was determined for essential genes using the distance upstream of the start site for which there was no transposon mutants and no upstream gene. The minimum uninterrupted region necessary to be considered as a likely essential regulatory region was determined to be 40 bp, because a Poisson distribution predicted only one false positive using this cutoff.
Targeted Mutants: Transformation, Genotyping, and Growth Assays.
Plasmids for targeted insertional mutation were taken from the unigene set, an existing insertion mutant library for S. elongatus (70, 75). Transformation of S. elongatus was achieved using standard protocols (16). Genotyping was done using colony PCR with Taq DNA Polymerase (NEB). Growth assays were done in liquid culture under 199 μmol photons·m−2·s−1 of illumination.
Supplementary Material
Acknowledgments
We thank B. Irvine for his input into metrics for essentiality; Drs. R. Simkovsky and A. Taton for thoughtful advice on experimental design and data analysis; A. Pal for assistance in conjugating the library; Drs. J. Bristow and L. Pennacchio for ideas and assistance at the conception of the project; Dr. D. Welkie for edits; and Dr. R. Steuer for consultation on the TCA cycle figure. This research was supported by National Science Foundation Grant MCB1244108 (to S.S.G.) and NIH Cell and Molecular Genetics Training Grant T32GM00724. BarSeq mutant fitness data were supported by Laboratory-Directed Research and Development Funding from Lawrence Berkeley National Laboratory provided by the Director, Office of Science of the US Department of Energy Contract DE-AC02-05CH11231 and a Community Science Project from the Joint Genome Institute (to A.P.A. and A.D.). The work conducted by the US Department of Energy Joint Genome Institute, a Department of Energy Office of Science User Facility, is supported by Office of Science of the US Department of Energy Contract DE-AC02-05CH11231.
Footnotes
The authors declare no conflict of interest.
See Commentary on page 14747.
This article contains supporting information online at www.pnas.org/lookup/suppl/doi:10.1073/pnas.1519220112/-/DCSupplemental.
References
- 1.Juhas M, Eberl L, Glass JI. Essence of life: Essential genes of minimal genomes. Trends Cell Biol. 2011;21(10):562–568. doi: 10.1016/j.tcb.2011.07.005. [DOI] [PubMed] [Google Scholar]
- 2.Hutchison CA, et al. Global transposon mutagenesis and a minimal Mycoplasma genome. Science. 1999;286(5447):2165–2169. doi: 10.1126/science.286.5447.2165. [DOI] [PubMed] [Google Scholar]
- 3.Glass JI, et al. Essential genes of a minimal bacterium. Proc Natl Acad Sci USA. 2006;103(2):425–430. doi: 10.1073/pnas.0510013103. [DOI] [PMC free article] [PubMed] [Google Scholar]
- 4.van Opijnen T, Bodi KL, Camilli A. Tn-seq: High-throughput parallel sequencing for fitness and genetic interaction studies in microorganisms. Nat Methods. 2009;6(10):767–772. doi: 10.1038/nmeth.1377. [DOI] [PMC free article] [PubMed] [Google Scholar]
- 5.Langridge GC, et al. Simultaneous assay of every Salmonella Typhi gene using one million transposon mutants. Genome Res. 2009;19(12):2308–2316. doi: 10.1101/gr.097097.109. [DOI] [PMC free article] [PubMed] [Google Scholar]
- 6.Gawronski JD, Wong SMS, Giannoukos G, Ward DV, Akerley BJ. Tracking insertion mutants within libraries by deep sequencing and a genome-wide screen for Haemophilus genes required in the lung. Proc Natl Acad Sci USA. 2009;106(38):16422–16427. doi: 10.1073/pnas.0906627106. [DOI] [PMC free article] [PubMed] [Google Scholar]
- 7.Goodman AL, Wu M, Gordon JI. Identifying microbial fitness determinants by insertion sequencing using genome-wide transposon mutant libraries. Nat Protoc. 2011;6(12):1969–1980. doi: 10.1038/nprot.2011.417. [DOI] [PMC free article] [PubMed] [Google Scholar]
- 8.Christen B, et al. The essential genome of a bacterium. Mol Syst Biol. 2011;7(1):528. doi: 10.1038/msb.2011.58. [DOI] [PMC free article] [PubMed] [Google Scholar]
- 9.Luo H, Lin Y, Gao F, Zhang CT, Zhang R. DEG 10, an update of the database of essential genes that includes both protein-coding genes and noncoding genomic elements. Nucleic Acids Res. 2014;42(Database issue):D574–D580. doi: 10.1093/nar/gkt1131. [DOI] [PMC free article] [PubMed] [Google Scholar]
- 10.Wetmore KM, et al. Rapid quantification of mutant fitness in diverse bacteria by sequencing randomly bar-coded transposons. mBio. 2015;6(3):e00306-15. doi: 10.1128/mBio.00306-15. [DOI] [PMC free article] [PubMed] [Google Scholar]
- 11.Lloyd J, Meinke D. A comprehensive dataset of genes with a loss-of-function mutant phenotype in Arabidopsis. Plant Physiol. 2012;158(3):1115–1129. doi: 10.1104/pp.111.192393. [DOI] [PMC free article] [PubMed] [Google Scholar]
- 12.Zhang R, et al. High-throughput genotyping of green algal mutants reveals random distribution of mutagenic insertion sites and endonucleolytic cleavage of transforming DNA. Plant Cell. 2014;26(4):1398–1409. doi: 10.1105/tpc.114.124099. [DOI] [PMC free article] [PubMed] [Google Scholar]
- 13.Merchant SS, et al. The Chlamydomonas genome reveals the evolution of key animal and plant functions. Science. 2007;318(5848):245–250. doi: 10.1126/science.1143609. [DOI] [PMC free article] [PubMed] [Google Scholar]
- 14.Zouni A, et al. Crystal structure of photosystem II from Synechococcus elongatus at 3.8 A resolution. Nature. 2001;409(6821):739–743. doi: 10.1038/35055589. [DOI] [PubMed] [Google Scholar]
- 15.Jordan P, et al. Three-dimensional structure of cyanobacterial photosystem I at 2.5 A resolution. Nature. 2001;411(6840):909–917. doi: 10.1038/35082000. [DOI] [PubMed] [Google Scholar]
- 16.Clerico EM, Ditty JL, Golden SS. Specialized techniques for site-directed mutagenesis in cyanobacteria. Methods Mol Biol. 2007;362(2007):155–171. doi: 10.1007/978-1-59745-257-1_11. [DOI] [PubMed] [Google Scholar]
- 17.Angermayr SA, Gorchs Rovira A, Hellingwerf KJ. Metabolic engineering of cyanobacteria for the synthesis of commodity products. Trends Biotechnol. 2015;33(6):352–361. doi: 10.1016/j.tibtech.2015.03.009. [DOI] [PubMed] [Google Scholar]
- 18.Smith AM, et al. Highly-multiplexed barcode sequencing: An efficient method for parallel analysis of pooled samples. Nucleic Acids Res. 2010;38(13):e142. doi: 10.1093/nar/gkq368. [DOI] [PMC free article] [PubMed] [Google Scholar]
- 19.Andersson CR, et al. Application of bioluminescence to the study of circadian rhythms in cyanobacteria. Methods Enzymol. 2000;305:527–542. doi: 10.1016/s0076-6879(00)05511-7. [DOI] [PubMed] [Google Scholar]
- 20.Griese M, Lange C, Soppa J. Ploidy in cyanobacteria. FEMS Microbiol Lett. 2011;323(2):124–131. doi: 10.1111/j.1574-6968.2011.02368.x. [DOI] [PubMed] [Google Scholar]
- 21.Chen AH, Afonso B, Silver PA, Savage DF. Spatial and temporal organization of chromosome duplication and segregation in the cyanobacterium Synechococcus elongatus PCC 7942. PLoS One. 2012;7(10):e47837. doi: 10.1371/journal.pone.0047837. [DOI] [PMC free article] [PubMed] [Google Scholar]
- 22.Sarmiento F, Mrázek J, Whitman WB. Genome-scale analysis of gene function in the hydrogenotrophic methanogenic archaeon Methanococcus maripaludis. Proc Natl Acad Sci USA. 2013;110(12):4726–4731. doi: 10.1073/pnas.1220225110. [DOI] [PMC free article] [PubMed] [Google Scholar]
- 23.Chao MC, et al. High-resolution definition of the Vibrio cholerae essential gene set with hidden Markov model-based analyses of transposon-insertion sequencing data. Nucleic Acids Res. 2013;41(19):9033–9048. doi: 10.1093/nar/gkt654. [DOI] [PMC free article] [PubMed] [Google Scholar]
- 24.Crooks GE, Hon G, Chandonia J-M, Brenner SE. WebLogo: A sequence logo generator. Genome Res. 2004;14(6):1188–1190. doi: 10.1101/gr.849004. [DOI] [PMC free article] [PubMed] [Google Scholar]
- 25.Griffin JE, et al. High-resolution phenotypic profiling defines genes essential for mycobacterial growth and cholesterol catabolism. PLoS Pathog. 2011;7(9):e1002251. doi: 10.1371/journal.ppat.1002251. [DOI] [PMC free article] [PubMed] [Google Scholar]
- 26.Shi T, Falkowski PG. Genome evolution in cyanobacteria: The stable core and the variable shell. Proc Natl Acad Sci USA. 2008;105(7):2510–2515. doi: 10.1073/pnas.0711165105. [DOI] [PMC free article] [PubMed] [Google Scholar]
- 27.Simm S, Keller M, Selymesi M, Schleiff E. The composition of the global and feature specific cyanobacterial core-genomes. Front Microbiol. 2015;6:219. doi: 10.3389/fmicb.2015.00219. [DOI] [PMC free article] [PubMed] [Google Scholar]
- 28.Beck C, Knoop H, Axmann IM, Steuer R. The diversity of cyanobacterial metabolism: Genome analysis of multiple phototrophic microorganisms. BMC Genomics. 2012;13(1):56. doi: 10.1186/1471-2164-13-56. [DOI] [PMC free article] [PubMed] [Google Scholar]
- 29.Baba T, et al. Construction of Escherichia coli K-12 in-frame, single-gene knockout mutants: The Keio collection. Mol Syst Biol. 2006;2(2006):2006.0008. doi: 10.1038/msb4100050. [DOI] [PMC free article] [PubMed] [Google Scholar]
- 30.Karpowicz SJ, Prochnik SE, Grossman AR, Merchant SS. The GreenCut2 resource, a phylogenomically derived inventory of proteins specific to the plant lineage. J Biol Chem. 2011;286(24):21427–21439. doi: 10.1074/jbc.M111.233734. [DOI] [PMC free article] [PubMed] [Google Scholar]
- 31.Caspi R, et al. The MetaCyc database of metabolic pathways and enzymes and the BioCyc collection of Pathway/Genome Databases. Nucleic Acids Res. 2014;42(Database issue):D459–D471. doi: 10.1093/nar/gkt1103. [DOI] [PMC free article] [PubMed] [Google Scholar]
- 32.Scanlan DJ, Sundaram S, Newman J, Mann NH, Carr NG. Characterization of a zwf mutant of Synechococcus sp. strain PCC 7942. J Bacteriol. 1995;177(9):2550–2553. doi: 10.1128/jb.177.9.2550-2553.1995. [DOI] [PMC free article] [PubMed] [Google Scholar]
- 33.Broedel SE, Jr, Wolf RE., Jr Genetic tagging, cloning, and DNA sequence of the Synechococcus sp. strain PCC 7942 gene (gnd) encoding 6-phosphogluconate dehydrogenase. J Bacteriol. 1990;172(7):4023–4031. doi: 10.1128/jb.172.7.4023-4031.1990. [DOI] [PMC free article] [PubMed] [Google Scholar]
- 34.Knoop H, Zilliges Y, Lockau W, Steuer R. The metabolic network of Synechocystis sp. PCC 6803: Systemic properties of autotrophic growth. Plant Physiol. 2010;154(1):410–422. doi: 10.1104/pp.110.157198. [DOI] [PMC free article] [PubMed] [Google Scholar]
- 35.Rae BD, Long BM, Badger MR, Price GD. Structural determinants of the outer shell of β-carboxysomes in Synechococcus elongatus PCC 7942: Roles for CcmK2, K3-K4, CcmO, and CcmL. PLoS One. 2012;7(8):e43871. doi: 10.1371/journal.pone.0043871. [DOI] [PMC free article] [PubMed] [Google Scholar]
- 36.Golden SS, Brusslan J, Haselkorn R. Expression of a family of psbA genes encoding a photosystem II polypeptide in the cyanobacterium Anacystis nidulans R2. EMBO J. 1986;5(11):2789–2798. doi: 10.1002/j.1460-2075.1986.tb04569.x. [DOI] [PMC free article] [PubMed] [Google Scholar]
- 37.Bustos SA, Golden SS. Expression of the psbDII gene in Synechococcus sp. strain PCC 7942 requires sequences downstream of the transcription start site. J Bacteriol. 1991;173(23):7525–7533. doi: 10.1128/jb.173.23.7525-7533.1991. [DOI] [PMC free article] [PubMed] [Google Scholar]
- 38.Pakrasi HB, Williams JG, Arntzen CJ. Targeted mutagenesis of the psbE and psbF genes blocks photosynthetic electron transport: Evidence for a functional role of cytochrome b559 in photosystem II. EMBO J. 1988;7(2):325–332. doi: 10.1002/j.1460-2075.1988.tb02816.x. [DOI] [PMC free article] [PubMed] [Google Scholar]
- 39.Eaton-Rye JJ, Vermaas WF. Oligonucleotide-directed mutagenesis of psbB, the gene encoding CP47, employing a deletion mutant strain of the cyanobacterium Synechocystis sp. PCC 6803. Plant Mol Biol. 1991;17(6):1165–1177. doi: 10.1007/BF00028733. [DOI] [PubMed] [Google Scholar]
- 40.Carpenter SD, Charite J, Eggers B, Vermaas WF. The psbC start codon in Synechocystis sp. PCC 6803. FEBS Lett. 1990;260(1):135–137. doi: 10.1016/0014-5793(90)80085-w. [DOI] [PubMed] [Google Scholar]
- 41.Schneider D, Volkmer T, Rögner M. PetG and PetN, but not PetL, are essential subunits of the cytochrome b6f complex from Synechocystis PCC 6803. Res Microbiol. 2007;158(1):45–50. doi: 10.1016/j.resmic.2006.10.002. [DOI] [PubMed] [Google Scholar]
- 42.Brown S, Fournier MJ. The 4.5 S RNA gene of Escherichia coli is essential for cell growth. J Mol Biol. 1984;178(3):533–550. doi: 10.1016/0022-2836(84)90237-7. [DOI] [PubMed] [Google Scholar]
- 43.Waugh DS, Pace NR. Complementation of an RNase P RNA (rnpB) gene deletion in Escherichia coli by homologous genes from distantly related eubacteria. J Bacteriol. 1990;172(11):6316–6322. doi: 10.1128/jb.172.11.6316-6322.1990. [DOI] [PMC free article] [PubMed] [Google Scholar]
- 44.Karzai AW, Roche ED, Sauer RT. The SsrA-SmpB system for protein tagging, directed degradation and ribosome rescue. Nat Struct Biol. 2000;7(6):449–455. doi: 10.1038/75843. [DOI] [PubMed] [Google Scholar]
- 45.Vijayan V, Jain IH, O’Shea EK. A high resolution map of a cyanobacterial transcriptome. Genome Biol. 2011;12(5):R47. doi: 10.1186/gb-2011-12-5-r47. [DOI] [PMC free article] [PubMed] [Google Scholar]
- 46.Nawrocki EP, et al. Rfam 12.0: Updates to the RNA families database. Nucleic Acids Res. 2015;43(Database issue):D130–D137. doi: 10.1093/nar/gku1063. [DOI] [PMC free article] [PubMed] [Google Scholar]
- 47.Xu MQ, Kathe SD, Goodrich-Blair H, Nierzwicki-Bauer SA, Shub DA. Bacterial origin of a chloroplast intron: Conserved self-splicing group I introns in cyanobacteria. Science. 1990;250(4987):1566–1570. doi: 10.1126/science.2125747. [DOI] [PubMed] [Google Scholar]
- 48.Kuhsel MG, Strickland R, Palmer JD. An ancient group I intron shared by eubacteria and chloroplasts. Science. 1990;250(4987):1570–1573. doi: 10.1126/science.2125748. [DOI] [PubMed] [Google Scholar]
- 49.Sugita M, et al. Genes encoding the group I intron-containing tRNA(Leu) and subunit L of NADH dehydrogenase from the cyanobacterium Synechococcus PCC 6301. DNA Res. 1995;2(2):71–76. doi: 10.1093/dnares/2.2.71. [DOI] [PubMed] [Google Scholar]
- 50.Lowe TM, Eddy SR. tRNAscan-SE: A program for improved detection of transfer RNA genes in genomic sequence. Nucleic Acids Res. 1997;25(5):955–964. doi: 10.1093/nar/25.5.955. [DOI] [PMC free article] [PubMed] [Google Scholar]
- 51.Shultzaberger RK, Bucheimer RE, Rudd KE, Schneider TD. Anatomy of Escherichia coli ribosome binding sites. J Mol Biol. 2001;313(1):215–228. doi: 10.1006/jmbi.2001.5040. [DOI] [PubMed] [Google Scholar]
- 52.Shultzaberger RK, Chen Z, Lewis KA, Schneider TD. Anatomy of Escherichia coli sigma70 promoters. Nucleic Acids Res. 2007;35(3):771–788. doi: 10.1093/nar/gkl956. [DOI] [PMC free article] [PubMed] [Google Scholar]
- 53.Smith AJ, London J, Stanier RY. Biochemical basis of obligate autotrophy in blue-green algae and thiobacilli. J Bacteriol. 1967;94(4):972–983. doi: 10.1128/jb.94.4.972-983.1967. [DOI] [PMC free article] [PubMed] [Google Scholar]
- 54.Pearce J, Leach CK, Carr NG. The incomplete tricarboxylic acid cycle in the blue-green alga Anabaena variabilis. J Gen Microbiol. 1969;55(3):371–378. doi: 10.1099/00221287-55-3-371. [DOI] [PubMed] [Google Scholar]
- 55.Zhang S, Bryant DA. The tricarboxylic acid cycle in cyanobacteria. Science. 2011;334(6062):1551–1553. doi: 10.1126/science.1210858. [DOI] [PubMed] [Google Scholar]
- 56.Xiong W, Brune D, Vermaas WFJ. The γ-aminobutyric acid shunt contributes to closing the tricarboxylic acid cycle in Synechocystis sp. PCC 6803. Mol Microbiol. 2014;93(4):786–796. doi: 10.1111/mmi.12699. [DOI] [PubMed] [Google Scholar]
- 57.Zhang S, Bryant DA. Biochemical validation of the glyoxylate cycle in the cyanobacterium Chlorogloeopsis fritschii Strain PCC 9212. J Biol Chem. 2015;290(22):14019–14030. doi: 10.1074/jbc.M115.648170. [DOI] [PMC free article] [PubMed] [Google Scholar]
- 58.Knoop H, et al. Flux balance analysis of cyanobacterial metabolism: The metabolic network of Synechocystis sp. PCC 6803. PLOS Comput Biol. 2013;9(6):e1003081. doi: 10.1371/journal.pcbi.1003081. [DOI] [PMC free article] [PubMed] [Google Scholar]
- 59.Wood AP, Aurikko JP, Kelly DP. A challenge for 21st century molecular biology and biochemistry: What are the causes of obligate autotrophy and methanotrophy? FEMS Microbiol Rev. 2004;28(3):335–352. doi: 10.1016/j.femsre.2003.12.001. [DOI] [PubMed] [Google Scholar]
- 60.Oborník M, Green BR. Mosaic origin of the heme biosynthesis pathway in photosynthetic eukaryotes. Mol Biol Evol. 2005;22(12):2343–2353. doi: 10.1093/molbev/msi230. [DOI] [PubMed] [Google Scholar]
- 61.Nakamura T, Naito K, Yokota N, Sugita C, Sugita M. A cyanobacterial non-coding RNA, Yfr1, is required for growth under multiple stress conditions. Plant Cell Physiol. 2007;48(9):1309–1318. doi: 10.1093/pcp/pcm098. [DOI] [PubMed] [Google Scholar]
- 62.Dühring U, Axmann IM, Hess WR, Wilde A. An internal antisense RNA regulates expression of the photosynthesis gene isiA. Proc Natl Acad Sci USA. 2006;103(18):7054–7058. doi: 10.1073/pnas.0600927103. [DOI] [PMC free article] [PubMed] [Google Scholar]
- 63.Nakamura Y, Gojobori T, Ikemura T. Codon usage tabulated from international DNA sequence databases: Status for the year 2000. Nucleic Acids Res. 2000;28(1):292. doi: 10.1093/nar/28.1.292. [DOI] [PMC free article] [PubMed] [Google Scholar]
- 64.Paquin B, Kathe SD, Nierzwicki-Bauer SA, Shub DA. Origin and evolution of group I introns in cyanobacterial tRNA genes. J Bacteriol. 1997;179(21):6798–6806. doi: 10.1128/jb.179.21.6798-6806.1997. [DOI] [PMC free article] [PubMed] [Google Scholar]
- 65.Rudi K, Jakobsen KS. Complex evolutionary patterns of tRNA Leu(UAA) group I introns in the cyanobacterial radiation [corrected] J Bacteriol. 1999;181(11):3445–3451. doi: 10.1128/jb.181.11.3445-3451.1999. [DOI] [PMC free article] [PubMed] [Google Scholar]
- 66.Axmann IM, Hertel S, Wiegard A, Dörrich AK, Wilde A. Diversity of KaiC-based timing systems in marine Cyanobacteria. Mar Genomics. 2014;14:3–16. doi: 10.1016/j.margen.2013.12.006. [DOI] [PubMed] [Google Scholar]
- 67.Costa J-L, Paulsrud P, Lindblad P. The cyanobacterial tRNA(Leu) (UAA) intron: Evolutionary patterns in a genetic marker. Mol Biol Evol. 2002;19(6):850–857. doi: 10.1093/oxfordjournals.molbev.a004142. [DOI] [PubMed] [Google Scholar]
- 68.Deutschbauer A, et al. Towards an informative mutant phenotype for every bacterial gene. J Bacteriol. 2014;196(20):3643–3655. doi: 10.1128/JB.01836-14. [DOI] [PMC free article] [PubMed] [Google Scholar]
- 69.Hottes AK, et al. Bacterial adaptation through loss of function. PLoS Genet. 2013;9(7):e1003617. doi: 10.1371/journal.pgen.1003617. [DOI] [PMC free article] [PubMed] [Google Scholar]
- 70.Chen Y, Holtman CK, Taton A, Golden SS. In: Functional Analysis of the Synechococcus elongatus PCC 7942 Genome. Functional Genomics and Evolution of Photosynthetic Systems, Advances in Photosynthesis and Respiration. Burnap R, Vermaas W, editors. Springer; Dordrecht, The Netherlands: 2012. pp. 119–137. [Google Scholar]
- 71.Simkovsky R, et al. Impairment of O-antigen production confers resistance to grazing in a model amoeba-cyanobacterium predator-prey system. Proc Natl Acad Sci USA. 2012;109(41):16678–16683. doi: 10.1073/pnas.1214904109. [DOI] [PMC free article] [PubMed] [Google Scholar]
- 72.Allen MM. Simple conditions for growth of unicellular blue‐green algae on plates. J Phycol. 1968;4(1):1–4. doi: 10.1111/j.1529-8817.1968.tb04667.x. [DOI] [PubMed] [Google Scholar]
- 73.Kent WJ. BLAT--the BLAST-like alignment tool. Genome Res. 2002;12(4):656–664. doi: 10.1101/gr.229202. [DOI] [PMC free article] [PubMed] [Google Scholar]
- 74.Barquist L, et al. A comparison of dense transposon insertion libraries in the Salmonella serovars Typhi and Typhimurium. Nucleic Acids Res. 2013;41(8):4549–4564. doi: 10.1093/nar/gkt148. [DOI] [PMC free article] [PubMed] [Google Scholar]
- 75.Holtman CK, et al. High-throughput functional analysis of the Synechococcus elongatus PCC 7942 genome. DNA Res. 2005;12(2):103–115. doi: 10.1093/dnares/12.2.103. [DOI] [PubMed] [Google Scholar]
Associated Data
This section collects any data citations, data availability statements, or supplementary materials included in this article.