Significance
We preformed high-pressure structural studies of CrAs to understand the physical mechanism of its pressure-induced superconductivity. It was found that the lattice parameters a and c both demonstrate a nonmonotonic change, and the lattice parameter b undergoes a rapid contraction at ∼0.18–0.35 GPa, which suggests that a pressure-induced isostructural phase transition occurs in CrAs. Above the phase transition pressure, the axial compressibilities of CrAs present remarkable anisotropy. The pressure-related structural changes occurred concurrently with the appearance of bulk superconductivity, shedding light on the structural and related electronic responses to high pressure, which play a key role toward understanding the superconductivity of CrAs.
Keywords: CrAs, anisotropic compression behavior, high pressure, phase transformation
Abstract
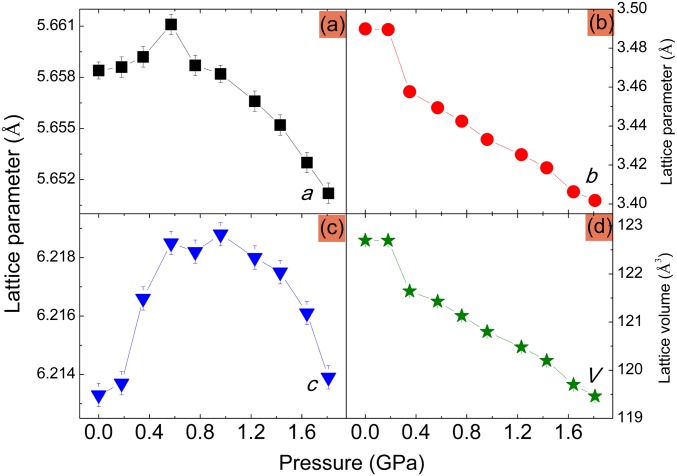
CrAs was observed to possess the bulk superconductivity under high-pressure conditions. To understand the superconducting mechanism and explore the correlation between the structure and superconductivity, the high-pressure structural evolution of CrAs was investigated using the angle-dispersive X-ray diffraction (XRD) method. The structure of CrAs remains stable up to 1.8 GPa, whereas the lattice parameters exhibit anomalous compression behaviors. With increasing pressure, the lattice parameters a and c both demonstrate a nonmonotonic change, and the lattice parameter b undergoes a rapid contraction at ∼0.18−0.35 GPa, which suggests that a pressure-induced isostructural phase transition occurs in CrAs. Above the phase transition pressure, the axial compressibilities of CrAs present remarkable anisotropy. A schematic band model was used to address the anomalous compression behavior of CrAs. The present results shed light on the structural and related electronic responses to high pressure, which play a key role toward understanding the superconductivity of CrAs.
The discovery of superconductivity (Tc = 26 K) in ZrCuSiAs-type LaFeAs(O1−xFx) (1) inspired extensively experimental and theoretical research on the quaternary “1111” compounds RFeAsO, where R represents a lanthanide (La, Ce, Nd, etc.) (2–5). From the point of view of crystallography, the newly discovered iron-based superconductor exhibits a quasi-2D structural character at ambient conditions. Like the CuO2 plane in copper oxide high-temperature superconductors, the Fe2As2 layers serve as the conduction planes for charge carriers, and the other building blocks are the charge reservoir layers, dominating the carrier density or the chemical potential. The fundamental structural factors of these compounds are of scientific interest as a meaning of achieving a higher superconducting transition temperature. Previous investigation suggests that the symmetry of the tetrahedral FeAs4 (6), the FeAs interlayer spacing (7), and the anion (such as As) heights from the iron layer (8, 9) are all crucial aspects of the structure. The FeAs planes in binary transition metal monoarsenides (TAs) may serve an analogous role to that served by the CuO plane as a structural proxy for the layered cuprate perovskite family of compounds. These considerations may shed light on the exploration of novel superconductors (10, 11). Moreover, CrAs, in which low-lying states near the Fermi level are dominated by 3d electrons, was found to exhibit superconductivity on the verge of antiferromagnetic order via the application of an external high pressure (10).
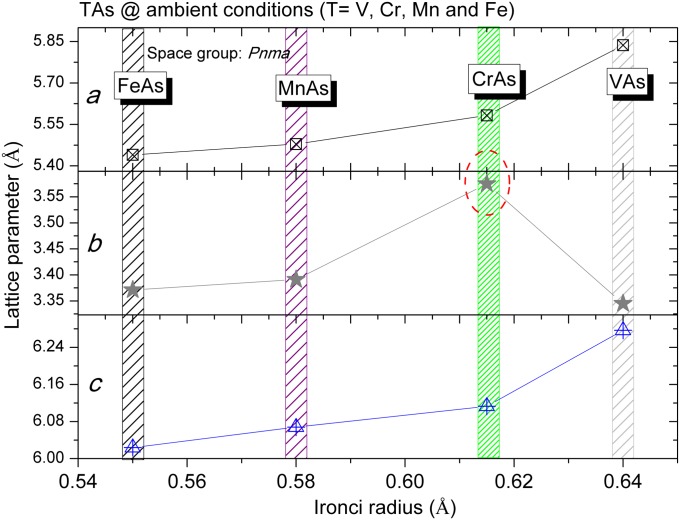
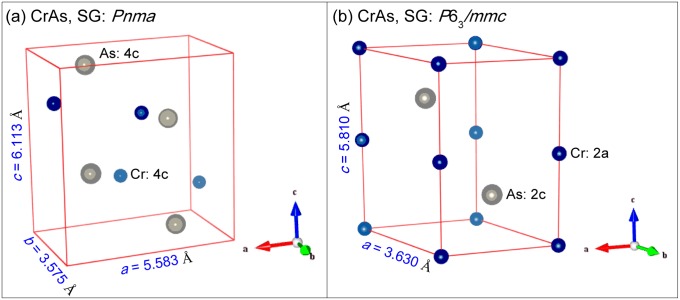
Transition-metal–based monoarsenides such as CrAs and MnAs have been extensively studied during the past decades mainly due to their complex magnetism and magnetocaloric effects (12, 13). Furthermore, antiferromagnetic order in FeAs was observed below 70 K (14), whereas the discovery of iron-arsenide–based superconductors has renewed interest in FeAs. From a crystallographic viewpoint, CrAs is isostructural with MnAs, FeAs, and VAs, which implies that novel physical properties may originate from the above structural characteristics. The lattice parameter b (space group with Pnma setting) of CrAs is the largest among transition-metal–based monoarsenides at ambient conditions, as shown in Fig. S1. CrAs crystallizes into a MnP-type structure (a = 5.6411 Å, b = 3.4797 Å, and c = 6.1959 Å), as shown in Fig. S2A at ambient conditions. Neutron diffraction studies of CrAs showed that it is a double-helical–type antiferromagnet with a Néel temperature (TN) of ∼260 K (15). The first-order magnetic transition of CrAs at TN is accompanied by discontinuous changes of the lattice parameters. The most dramatic change is a sudden expansion of the lattice parameter b by ∼4% below TN (16). In our previous study (17), high-quality single-crystal CrAs was grown successfully using the Sn flux method. A clear magnetic transition was observed along with a sharp drop of the susceptibility and the resistivity as well at about 270 K. Whereas investigation of the temperature-dependent resistivity, ρ(T), of CrAs showed that superconductivity did not appear even down to 350 mK at ambient pressure, it is interesting that high pressure has been found to drive the resistivity drop progressively toward higher temperatures with increasing pressure inside a diamond anvil cell, and, ultimately, the occurrence of superconductivity was observed near 1 K at a pressure of ∼0.3 GPa (10).
Fig. S1.
Lattice parameters of TAs (T = V, Cr, Mn, and Fe) at ambient conditions as a function of the ionic radius.
Fig. S2.
Crystallographic polymorphisms of CrAs at various temperatures and ambient pressure. (A) The orthorhombic structure with space group Pnma. (B) The hexagonal structure with space group P63/mmc.
As mentioned above, the application of high pressure has been verified as an effective approach to induce unconventional superconductivity. The pressure dependence of TN for CrAs has also been investigated by Keller et al. (18), where TN was observed to decrease with increasing pressure (18, 19). Measurement of the electrical conductivity of CrAs at 4.2−350 K under high pressure up to 0.9 GPa was performed by Zavadskii and Sibarova (20). It was shown that CrAs exhibits metallic conductivity over the entire range of pressure and temperature considered. Recently, Shen et al. investigated the structural and magnetic phase diagram of CrAs as a function of the temperature and pressure (21). The experimental results indicated that a spin reorientation was induced above the critical pressure (∼0.6 GPa). To our knowledge, most of the studies reported focused on investigation of the chemical doping, temperature, or pressure effect on the structural phase transitions or on the magnetic and electrical properties of CrAs. The crystal structure of CrAs under high pressure has not been well studied, and therefore the correlation between the physical properties and crystal structure of CrAs has not yet been well understood. For example, the mechanism whereby the lattice parameters of CrAs show a juncture at TN is still not fully understood. Therefore, it is essential to understand the relation between the structure and the properties of CrAs under compression. For this purpose, an in situ high-pressure X-ray diffraction (XRD) investigation of CrAs is undertaken in the present study using the angle-dispersive XRD technique with very fine pressure steps. It was found that the lattice parameters present anomalous compression behaviors under high pressure, which was interpreted using a schematic band model. The structural evolution was consistent with superconducting behavior under high pressure, providing crystallographic evidence for an enhanced appreciation of the physical mechanism.
Results and Discussion
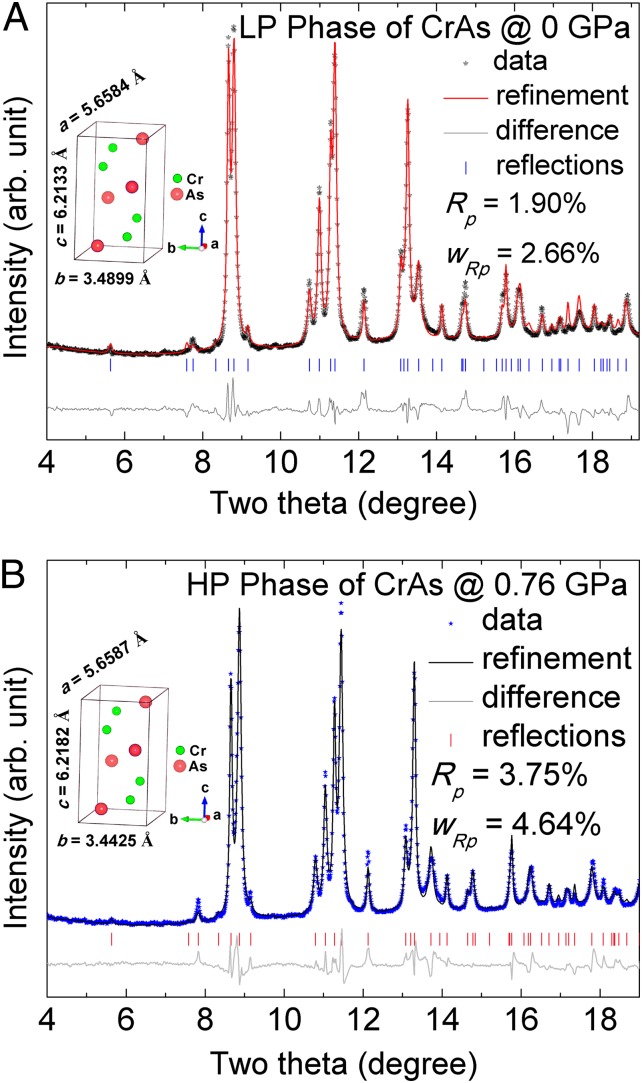
Fig. 1A shows the XRD pattern of CrAs at ambient conditions with refinement based on a previously reported model (14). The tick marks below the diffraction pattern indicate the locations of the calculated diffraction peaks in the plot. The residual difference between the calculated and the experimental patterns is shown at the bottom of the plot. The good refinement confirmed that the crystal structure of CrAs at ambient conditions is Pnma, as shown in Fig. 1A, Inset. The detailed refinement results were shown in Table S1.
Fig. 1.
Refinement of AD-XRD data of CrAs at ambient conditions (A) and 0.76 GPa (B). Measured (dots) and calculated (solid lines) patterns are shown, together with the difference curve (gray lines) and calculated positions of Bragg reflections (tick marks).
Table S1.
Crystal structure refinement parameters of CrAs
| Pressure, GPa | 0 |
| Crystal system | Orthorhombic |
| Space group | Pnma |
| Cell parameters, Å | a = 5.6584 |
| b = 3.4899 | |
| c = 6.2133 | |
| Volume, Å3 | 122.696 |
| Wyckoff position | Cr (4c), As (4c) |
| Atomic parameters | Cr (0.009, 0.25, 0.207) |
| As (0.203, 0.25, 0.580) | |
| Agreement factor | Rp = 1.90%, Rwp = 2.66% |
| Pressure, GPa | 0.76 |
| Crystal system | Orthorhombic |
| Space group | Pnma |
| Cell parameters, Å | a = 5.6587 |
| b = 3.4425 | |
| c = 6.2182 | |
| Volume, Å3 | 121.13 |
| Wyckoff position | Cr (4c), As (4c) |
| Atomic parameters | Cr (0.009, 0.25, 0.206) |
| As (0.201, 0.25, 0.579) | |
| Agreement factor | Rp = 3.75%, Rwp = 4.64% |
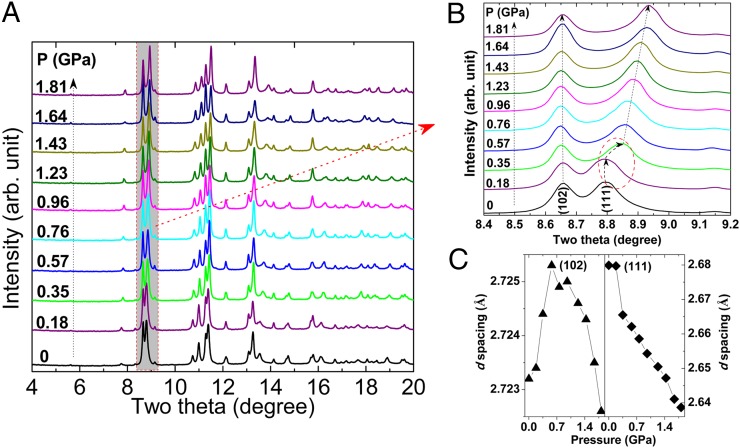
Fig. 2A presents selected patterns of the angle-dispersive XRD results of CrAs under various pressures. The sample was pressurized in small steps of ∼0.1 GPa. At first glance, it can be clearly observed in the figure that the Bragg peaks shift toward higher angles owing to lattice contraction without any modification to the overall peak patterns, and no new diffraction peaks were observed in the XRD patterns up to a pressure of 1.81 GPa, except for an apparent separation of the diffraction peaks. To obtain further insight into the effect of the pressure on the structure of CrAs, the local diffraction peaks are magnified in the plot shown in Fig. 2B. The d spacing of the (102) and (111) planes as a function of pressure are shown in Fig. 2C. As seen from Fig. 2 B and C, the d spacing of (102) exhibits an initial increase followed by a decrease with increasing pressure. The d spacing of (111) decreases as the pressure increases, for which a sharp contraction occurred at a pressure of ∼0.18−0.35 GPa. The above behavior can be attributed to the appearance of a pressure-induced isostructural phase transition. Fig. 1B shows the General Structure Analysis System (GSAS) refinement of the XRD pattern of CrAs at 0.76 GPa. The good refinement as shown in Table S1 indicated that the structural symmetry of CrAs at the pressure is the same as that of ambient conditions, confirming the occurrence of pressure-induced isostructural transition.
Fig. 2.
(A) Selected patterns of the AD-XRD results of CrAs under various pressures. (B) Local diffraction peaks magnified to highlight the pressure dependence. (C) Selected d spacing as a function of pressure for CrAs.
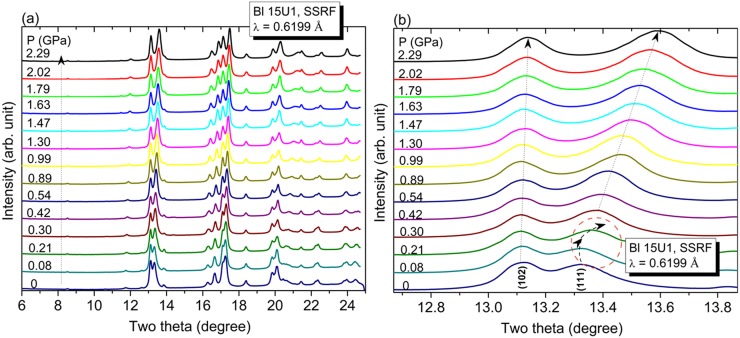
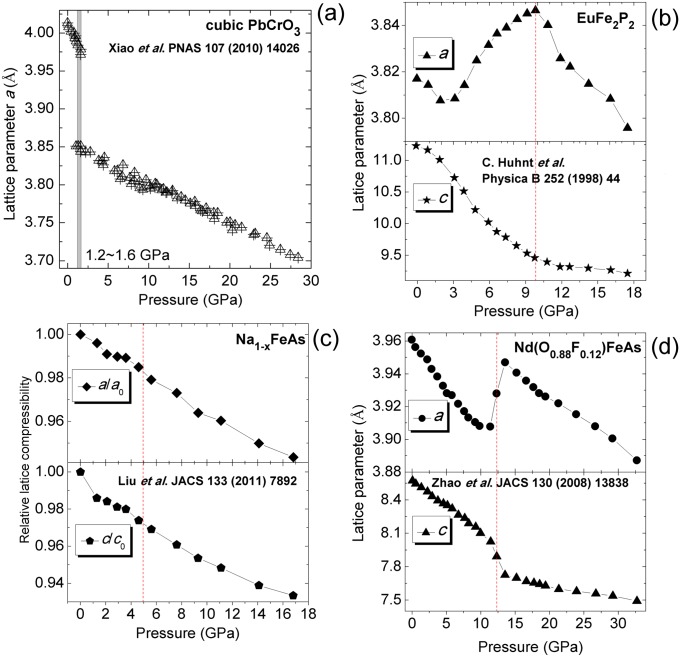
GSAS refinements of the XRD patterns for CrAs at different pressures permit us to obtain the pressure dependences of the lattice parameters, which are shown in Fig. 3. In most cases, the lattice parameters of crystals decrease with increasing pressure. However, Fig. 3 A and C indicates that the lattice parameters a and c increase with increasing pressure, while the lattice parameter b undergoes a significant contraction. It should be noted that anomaly of lattice parameters a, b, and c occurred at a similar pressure range (0.18−0.35 GPa) as that of the appearance of pressure-induced superconductivity in CrAs. The lattice volume of the Pnma phase of CrAs is given by the product of the three lattice parameters a, b, and c. The subtle increase in the lattice parameters a and c coupled with the rapid shortening of lattice parameter b results in a decreasing lattice volume under an external applied pressure. This is consistent with the compression law, which establishes that it is thermodynamically impossible for a closed system to have a negative volumetric compressibility (22). The changing trend of the unit cell volume is consistent with that of the lattice parameter b. To verify the credibility of the observed phenomenon, another independent synchrotron [BL15U1, Shanghai Synchrotron Radiation Facility (SSRF)] angle-dispersive XRD experiment was performed, which provided conclusions that are consistent with experimental results obtained at X17C (National Synchrotron Light Source, NSLS), as shown in Fig. S3. The currently observed pressure-induced isostructural phase transition in CrAs deviates markedly from the pressure-induced changes reported for other isostructural phase transition, as shown in Fig. S4.
Fig. 3.
(A–C) Pressure dependences of the lattice parameters a, b, and c of CrAs. (D) Lattice volume as a function of pressure for CrAs.
Fig. S3.
(A) AD-XRD results of CrAs under various pressures. Pressures are indicated in the figure. (B) A slice of the diffraction patterns magnified to highlight the pressure dependence. The dotted lines serve as guides to the eyes.
Fig. S4.
Pressure-induced isostructural phase transitions in (A) PbCrO3, (B) EuFe2P2, (C) Na1−xFeAs, and (D) Nd(O0.88F0.12)FeAs.
The axial compressibility of CrAs is remarkably anisotropic after the isostructural phase transition point, and the relative axial compressibilities along the a-, b-, and c axis are 7.98 × 10⁻³ Å/GPa, 3.84 × 10⁻² Å/GPa, and 3.71 × 10⁻³ Å/GPa, respectively. The compressibilities along the a- and c axis are more than an order of magnitude smaller than that along the b axis.
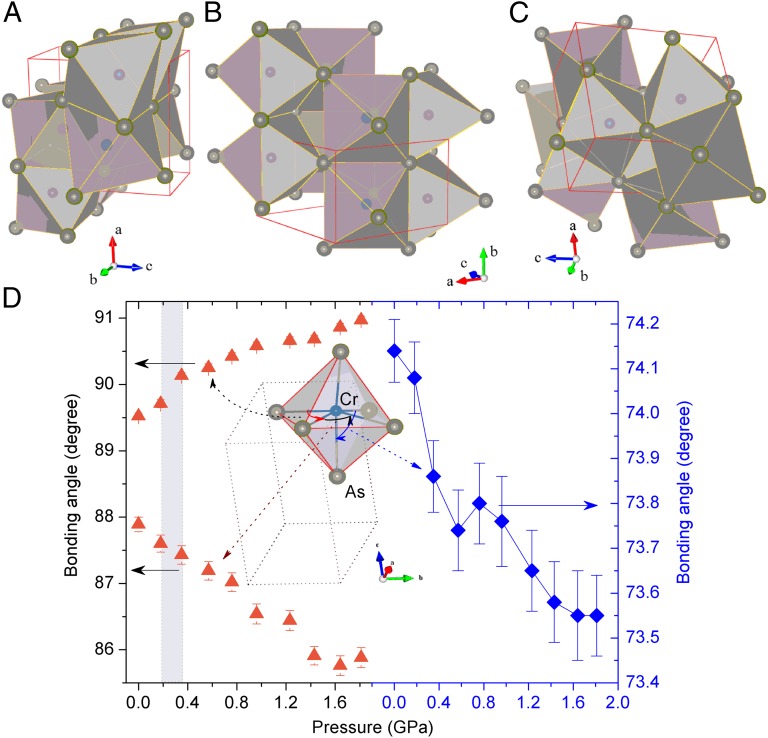
CrAs could be considered as a 3D network comprising CrAs6 octahedra, in contrast with the quasi-layers in the iron-based superconductor. With regard to the anisotropic axial compressibility of CrAs, it could be explained by the different stacking of the CrAs6 octahedra along the different crystallographic axes. The structure of the Cr-centered CrAs6 octahedra viewed from different directions is depicted in Fig. 4 A–C. The CrAs6 octahedra are face-connected along the a axis and edge-shared along the b axis. Neighboring CrAs6 layers along the c axis are one-half edge-shared and one-half vertex-shared connections. The average numbers of the CrAs octahedral layers along the a-, b-, and c axis per unit cell are 2, 1, and 2, respectively, and the thicknesses of every CrAs6 octahedral layer along the a-, b-, and c axis is 2.8206 (5.6411/2), 3.4797 (3.4797/1), and 3.0980 (6.1959/2) Å, respectively. Thus, the CrAs6 octahedral layers along the b axis are sparser than those along the a- and c axis.
Fig. 4.
(A–C) Schematic stacking of CrAs6 octahedra along a-, b-, and c axis of CrAs. (D) Pressure dependences of the As−Cr−As bonding angle (∠As−Cr−As) of CrAs.
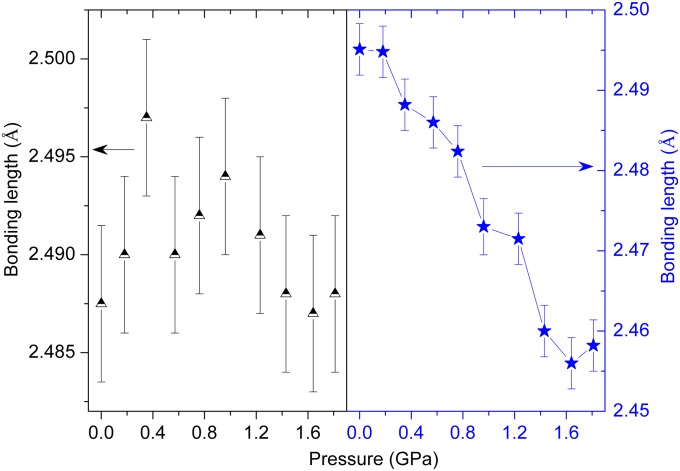
The calculated bonding lengths and bonding angles for the environment surrounding the Cr atoms indicate that the CrAs6 octahedron is not perfect at ambient conditions. The pressure dependence of the As−Cr−As bonding angle (∠As−Cr−As) of CrAs is shown in Fig. 4D. It can be seen from Fig. 4D that the drastic contraction of lattice parameter b resulted in two As−Cr−As angles exhibiting a contrary pressure dependence. Furthermore, greater distortion of the CrAs6 octahedra and the shortening of the Cr–As bonding lengths make the CrAs6 octahedra greatly compressed along the b axis under high pressure. The pressure dependence of the As−Cr−As bonding angle is shown in Fig. 4D, which also gives rise to an increase of the crystal-field splitting energy. Selected bonding lengths (dCr−As) of CrAs as a function of pressure are shown in Fig. S5. It can be seen from Fig. S5 that the bonding length correlated to the lattice parameters a and c shows subtle variation under high pressure, whereas the bonding length correlated to the lattice parameter b exhibits significant contraction as the pressure increases.
Fig. S5.
Pressure dependence of the bonding lengths of Cr–As (dCr−As).
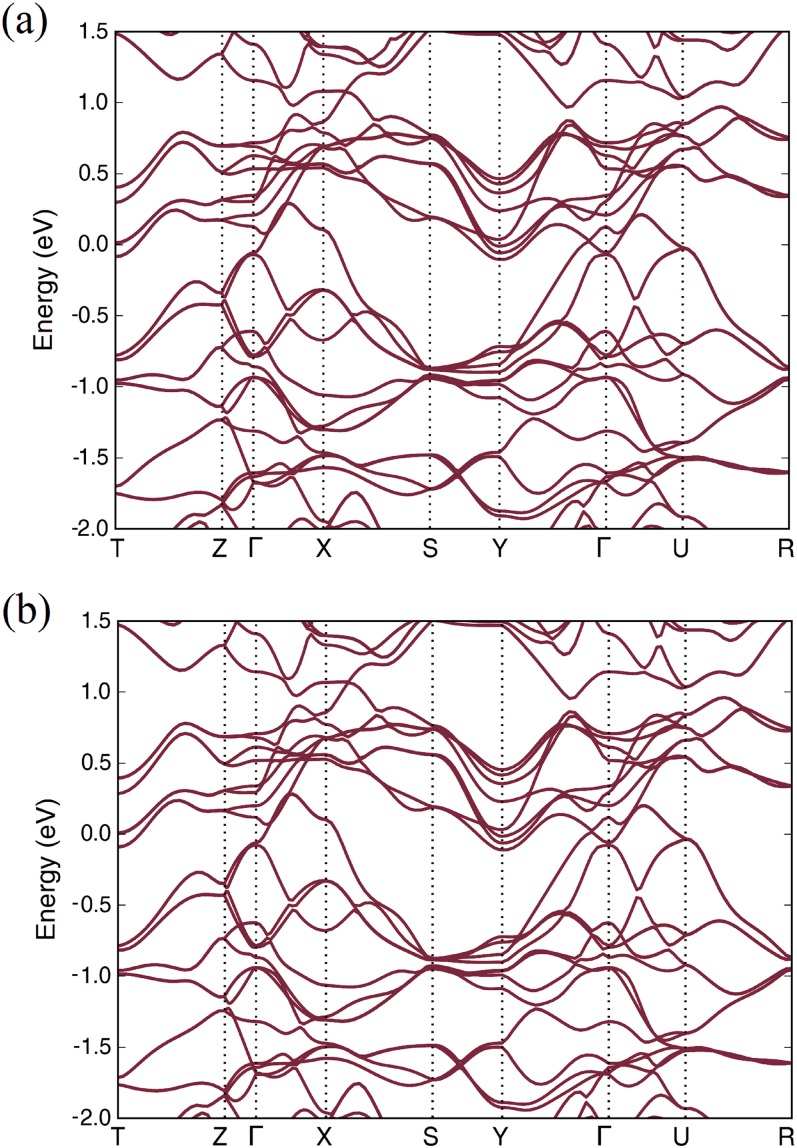
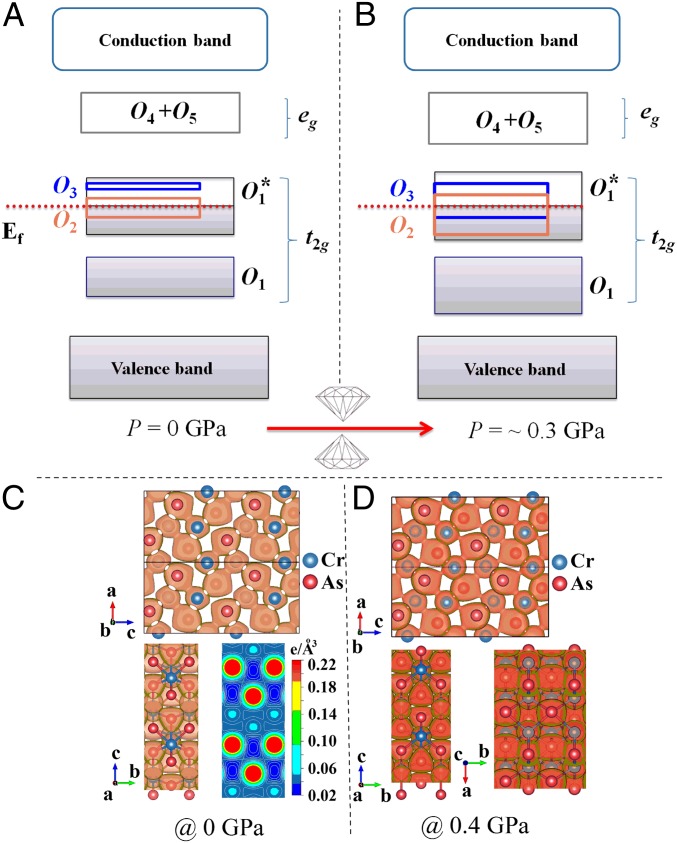
The band model of TAs was first proposed by Goodenough (23), Menyuk et al. (24), and Goodenough and Kafalas (25), and later developed by Boller and Kallel (26). Here, we interpret the anomalous compression behaviors of CrAs at ∼0.18−0.35 GPa in terms of the above-mentioned band model. The electronic configuration of the Cr3+ ions in CrAs is 3d3. In light of crystal ligand field theory, CrAs crystallizes into the MnP-type structure, and the central Cr atoms are octahedrally coordinated with six As atoms. The d states of the Cr atom split into t2g (, , and ) and eg ( and ) manifolds. The t2g states of Cr hybridize with the p state of As atoms, forming the bonding and the antibonding states. Therefore, the eg states of Cr are nonbonding and form the narrow states. The present calculated band structure of CrAs at ambient pressure is shown in Fig. S6A, where the Fermi level lies inside the energy band, indicating its metallic characteristics, and is consistent with the experimental results (10). The band scheme of CrAs under ambient and high pressures is shown in Fig. 5. The ions being arranged along the b axis space so far apart (∼3.45 Å) that their wave functions of the 3d electrons possess little overlap, resulting in weak electron repulsion along this axis. Therefore, the b axis is much more compressible at the onset of pressure application compared with the a- and c axis. As the pressure increases, the widths of all energy bands in CrAs including the energy band along the gamma → Y direction related to the electronic structure along the b axis in real space (hereafter EBb) are broadened. When the applied pressure is increased to the critical point (∼0.18−0.35 GPa), the EBb just crosses into the Fermi level with partially filled electrons. The electronic repulsion also causes the b axis to become more incompressible. Therefore, the energy band model satisfactorily addresses the pressure-dependency curve of the lattice parameter b given in Fig. 3B and the electronic responses to high pressure, which is important in understanding the pressure-induced superconductivity of CrAs. Charge density projected along the a−c and b−c planes of CrAs under ambient pressure are shown in Fig. 5C. A slice of charge density at c = 0 Å is shown in contours (Fig. 5C, Right). The charge density is less dense (deeper color) along the b axis, resulting in a better compressibility. The results drawn here are consistent with the foregoing energy band model analysis. With increasing pressure the gradient of charge density decreases as shown in Fig. 5D. These findings provide consistent evidence with pressure-induced variation of crystal structure (i.e., volume contraction and distortion of CrAs6 octahedral units in CrAs), in which the change of electronic structure was mainly affected by the shrinking of the b axis.
Fig. S6.
Calculated band structure of CrAs at (A) ambient and (B) 0.4-GPa pressures. Spin–orbit interaction is evaluated in this calculation by the treatment of noncollinear magnetic structures.
Fig. 5.
Band scheme of CrAs at (A) ambient and (B) high pressures. (C) Charge density projected along the a−c plane. The visualized isosurfaces equal to a charge density of 0.05 e/Å3. Atoms in the front layer (bright colors) are inserted into the interstitials of the back layer (atoms in gloomy colors) upon compression. Charge density projected along the b−c plane. A slice of charge density at the plane of c = 0 Å is shown in contours. The interatomic forces are derived from the gradient of energy, also known as the charge density. Because the charge density is less steep along the b axis, it undoubtedly achieves better compressibility. (D) Charge density projected along the a−c, b−c, and a−b planes of CrAs under 0.4 GPa.
At ambient conditions, CrAs possesses the paramagnetic metallic characteristic and the electrons are in itinerant status. The itinerant state approaches low temperature as the pressure increases. This tendency continues until the TN is suppressed to very low temperature. The superconductivity appears when the itinerant state occurs around ∼2 K.
As seen from Fig. 3, the lattice parameters a and c of CrAs exhibited elongation while lattice parameter b experienced rapid contraction ∼0.18−0.35 GPa. Based on the experimental results of ref. 21, this suggests that the magnetism of CrAs may exhibit changes such as an abrupt drop of the magnetic propagation vector at a critical pressure (∼0.6 GPa) (21). In addition, the large decrease of b axis observed in the present work has not been reported by Shen et al. (21).
Conclusions
In this paper, we presented crystallographic structural studies of the superconductor CrAs under high pressure with small pressure steps using synchrotron X-ray powder diffraction, which we believe to be heretofore unreported. The lattice parameters of CrAs exhibited anomalous variations as a function of pressure. We suggested that this was a pressure-induced isostructural phase transition. In the presently investigated pressure range, CrAs was remarkably anisotropic. Note that the transition pressure (∼0.18−0.35 GPa) obtained from this work coincides with that of the emergence of pressure-induced bulk superconductivity in CrAs. The currently observed pressure-induced isostructural phase transition in CrAs deviates markedly from previously documented classifications.
Materials and Methods
The high-pressure synchrotron XRD experiment was carried out using a symmetric diamond anvil cell. T301 stainless steel served as the gasket. The 150-μm-diameter sample chamber was filled with a mixture of CrAs powder, a ruby chip, and silicone oil as the pressure-transmitting medium. Angle-dispersive XRD (AD-XRD) patterns were obtained with a MarCCD detector using monochromatic radiation with a wavelength of 0.4112 Å at the X17C beamline of the NSLS, Brookhaven National Laboratory (BNL), and at the BL15U1 beamline of the SSRF using a wavelength of 0.6199 Å. The Fit2D software package was used to process the data (27). The pressures were determined according to the fluorescence shift of ruby (28). The XRD patterns of CrAs were analyzed with Rietveld refinement using the GSAS program package (29) with a user interface EXPGUI (30). The AD-XRD experiments were carried out at room temperature.
Lattice Parameters of TAs (T= V, Cr, Mn, and Fe) at Ambient Conditions
The previous investigation of the crystallographic structure of 3d transition metal monoaresenides demonstrated that VAs, CrAs, MnAs, and FeAs are isostructural compounds, which crystallize into the MnP-type structure at ambient conditions (16, 31, 32). We can see from Fig. S1 that the lattice parameter b (space group: Pnma) of CrAs is larger than those of VAs, MnAs, and FeAs at ambient conditions.
Polymorphisms of CrAs at Various Temperatures and Ambient Pressure
The crystallographic polymorphisms of CrAs at various temperatures and ambient pressure are shown in Fig. S2.
AD-XRD Study on CrAs Carried Out at Bl15U1 of SSRF
Fig. S3A presents the selected AD-XRD (collected at BL15U1 beamline of SSRF) using the wavelength of 0.6199 Å and a CCD detector) results of CrAs under various pressures. To get further insight into the pressure effect on the structure of CrAs, a slice of the diffraction patterns is magnified in Fig. S3B. We can see that the two independent XRD experimental results (X17C, NSLS and BL15U1, SSRF) are consistent. Both of the independent high-pressure AD-XRD experiments were carried out at room temperature.
Documented Pressure-Induced Isostructural Phase Transitions in a Number of Compounds
Xiao et al. (33) performed the AD-XRD study on PbCrO3. The experimental results demonstrated a cubic–cubic isostructural phase transition accompanying a large volume contraction as shown in Fig. S4A. The structure of EuFe2P2 exhibits complex pressure dependence (34). The lattice parameters a and c show normal decreasing with the pressure increasing up to ∼3 GPa. Then, the lattice parameter a shows a downward parabolic trend as the pressure further increases as shown in Fig. S4B. The last two cases are about the recently discovered iron-based superconductors. The experimental results suggest that these two iron-based superconductors exhibit pressure-induced isostructural phase transitions, which are indicated by the plateau of the lattice parameters appearing in Na1−xFeAs (35) (Fig. S4C) and the bouncing of the lattice parameter a in NdO0.88F0.12FeAs (4) (Fig. S4D) with the pressure increasing.
Pressure Dependence of the Bonding Lengths of Cr–As (dCr−As)
It can be seen from Fig. S5 that the bonding length correlated to the lattice parameters a and c shows subtle variation under high pressure, whereas the bonding length correlated to the lattice parameter b exhibits contraction as the pressure increases.
Band Scheme of CrAs
The dxy lobes are directed toward the neighboring Cr atoms along the a axis, the distance between which is 2.85 Å. A strong covalent bond ought to exist between the indicated Cr atoms, and they form a broad band (O1). The Cr ions arranged along the b axis space so far apart (∼3.45 Å) that their wave functions of the 3d electrons have weak overlap, which produces a very narrow band (O3). The eg orbitals are directed toward the anion atoms As and form a broad band (O4 and O5) due to the strong covalent bond and hybridization with the s and p states. The Fermi level EF should lie between the valence band and the conduction band, so we have placed it in such a way that it passes through the bands O2 and O1*.
Calculated Band Structure of CrAs
The calculated band structures of CrAs at ambient and 0.4 GPa are shown in Fig. S6. Spin–orbit interaction is evaluated in this calculation by the treatment of noncollinear magnetic structures.
Supplementary Material
Acknowledgments
Portions of this work were performed at the BL15U1 beamline, Shanghai Synchrotron Radiation Facility (SSRF) in China. The authors would like to thank Shanghai Synchrotron Radiation Source for use of the synchrotron radiation facilities. This work was supported by National Science Associated Funding (Grant U1530402). It was also partially supported by the Natural Science Foundation of China (Grant 11004072, 10904022), Ministry of Science and Technology of China (Grant 2014CB921500), and the Strategic Priority Research Program(B) of the Chinese Academy of Sciences (Grant XDB07020100). L.W. acknowledges the Program for New Century Excellent Talents in University (NCET-10-0444). We acknowledge the (National Synchrotron Light Source) NSLS of Brookhaven National Laboratory (BNL) for the provision of synchrotron radiation facilities beamline X17C. We are thankful for support from COMPRES (the Consortium for Materials Properties Research in Earth Sciences). The computational work was conducted on the SR10000-K1/52 supercomputing facilities of the Institute for Materials Research, Tohoku University.
Footnotes
The authors declare no conflict of interest.
This article contains supporting information online at www.pnas.org/lookup/suppl/doi:10.1073/pnas.1520570112/-/DCSupplemental.
References
- 1.Kamihara Y, Watanabe T, Hirano M, Hosono H. Iron-based layered superconductor La[O(1-x)F(x)]FeAs (x = 0.05-0.12) with T(c) = 26 K. J Am Chem Soc. 2008;130(11):3296–3297. doi: 10.1021/ja800073m. [DOI] [PubMed] [Google Scholar]
- 2.Takahashi H, et al. Superconductivity at 43 K in an iron-based layered compound LaO(1-x)F(x)FeAs. Nature. 2008;453(7193):376–378. doi: 10.1038/nature06972. [DOI] [PubMed] [Google Scholar]
- 3.Chen XH, et al. Superconductivity at 43 K in SmFeAsO1-xFx. Nature. 2008;453(7196):761–762. doi: 10.1038/nature07045. [DOI] [PubMed] [Google Scholar]
- 4.Zhao J, et al. Struture stability and compressibility of iron-based superconductor Nd(O0.88F0.12)FeAs under high pressure. J Am Chem Soc. 2008;130(42):13828–13829. doi: 10.1021/ja804229k. [DOI] [PubMed] [Google Scholar]
- 5.Chen GF, et al. Superconductivity at 41 K and its competition with spin-density-wave instability in layered CeO1-xFxFeAs. Phys Rev Lett. 2008;100(24):247002. doi: 10.1103/PhysRevLett.100.247002. [DOI] [PubMed] [Google Scholar]
- 6.Okada H, et al. Superconductivity under high pressure in LaFeAsO. J Phys Soc Jpn. 2008;77(11):113712. [Google Scholar]
- 7.Ronning F, et al. Ni2X2 (X = pnictide, chalcogenide, or B) based superconductors. Physica C. 2009;469(9-12):396–403. [Google Scholar]
- 8.Mizuguchi Y, Tomioka F, Tsuda S, Yamaguchi T, Takano Y. Superconductivity at 27 K in tetragonal FeSe under high pressure. Appl Phys Lett. 2008;93:152505. [Google Scholar]
- 9.Alireza PL, et al. Superconductivity up to 29 K in SrFe(2)As(2) and BaFe(2)As(2) at high pressures. J Phys Condens Matter. 2009;21(1):012208. doi: 10.1088/0953-8984/21/1/012208. [DOI] [PubMed] [Google Scholar]
- 10.Wu W, et al. Superconductivity in the vicinity of antiferromagnetic order in CrAs. Nat Commun. 2014;5:5508. doi: 10.1038/ncomms6508. [DOI] [PubMed] [Google Scholar]
- 11.Kotegawa H, Nakahara S, Tou H, Sugawara H. Superconductivity of 2.2 K under pressure in helimagnet CrAs. J Phys Soc Jpn. 2014;83:093702. [Google Scholar]
- 12.Wada H, Tanabe Y. Giant magnetocaloric effect of MnAs1-xSbx. Appl Phys Lett. 2001;79(20):3302–3304. [Google Scholar]
- 13.Schünemann JW, Lange A, Govor GA, Bärner K, Gmelin E. Specific heat capacity of Mn1+δAs1−xSbx single crystals. J Alloys Compd. 1992;178(1-2):237–247. [Google Scholar]
- 14.Segawa K, Ando Y. Magnetic and transport properties of FeAs single crystals. J Phys Soc Jpn. 2009;78(10):104720. [Google Scholar]
- 15.Watanabe H, Kazama N, Yamaguchi Y, Ohashi M. Magnetic structure of CrAs and Mn substituted CrAs. J Appl Phys. 1969;40(3):1128–1129. [Google Scholar]
- 16.Kanaya K, Abe S, Yoshida H, Kamigaki K, Kaneko T. Magnetic and structural properties of pseudo-binary compounds CrAs1−xPx. J Alloys Compd. 2004;383(1-2):189–194. [Google Scholar]
- 17.Wu W, et al. Low temperature properties of pnictide CrAs single crystal. Science China. 2010;53(7):1207–1211. [Google Scholar]
- 18.Keller L, et al. 2014. Pressure dependence of the magnetic order in CrAs: A neutron diffraction investigation. arXiv:1409.5706.
- 19.Yoshida H, Kaneko T, Shono M, Abe S, Ohashi M. The pressure effect of the Néel point of the mixed compounds CrSb1-xAsx (0.5 < x ≤ 1.0) J Magn Magn Mater. 1980;15-18(3):1147–1148. [Google Scholar]
- 20.Zavadskii EA, Sibarova IA. Some features of phase transition in chromium arsenide at high pressures. Sov Phys JETP. 1980;51(3):542–547. [Google Scholar]
- 21.Shen Y, et al. 2014. Structural and magnetic phase diagram of CrAs and its relationship with pressure-induced superconductivity. arXiv:1409.6615.
- 22.Kornblatt JA. Materials with negative compressibilities. Science. 1998;281:143. doi: 10.1126/science.279.5356.1522. [DOI] [PubMed] [Google Scholar]
- 23.Goodenough JB. Localized vs collective descriptions of magnetic electrons. J Appl Phys. 1968;39(2):403–411. [Google Scholar]
- 24.Menyuk N, Kafalas JA, Dwight K, Goodenough JB. Effects of pressure on the magnetic properties of MnAs. Phys Rev. 1969;177(2):942–951. [Google Scholar]
- 25.Goodenough JB, Kafalas JA. High-pressure study of the first-order phase transition in MnAs. Phys Rev. 1967;157(2):389–395. [Google Scholar]
- 26.Boller H, Kallel A. First order crystallographic and magnetic phase transition in CrAs. Solid State Commun. 1971;9(19):1699–1706. [Google Scholar]
- 27.Hammersley AP, Svensson SO, Hanfland M, Fitch AN, Hausermann D. Two-dimensional detector software: From real detector to idealised image or two-theta scan. High Press Res. 1996;14(4-6):235–248. [Google Scholar]
- 28.Mao HK, Xu JA, Bell P. Calibration of the ruby pressure gauge to 800-kbar under quasi-hydrostatic conditions. J Geophys Res. 1986;91(B5):4673–4676. [Google Scholar]
- 29.Larson AC, Von Dreele RB. 1994. General Structure Analysis System (GSAS). Los Alamos National Laboratory Report LAUR (The Regents of the University of California, Los Alamos, NM), pp 86–748.
- 30.Toby BH. EXPGUI, A graphical user interface for GSAS. J Appl Cryst. 2001;34(2):210–213. [Google Scholar]
- 31. Selte K, Kjekshus A, Andresen AF, Olli M, Pilotti Å (1972) Structural and magnetic properties of VP and VAs. Acta Chem Scand 26(10):4057–4062.
- 32.Lyman PS, Prewitt CT. Room- and high-pressure crystal chemistry of CoAs and FeAs. Acta Crystallogr B. 1984;40(1):14–20. [Google Scholar]
- 33.Xiao W, Tan D, Xiong X, Liu J, Xu J. Large volume collapse observed in the phase transition in cubic PbCrO3 perovskite. Proc Natl Acad Sci USA. 2010;107(32):14026–14029. doi: 10.1073/pnas.1005307107. [DOI] [PMC free article] [PubMed] [Google Scholar]
- 34.Huhnt C, Schlabitz W, Wurth A, Mewis A, Reehuis M. First- and second-order phase transitions in ternary europium phosphides with ThCr2Si2-type structure. Physica B. 1998;252(1-2):44–54. [Google Scholar]
- 35.Liu Q, et al. Pressure-induced isostructural phase transition and correlation of FeAs coordination with the superconducting properties of 111-type Na(1-x)FeAs. J Am Chem Soc. 2011;133(20):7892–7896. doi: 10.1021/ja2009949. [DOI] [PubMed] [Google Scholar]
Associated Data
This section collects any data citations, data availability statements, or supplementary materials included in this article.


