Significance
Under homeostasis, peripheral circadian clocks (CCs) and metabolism are intimately linked, as pathologies occur on perturbation of their coupling. In mice, shifting the feeding time from the phase of activity (night) to the phase of rest (day) is known to act as a time cue for peripheral CCs, leading to a 12-hour shift of the time at which their CC components are expressed. However, the molecular mechanisms that underlie this shift are largely unknown. Here, we reveal both the origin and the identity of the metabolic signals that are generated on shifting eating to the rest phase and how these signals directly alter the expression of CC components to generate the shift that ultimately leads to metabolic syndrome-like pathology.
Keywords: shifted eating, shifted peripheral circadian clocks, metabolic alterations, RevErbα, PPARα
Abstract
The molecular mechanisms underlying the events through which alterations in diurnal activities impinge on peripheral circadian clocks (PCCs), and reciprocally how the PCCs affect metabolism, thereby generating pathologies, are still poorly understood. Here, we deciphered how switching the diurnal feeding from the active to the rest phase, i.e., restricted feeding (RF), immediately creates a hypoinsulinemia during the active phase, which initiates a metabolic reprogramming by increasing FFA and glucagon levels. In turn, peroxisome proliferator-activated receptor alpha (PPARα) activation by free fatty acid (FFA), and cAMP response element-binding protein (CREB) activation by glucagon, lead to further metabolic alterations during the circadian active phase, as well as to aberrant activation of expression of the PCC components nuclear receptor subfamily 1, group D, member 1 (Nr1d1/RevErbα), Period (Per1 and Per2). Moreover, hypoinsulinemia leads to an increase in glycogen synthase kinase 3β (GSK3β) activity that, through phosphorylation, stabilizes and increases the level of the RevErbα protein during the active phase. This increase then leads to an untimely repression of expression of the genes containing a RORE DNA binding sequence (DBS), including the Bmal1 gene, thereby initiating in RF mice a 12-h PCC shift to which the CREB-mediated activation of Per1, Per2 by glucagon modestly contributes. We also show that the reported corticosterone extraproduction during the RF active phase reflects an adrenal aberrant activation of CREB signaling, which selectively delays the activation of the PPARα–RevErbα axis in muscle and heart and accounts for the retarded shift of their PCCs.
Pioneering studies (1, 2) have established that switching the feeding time in mice from the “active” phase [dark period of the light-dark (L/D) cycle] to the “rest” phase (light period), i.e., restricted feeding (RF), overrides the suprachiasmatic nucleus (SCN) circadian clock (CC)-derived signals and acts as a “zeitgeber” for peripheral CCs (PCCs), leading to a 12-h shift in the time at which components of PCCs are expressed. Numerous studies have shown that under homeostatic conditions, the functions of PCCs and metabolism are tightly linked and that perturbations in their interactions leads to pathologies, e.g., obesity and metabolic syndrome (3–5).The identity of some of the molecular pathways that couple PCCs to metabolism are known (3–5), but it is largely unknown how environmental cues, e.g., altered feeding schedules, may directly perturb the expression of individual CC components (5–7), thereby leading to obesity and a metabolic syndrome-like pathology (5). Assuming that specific metabolic perturbations generated by switching the feeding time could selectively affect the time of expression of some of the CC core components, we looked for both metabolic and PCC alterations at early RF times. We report here a comprehensive temporal analysis, and we found that the shift of PCCs on RF is directly linked, at the molecular level, to metabolic reprogramming that directly impinges on CC component expression.
Results
RF Leads to a Starvation-Like State Characterized by Metabolic and CC Alterations.
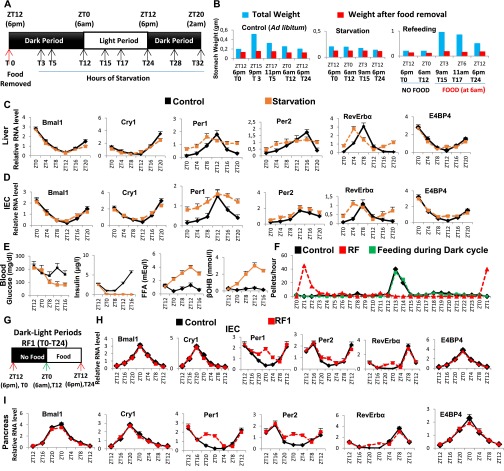
We initially observed that on RF, gastric emptying is severely delayed (Fig. S1B), thereby creating a “starvation-like state.” This observation led us to investigate the effect of a 24-h starvation on metabolic parameters, which revealed reductions in glucose and insulin (INS) and increases of ketone bodies (βOHB; β-hydroxybutyrate) and free fatty acid (FFA) (Fig. S1 A and E), whereas concomitant transcript analyses showed an increase and altered pattern of expression for Period 1 and 2 (Per1 and Per2) and nuclear receptor subfamily 1, group D, member 1 (Nr1d1/RevErbα), but not of aryl hydrocarbon receptor nuclear translocator-like protein 1 (ARNTL1/Bmal1), cryptochrome 1 (Cry1) and a nuclear Factor, interleukin 3 regulated (NFIL3/E4BP4) (Fig. S1 C and D). We therefore posited that RF could be accompanied by metabolic changes that could affect PCCs.
Fig. S1.
Metabolic features during early RF resemble those of a state of starvation. (A) Schematic representation of the starvation experiment. Food was removed at 6:00 PM (ZT12/T0) and mice were starved for 32 h. The control group received food ad libitum. The black boxes represent the dark period of the normal dark-light (D/L) cycle, whereas the white box represents the light period. (B) Weight of the stomach before and after food removal in control and starved mice, as well as in mice refed at 6:00 AM (ZT0/T12) after 12 h of starvation (T0–T12). (C and D) RNA transcript levels of CC components in RF liver (C) and IECs (D) in control and starved mice. (E) Levels of blood components, as indicated, in control and starved mice. (F) Measurement of feeding activity (number of pellets consumed per hour) in control and RF mice, as well as in mice fed exclusively during dark cycle of D/L period. (G) Schematic representation of D/L periods during the RF1. Food was removed from the RF cages at 6:00 PM (ZT12/T0) and was reintroduced after 12 h at 6:00 AM (ZT0/T12; indicated with a green arrow) and present until T24 (6:00 PM). The black box represents the dark period (T0–T12, no food), whereas the white box represents the light period (T12–T24, with food) of the L/D cycle. (H and I) RNA transcript levels of CC components in IECs (H) and pancreas (I) of control and RF1 mice. All values are mean ± SEM.
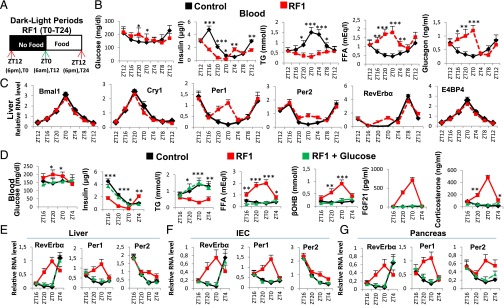
Analyzing the RF effect on these parameters during the RF first day (RF1; Fig. 1A) indicated INS and triglyceride (TG) decreases, whereas glucose, FFA, and glucagon increased (Fig. 1B). Looking at CC component expression during RF1 showed that Per1, Per2, and RevErbα transcripts increased between “Zeitgeber” (ZT) 20 and ZT4 (food withdrawal at ZT12), whereas Bmal1, Cry1, and E4BP4 were unaltered (Fig. 1C and Fig. S1 F–I). Of note, using luciferase reporter mice, Saini et al. (8) observed a similar pattern of expression for Per2, RevErbα, and Bmal1 in RF livers. That early RF metabolic changes were similar to those generated under starvation and that RF and starvation altered the same CC components prompted us to investigate how metabolic alterations may impair PCC during RF.
Fig. 1.
RF initiation induces metabolic and CC alterations. (A) Schematic representation of the RF1 experiment. (B) Levels of blood components in control and RF1 mice. (C) RNA transcript levels of CC components in RF1 liver. (D) Levels of blood components in control, RF1, and RF1 intraperitoneally glucose administered (RF1+Glucose) mice. (E–G) RNA transcript levels of genes as indicated in liver (E), IEC (F), and pancreas (G) of control, RF1, and RF1+Glucose mice. All values are mean ± SEM. *P < 0.05, **P < 0.01, ***P < 0.001.
Glucose Administration Prevents Metabolic and PCC Alterations During the RF Initial Phase.
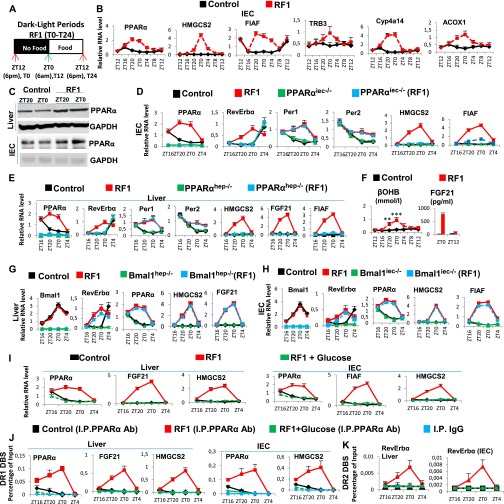
A starvation-induced decrease in blood glucose reduces INS and increases glucagon and FFA levels, thereby activating gluconeogenesis and β-oxidation (9, 10). We therefore posited that maintaining blood glucose may prevent metabolic and PCC alterations during early RF. Indeed, glucose administration to RF mice (RF glucose mice) prevented INS decrease and a rise in FFA, corticosterone, βOHB, and fibroblast growth factor 21 (FGF21) (Fig. 1D). Notably, there was no increase of Per1, Per2, and RevErbα in the liver, intestinal epithelial cells (IECs), and pancreas of RF glucose mice (Fig. 1 E–G), supporting our hypothesis that the initial RF CC alterations originate from an altered metabolism.
An Early Insulin Decrease Triggers Increased Lipolysis, FFA Release, and Aberrant PPARα Signaling in RF Mice.
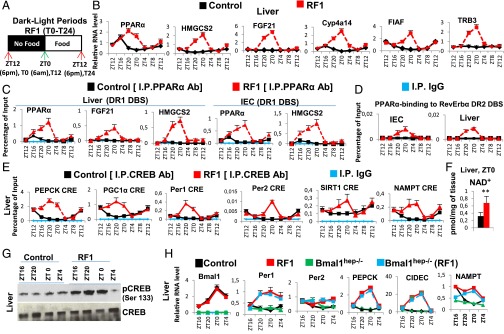
A decrease in blood INS triggers adipose tissue lipolysis and release of FFA, which acts as a ligand for peroxisome proliferator-activated receptor alpha (PPARα) (11). Importantly, FFA-liganded PPARα (see Fig. 3A) is known to activate transcription of a number of target genes containing a direct repeat 1 (DR1) DNA binding sequence (DBS) (11), and to activate its own transcription by binding to its own DR1 DBS (11). Accordingly, expression of PPARα and of its target genes was increased in RF liver and IECs between ZT16 and ZT0 (Fig. 2B and Fig. S2 B, C, and F), and ChIP assays demonstrated a concomitant increase in PPARα binding to its own DR1-DBS and to those of its target genes (Fig. 2C). We previously demonstrated that, in absence of Bmal1, PPARα could induce RevErbα transcription through binding to the DR2 DBS of the RevErbα promoter (12). As RevErbα transcripts increased in RF mice (when no Bmal1 activity could be detected; see above), we speculated that PPARα could also contribute to this RF increase in RevErbα expression. Indeed, PPARα was recruited to RevErbα DR2 DBS during early RF (ZT20–ZT0), but not in control animals (Fig. 2D). Moreover, selective PPARα mutations in liver (PPARαhep−/−) and IECs (PPARαiec−/−) demonstrated that the early RF increases in RevErbα, HMGCS2, FGF21, and FIAF transcripts were dependent on PPARα (Fig. S2 D and E and Fig. 3A). Importantly, glucose administration to RF mice inhibited PPARα binding to its own promoter and to the DR1 DBSs in its target genes, as well as to the RevErbα DR2 DBS (Fig. S2 J and K), leading to a reduction in their expression during RF (Fig. 1 E–G and Fig. S2I). Of note, these early RF-induced expressions of PPARα and of its target genes were not affected in Bmal1hep−/− and Bmal1iec−/− mutants (Fig. S2 G and H).
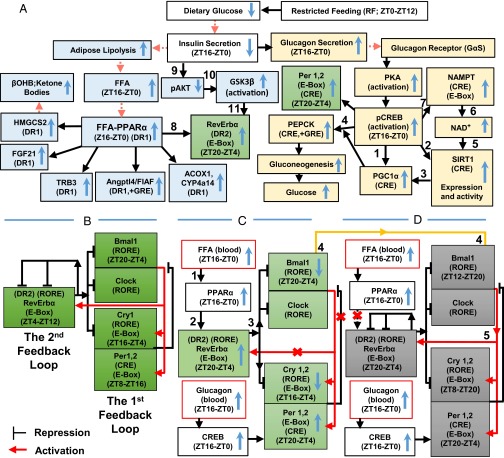
Fig. 3.
A schematic representation of how RF-induced metabolic alterations induce a shift of PCCs. (A) Metabolic alterations induced by RF. The up and down blue arrows correspond, respectively, to increases and decreases of indicated components during RF. The red arrowheads indicate components present in the blood. (B) The two interlocked feedback loops constituting the normal CC oscillator. (C) The early phase of peripheral CC disruption. The up and down blue arrows correspond to increases and decreases of indicated components in RF, respectively. Red crosses represent RF-induced impairments. (D) The late phase of reconstruction of a new shifted PCC.
Fig. 2.
RF-induced aberrant activations of PPARα and CREB signaling play a critical role in metabolic and CC alterations. (A) Schematic representation of the RF1 experiment. (B) RNA transcript levels of genes, as indicated, in RF1 liver. (C) ChIP-qPCR assays to analyze PPARα recruitment to DR1 DBS-containing genes in liver of control and RF1 mice. (D) ChIP-qPCR assays to analyze PPARα recruitment to the RevErbα DR2 DBS in liver and IEC of control and RF1 mice. (E) ChIP-qPCR assays to analyze CREB binding to CRE DBSs present in the indicated genes in control and RF1 liver. (F) NAD+ levels in control and RF1 liver. (G) Immunoblot analyses of control and RF1 liver with indicated antibodies. (H) RNA transcript levels of genes as indicated in liver of control and RF1 mice, with or without selective mutation of Bmal1 (Bmal1hep−/−). All values are mean ± SEM. **P < 0.01.
Fig. S2.
Early RF induces temporally aberrant PPARα signaling. (A) A schematic representation of the RF1 experiment. (B) RNA transcript levels of indicated genes in IECs of control and RF1 mice. (C) Immunoblot analyses to evaluate the levels of PPARα in liver and IECs of control and RF1 mice. (D) RNA transcript analysis of genes, as indicated, in IECs of control and RF1 mice with or without an IEC-selective mutation of PPARα (PPARαiec−/−). (E) RNA transcript analysis of genes, as indicated, in liver of control and RF1 mice with or without a liver-selective mutation of PPARα (PPARαhep−/−). (F) Levels of ketone bodies (βOHB) and FGF21 in RF1 blood. (G) RNA transcript analysis of genes, as indicated, in liver of control and RF1 mice with or without a liver selective mutation of Bmal1 (Bmal1hep−/−). (H) RNA transcript analysis of genes, as indicated, in IECs of control and RF1 mice with or without an IEC-selective mutation of Bmal1 (Bmal1iec−/−). (I) RNA transcript levels of indicated genes in liver and IECs of control and RF1 and RF1+Glucose mice. (J) ChIP-qPCR assays in liver and IECs of control, RF1, and RF1+Glucose mice to analyze the PPARα recruitment to the DR1 DBSs present in the indicated genes. (K) As in J, but to analyze the PPARα recruitment to the RevErbα DR2 DBS. All values are mean ± SEM. **P < 0.01, ***P < 0.001.
PPARα and RevErbα Are Instrumental in RF-Induced Breaking of Existing PCCs.
As RF early metabolic alterations did affect the expression of Per1, Per2, and RevErbα, we analyzed the transcript of CC components after RF for 4, 8, 15, 30, and 90 d. In liver and IECs, all of them were shifted after RF4, but it took 8 d to achieve the same shifts in muscle and heart (see below). Importantly, once established these shifts were stable as long as RF was not interrupted, whereas the “original circadian active and rest phases” remained unchanged throughout the RF period (13).
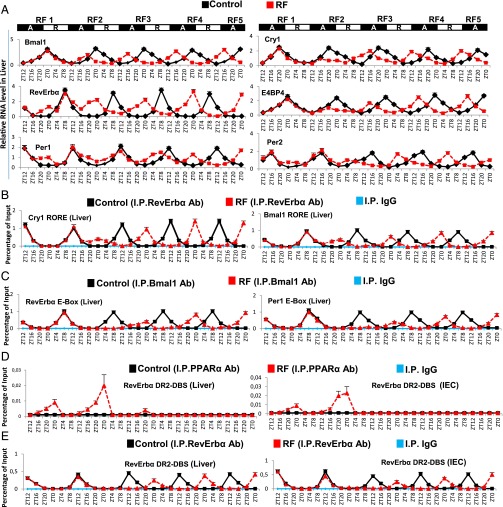
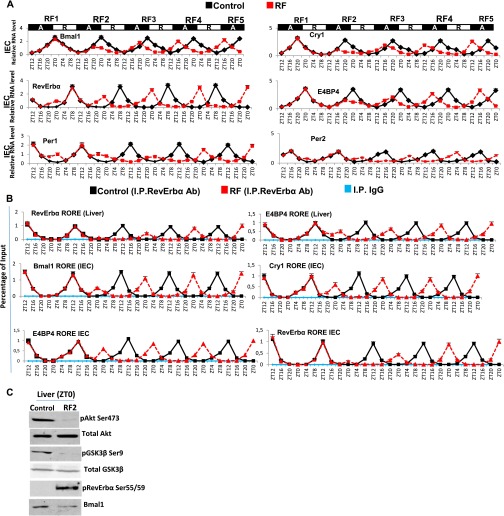
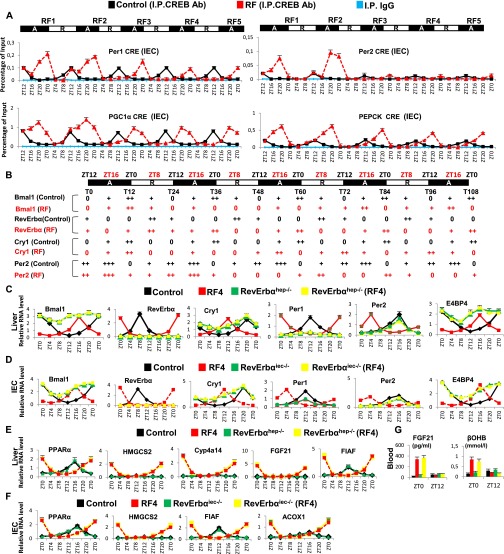
Analysis of CC shifts in liver and IECs during the first 108 RF hours (Fig. 4A and Fig. S3A) revealed that they occurred in two steps. The first phase (broken clock; compare Fig. 3 B and C) was triggered by metabolic alterations occurring during the active phase (ZT12–ZT0) through (i) an increase of FFA-liganded PPARα that activated aberrant RevErbα expression (Figs. 3C and 4A and Fig. S3A) mediated by its binding to the RevErbα DR2 DBS (Fig. 4D). This RevErbα increased expression then repressed during the active phase the expression of RORα/RevErbα response element (RORE)-containing genes (Fig. 4 A and B and Fig. S3 A and B), and (ii) a simultaneous pCREB increase that activated Per1, Per2 expression (Fig. 4A and Figs. S3A, S4C, and S5A). Importantly, besides these Per1, Per2, and RevErbα transcript alterations during RF1 night, there was no changes in the profile of other CC components (Bmal1, Cry1, and E4BP4; Fig. 4A and Fig. S3A). In contrast, the expression of all CC components was altered during RF2 (compare RF1 and RF2 in Fig. 4A and Fig. S3A), because (i) during the active phase, the levels of Bmal1, Cry1, and E4BP4 transcripts were diminished, (ii) during the rest phase (ZT0–ZT12), there was a decrease in RevErbα transcripts that were abnormally expressed during the active phase, and (iii) the physiological ZT8–ZT12 expression of Per2 transcripts disappeared, whereas both Per1 and Per2 transcripts were modestly expressed during the ZT20–ZT4 period (Fig. 4A and Fig. S3A).
Fig. 4.
RevErbα is instrumental in the RF-induced CC shift. (A) RNA transcript levels of indicated CC components in the liver during the first 108 h of RF. Black boxes (A) represent the active phase and white boxes (R) the rest phase. (B) ChIP-qPCR assays to analyze RevErbα recruitment (in control and RF liver) to the RORE DBS present in Bmal1 and Cry1 genes. (C) ChIP-qPCR assays to analyze Bmal1 recruitment (in control and RF liver) to the E-Box DBS present in RevErbα and Per1 genes. (D) ChIP-qPCR assays to analyze PPARα recruitment to the RevErbα DR2-DBS in control and RF liver and IEC. (E) ChIP-qPCR assays to analyze RevErbα recruitment to the RevErbα DR2-DBS in control and RF liver and IEC. All values are mean ± SEM.
Fig. S3.
Temporal analysis of the RF-induced PCC shift. (A) RNA transcript levels of indicated CC components in IECs during the RF first 108 h. Black boxes (A) represent the active phase, and white boxes (R) the rest phase. (B) ChIP-qPCR assays to analyze RevErbα recruitment to the RORE DBSs present in genes, as indicated, in control and RF liver and IECs. (C) Immunoblot analyses in liver of control and RF2 mice (at ZT0), with indicated antibodies. All values are mean ± SEM.
Fig. S4.
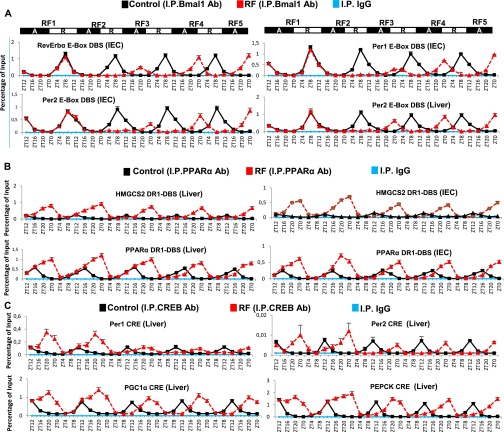
The shift of Bmal1 expression plays a critical role in regenerating a new CC on restricted feeding. (A) ChIP-qPCR assays to analyze Bmal1 recruitment to the E-Box DBSs present in the RevErbα, Per1, and Per2 genes in IECs, as well as to the Per2 E-Box DBS in liver during the first 108 RF hours. (B) ChIP-qPCR assays in liver and IECs to analyze PPARα recruitment to the DR1 DBSs present in the PPARα and HMGCS2 genes during the first 108 RF hours. (C) ChIP-qPCR assays in liver to analyze the CREB recruitment to the CRE DBSs present in genes, as indicated. All values are mean ± SEM.
Fig. S5.
Instrumental role of RevErbα in RF-induced CC shift. (A) ChIP-qPCR assays in IECs to analyze the CREB recruitment to the CRE DBSs present in genes as indicated. (B) Progressive shifts of the indicated clock genes during the first RF 108 h. 0, minimal transcript levels; +, ++, and +++, relative amount of detectable RNA transcripts. (C) RNA transcript levels of CC components in control and RF4 mice with or without a liver selective mutation of RevErbα (RevErbαhep−/−). (D) RNA transcript levels of CC components in control and RF4 mice with or without an IEC selective mutation of RevErbα (RevErbαiec−/−). (E) RNA transcript levels of genes, as indicated in control and RF4 mice with or without a liver-selective mutation of RevErbα (RevErbαhep−/−). (F) RNA transcript levels of genes, as indicated in control and RF4 mice with or without an IEC-selective mutation of RevErbα (RevErbαiec−/−). (G) Levels of FGF21 and βOHB in the blood of control and RF4 mice with or without a liver-selective mutation of RevErbα (RevErbαhep−/−). All values are mean ± SEM.
ChIP assays were performed in RF liver and IECs to explore the basis for these aberrant expressions of PCC components. It is known that RevErbα expression is controlled by Bmal1 (3) and, in addition, that the RevErbα promoter contains a DR2 DBS to which RevErbα binds to trigger its autorepression, whereas the binding of FFA-liganded PPARα to the same element enhances RevErbα expression (12, 14) (Fig. 3C). As PPARαhep−/− and PPARαiec−/− mutants (Fig. S2 D and E) together with Bmal1hep−/− and Bmal1iec−/− mutants (Fig. S2 G and H) revealed the Bmal1-independent critical role of PPARα in RevErbα early expression in RF mice, we analyzed PPARα binding on the RevErbα DR2 DBS in RF tissues. Remarkably, this binding was only detected in RF mice during the ZT16–ZT0 period of the first two RF nights (Fig. 4D; see below), thereby leading to aberrant RevErbα transcription during the active phase (Figs. 3C and 4A and Fig. S3A).
As expected (9), RF hypoinsulinemia also decreased pAKT, thereby activating glycogen synthase kinase 3β (GSK3β) which, in turn, through phosphorylation, increases the amount of RevErbα (steps 8–11 in Fig. 3A and Fig. S3C) (13). ChIP assays (Fig. 4B and Fig. S3B) performed to investigate the consequence of this active phase RevErbα expression revealed a time-restricted (ZT8–ZT12) RevErbα binding to Bmal1, Cry1, and E4BP4 RORE DBS (3) in both control and RF mice during the RF1 rest phase (Fig. 4B and Fig. S3B). In contrast, during the active phase of RF2, RevErbα was recruited on these RORE DBSs between ZT20 and ZT4, which resulted in their repression during the active phase (Fig. 4B, Fig. S3B, and see steps 1–3 in Fig. 3C).
The Shifted Expression of Bmal1 Generates Shifted PCCs.
As Bmal1-dependent transcription of Per1, Per2, and RevErbα is known to drive CCs (3–5), ChIP assays were performed to analyze its contribution in initiating the RF PCC shift. In control mice, ChIP assays showed a rest phase (ZT4–ZT12) Bmal1 binding to the E-Box DBS of Per1, Per2, and RevErbα (Fig. 4C and Fig. S4A) (15). Strikingly, on RF1 night, no Bmal1 binding could be detected on the E-box of these genes when they were initially aberrantly expressed (Fig. 4C and Fig. S4A), due to PPARα binding on the RevErbα DR2 DBS and CREB recruitment on the CRE present in Per1 and Per2 genes (Fig. 4D and Figs. S4C and S5A). Remarkably, no Bmal1 binding to these E-Boxes could be observed during the ZT4–ZT12 period of RF2, due to the repression on Bmal1 exerted by RevErbα aberrantly expressed during the RF2 night (Fig. 4 A and B and Fig. S3 A and B). Importantly, refeeding RF mice (at ZT0) reduced the FFA blood level and consequently decreased PPARα binding on the RevErbα DR2 DBS (Fig. 4D), thus reducing RevErbα expression (see ZT4 of RF3; Fig. 4A and Fig. S3A).This resulted in a derepression of Bmal1 expression that was delayed to the ZT12–ZT20 period of RF3, thereby initiating the PCC shift (Fig. 4A and Fig. S3A; see Fig. 3 C and D).
During the second phase of the RF CC shift (Fig. 4A and Fig. S3A), the now shifted Bmal1 expression progressively restored the Bmal1-dependent expression of RevErbα, Per1, and Per2 during the ZT20–ZT4 period (Fig. 4 A and C and Figs. S3A and S4A; see Fig. 3D). Importantly, this Bmal1-dependent RevErbα synthesis during the ZT20–ZT4 period (Fig. 4C and Fig. S4A) not only prevented further binding of PPARα on the RevErbα DR2 DBS (making its transcription independent of metabolism), but also started to repress itself through binding to its own RORE and DR2 DBS (Fig. 4E and Fig. S3B). This pattern of RevErbα expression (ZT20–ZT4) with a zenith at ZT0 instead of ZT8 in WT mice was then repeated on the subsequent RF days, thereby creating an RF permanently shifted temporal window (ZT12–ZT20) for the RORα/γ-dependent expression of RORE DBS-containing genes (3). Indeed, the new ZT12–ZT20 period of Bmal1, Cry1, and E4BP4 expression in RF mice was first detected on RF3 and subsequently repeated on the following nights (Fig. 4A and Figs. S3A and S5B), whereas Per1 and Per2 expression was not stabilized before RF5. Importantly, in contrast with its decreased binding to RevErbα DR2 DBS during the ZT16–ZT0 period of RF3 and RF4, PPARα binding to its own DR1 DBS, as well as to that of the HMGCS2 gene, was unaltered during the same period (Fig. S4B). Most notably, the selective mutation of RevErbα in either liver (RevErbαhep−/−) or IECs (RevErbαiec−/−) prevented the RF CC shift in these tissues, but not the RF-induced metabolic alterations (Fig. S5 C–G).
An Increased Glucagon Secretion Results in an Activation of CREB Signaling During RF.
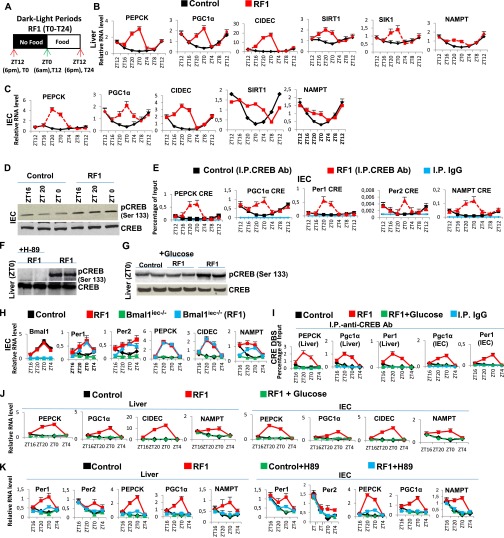
Glucagon maintains blood glucose through gluconeogenesis, which is initiated by glucagon receptor-mediated activation of protein kinase A (PKA), which then activates CREB (10). Thereafter, pCREB triggers the expression of genes involved in gluconeogenesis (steps 1–4 in Fig. 3A) (10). In keeping with the RF glucagon surge, there was indeed a pCREB increase (Fig. 2G and Fig. S6D) that led to increased expressions of CRE-containing genes (Fig. 2E and Fig. S6 B, C, and E; see Fig. 3A). NAD+ is increased in RF liver (Fig. 2F) and plays a critical role in the sirtuin1 (SIRT1)-mediated activation of peroxisome proliferator-activated receptor gamma coactivator 1-alpha (PGC1α) (10). These RF NAD+ and NAMPT [nicotinamide phosphoribosyltransferase; the rate limiting enzyme in the salvage pathway (4, 5)] increases were concomitant (Fig. S6 B and C). Note that this RF-induced increase in NAMPT expression persisted in the selective Bmal1hep−/− and Bmal1iec−/− mutants (Fig. 2H and Fig. S6H), even though Bmal1 is known to control its circadian expression (4, 5). Instead, we found that these NAMPT increases were related to an increased CREB binding to a CRE DBS (TGACGTCA) located in the NAMPT promoter (Fig. 2E and Fig. S6E; 7 in Fig. 3A). Moreover, ChIP analyses revealed an enhanced CREB binding to the CRE located in the Per1 and Per2 gene promoters (Fig. 2E and Fig. S6E) (16), which led to its increased expression during RF1 (see above). As expected, glucose administration to RF mice also prevented the RF-induced CREB activation (Fig. S6G), as well as the increased expressions of its target genes (Fig. 1 E–G and Fig. S6 I and J). Inhibiting the PKA activity by H-89 administration (17) during RF1 also prevented RF-induced CREB activation (Fig. S6F), as well as the increased expressions of its target genes (Fig. S6K), thus supporting the conclusion that the RF-induced CREB activation plays a critical role in the increased gluconeogenesis and CC alterations that occur on RF.
Fig. S6.
RF-induced temporally aberrant CREB signaling participates in both gluconeogenesis and CC alterations. (A) A schematic representation of the RF1 experiment. (B and C) RNA transcript levels of indicated genes in liver (B) and IECs (C) of control and RF1 mice. (D) Immunoblot analyses of IECs from control and RF1 mice with pCREB and CREB antibodies. (E) ChIP-qPCR assays to analyze CREB binding to the CRE DBSs present in the indicated genes in IECs of control and RF1 mice. (F) Immunoblot analyses to detect CREB phosphorylation in liver of RF1 mice i.p. treated with or without the PKA inhibitor H-89. (G) Immunoblot analyses to detect CREB phosphorylation in liver of control, RF1, and RF1+Glucose mice. (H) RNA transcript analysis of genes, as indicated, in IECs of control and RF1 mice with or without an IEC selective mutation of Bmal1 (Bmal1iec−/−). (I) ChIP-qPCR assays in livers and IECs of control, RF1, and RF1+Glucose mice to analyze CREB recruitment to the CRE DBSs present in genes as indicated. (J) RNA transcript levels of indicated genes in liver and IECs of control and RF1 and RF1+Glucose mice. (K) RNA transcript levels of indicated genes in RF1 liver and IECs on i.p. administration of the PKA inhibitor (H-89). All values are mean ± SEM.
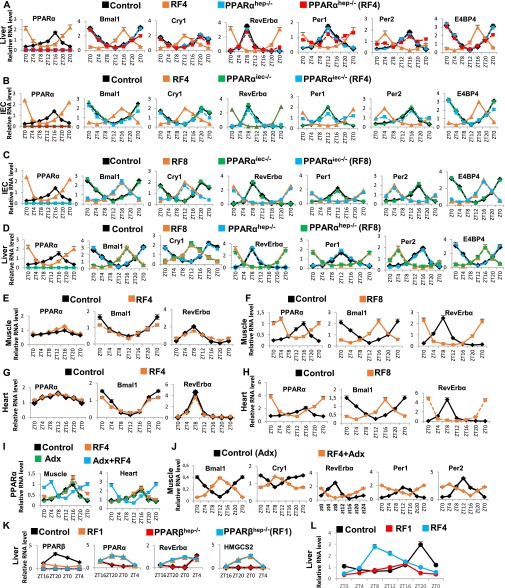
We next explored the relative contributions of FFA-PPARα-RevErbα and glucagon-CREB-Per1 and Per2 pathways in achieving the complete RF CC shift (Fig. 3 C and D). Notably, on RF4, there was no aberrant expression of RevErbα in selective PPARαhep−/− and PPARαiec−/− mutant mice (Fig. S7 A and B). However, the CREB-dependent ZT20–ZT4 increase in Per1 and Per2 expression persisted in these mutants (Fig. S7 A and B), which resulted after 8 RF days in a 4 days-delayed shift of all CC components in PPARα-ablated liver and IECs (Fig. S7 C and D), thus demonstrating that CREB activation plays an ancillary role in the RF CC shift, the major role being played by the PPARα-induced aberrant expression of RevErbα (Fig. 3C).
Fig. S7.
RF-induced PPARα activation is delayed in muscles and heart compared with liver. (A) RNA transcript levels of CC components in control and RF4 mice with or without a liver selective mutation of PPARα (PPARαhep−/−). (B) RNA transcript levels of CC components in control and RF4 mice with or without an IEC-selective PPARα mutation (PPARαiec−/−). (C) As in B, but in RF8 mice. (D) As in A, but in RF8 mice. (E) RNA transcript levels of genes, as indicated, in muscles of control and RF4 mice. (F) As in E, but in RF8 mice. (G) RNA transcript levels of genes, as indicated, in heart of control and RF4 mice. (H) As in G, but in RF8 mice. (I) RNA transcript levels of PPARα in the muscle and heart of control and RF4 mice with or without adrenalectomy (Adx). (J) RNA transcript levels of CC components in muscles of Adx mice with or without RF4. (K) RNA transcript levels of genes, as indicated, in control and RF1 mice with or without a liver-selective PPARβ mutation (PPARβhep−/−). (L) RNA transcript levels of PPARβ in the liver of control, RF1, and RF4 mice. All values are mean ± SEM.
An Increased CREB Activity in Adrenal Glands of RF Mice Leads to Extra-Corticosterone Production.
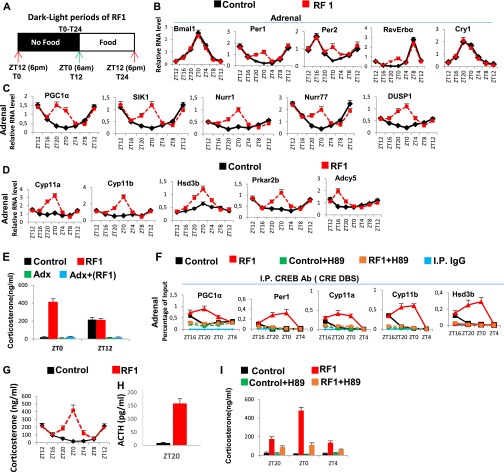
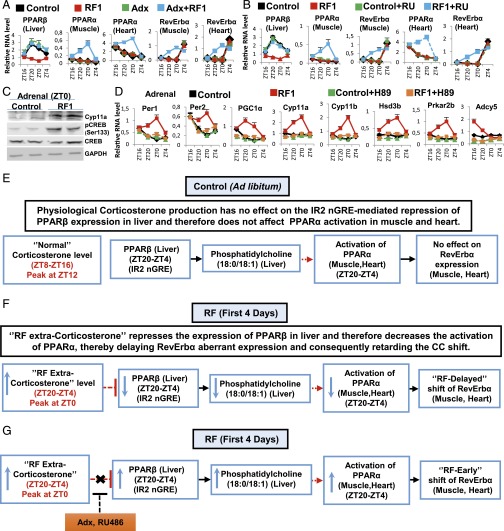
RF is known to induce during the ZT20–ZT4 period an extra peak of corticosterone production in an adrenal-dependent (Fig. S8E) (18), but SCN-independent, manner (21). However, the mechanism involved in this RF extra-corticosterone production has not been elucidated. As cAMP-PKA-CREB signaling plays, at ZT12, a critical role in physiological corticosterone production through transactivation of the numerous genes involved in corticosterone synthesis (22, 23), we investigated the role of CREB in extra-corticosterone production. We found, on RF1 night (Fig. S8A) in adrenal glands, increases in pCREB level (Fig. 5C), as well as in transcripts of various CREB target genes (Fig. S8 B and C), including those involved in corticosterone synthesis (Cyp11a, Cyp11b, Hsd3b, Prkar2b, and Adcy5; Fig. S8D). To support the role played by an increased CREB activity in RF extra-corticosterone production, the PKA activity was inhibited by H-89 administration (17), which prevented the RF-induced CREB binding to CREs present in Cyp11a, Cyp11b, and Hsd3b genes (Fig. S8F) and their ZT20–ZT4 transcription (Fig. 5D), thereby reducing the corticosterone blood level (Fig. S8I).
Fig. S8.
RF-induced temporally aberrant increase in the CREB activity in the adrenal gland is instrumental in the extra-corticosterone production. (A) Schematic representation of the L/D period of RF1. (B–D) RNA transcript levels of genes, as indicated, in adrenal glands of RF1 mice. (E) Corticosterone levels in the blood of control and RF1 mice, with or without adrenalectomy (Adx). (F) ChIP-qPCR assays in adrenal glands to analyze CREB binding to the CRE DBSs present in the indicated genes in control and RF1 mice with or without i.p. administration of PKA inhibitor H-89. (G) Circadian corticosterone production in control and RF1 mice. (H) ACTH levels in the control and RF1 mice. (I) Corticosterone blood levels in control and RF1 mice with or without the administration of the PKA inhibitor H-89. All values are mean ± SEM.
Fig. 5.
RF-induced PPARα activation is delayed in muscle and heart. (A) RNA transcript levels of genes, as indicated, in control and RF1 mice on adrenalectomy (Adx). (B) RNA transcript levels of genes, as indicated, in control and RF1 mice with or without RU486 (RU) administration. (C) Immunoblot analyses of adrenal glands in control and RF1 mice with indicated antibodies. (D) RNA transcript levels of genes as indicated in the adrenal glands of control and RF1 mice treated with or without the PKA inhibitor (H-89). (E) Physiological corticosterone production has no effect on PPARβ expression in liver, which controls the activity of PPARα in muscle and heart. (F) A schematic representation of how RF extra-corticosterone production delays the CC shift in muscle and heart. (G) A schematic representation of how adrenalectomy (Adx) or inhibition of corticosterone signaling by RU486 leads to an RF-induced early CC shift in muscle and heart. All values are mean ± SEM.
A Retarded RF-Induced CC Shift in Muscle and Heart Reflects a Delayed Activation of PPARα.
It has been reported that the RF CC shift was delayed in muscles and heart (1) and that this delay could be overcome by adrenalectomy (Adx) (18), but how corticosterone could possibly retard the CC shift in muscle and heart was unknown. We posited that a retarded activation of PPARα (relative to other tissues such as liver and IECs; see above) in muscle and heart could be at the origin of this delay. Of note, it was reported (19) that a PPARβ-dependent synthesis of phosphatidylcholine 18:0/18:1 in the liver was a prerequisite for PPARα activation in muscle and heart (but not in liver; see below). Most interestingly, we found that the liver expression of PPARβ, which was repressed on RF1, was restored by Adx or administration of the glucocorticoid antagonist RU486 (Fig. 5 A and B). Moreover, we also found that within the PPARβ promoter there is a negative glucocorticoid receptor (GR) response element (IR2 nGRE) (20), which suggested to us that the RF1 extra-corticosterone surge (ZT20–ZT4; Fig. S8G) could account for the RF1 repression of PPARβ expression. Accordingly, we found that Adx or RU486 administration, by preventing the RF1 repression of PPARβ in the liver, led to an early activation of PPARα in muscle and heart and consequently to a stimulation of RevErbα expression in these tissues during RF1, thereby accelerating the pace of the CC shift in these tissues (Fig. 5 A and B and Fig. S7 I and J; see Fig. 5 E and F). Moreover, we found that this “extra-corticosterone”-dependent PPARβ repression was relieved by RF4 because the liver PPARβ expression shifted on RF4 from ZT20–ZT4 to ZT4–ZT12 (Fig. S7L) and therefore escaped the extra-corticosterone–dependent repression, which led to a gradual increase in PPARα level (in muscle and heart), and consequently to a shift in RevErbα expression (Fig. S7 E–I and Fig. 5 E–G).
Discussion
Shifting in the Mouse Eating from the Active Phase to the Rest Phase Induces Alterations of Two Metabolic Pathways That Unequally Generate a 12-Hour Shift of PCCs.
Here we demonstrated that on RF, the shift of PCCs involves two distinct phases: (i) breaking the existing PCCs (Fig. 3C) and (ii) generating shifted PCCs (Fig. 3D). The breaking phase originates from the fasting imposed during the active phase, which by reducing INS secretion triggers an untimely increases in glucagon and FFA (Fig. 3 A and C). Importantly, in RF tissues (liver, IECs), these alterations impinge on CCs during the active phase through (i) the FFA-PPARα–dependent RevErbα expression and (ii) the glucagon-CREB–dependent Per1 and Per2 expression (Fig. 3A). Most notably, we found that glucose administration to RF mice by preventing the reduction in INS prevented the metabolic and subsequent PCC alterations (Fig. 1 D–G), thus establishing that a fasting state is in fact at the origin of the RF CC shift. Importantly, at the onset of RF, the PPARα-dependent aberrant RevErbα synthesis during the active phase breaks the existing PCCs through RORE-mediated repression of Bmal1 synthesis (see steps 1–3 in Fig. 3C). The postfeeding reduction in FFA-PPARα levels then leads to a decrease in RevErbα, an essential event that derepresses Bmal1 expression but also permanently shifts it to the ZT12–ZT20 period (step 4 in Fig. 3 C and D). Subsequently, through controlling the E-Box–mediated expression of Per1, Per2, and RevErbα, this shifted Bmal1 expression enables the emergence of a shifted repaired CC (step 5 in Fig. 3D). Notably, this whole process progressively restores a separation of 12 hours between the zenith and nadir of expression of all CC components, thus creating an RF peripheral CC oscillator, which is similar to that seen in non-RF mice, but shifted at the RNA level by 8 hours for the Bmal1, Cry1, RevErbα, and E4BP4 CC components, whereas Per1 and Per2 are shifted by 12 hours.
Importantly, we found that selective mutation of PPARα in liver and IECs delayed by 4 days the completion of their RF CC shift (Fig. S7 A–D). In these PPARα-mutant tissues, these shifts were achieved by CREB-dependent Per1 and Per2 activation. Therefore, it is the PPARα–RevErbα axis, which by perturbing the second loop of the CC oscillator (Fig. 3 B and C), efficiently drives the RF CC shift, whereas the CREB–Per1 and Per2 axis plays an ancillary role.
The RF-Generated Extra-Corticosterone Production Delays PPARα Activation in Muscle and Heart, Thereby Retarding the CC Shift in These Tissues.
Our study unveiled that the underlying basis for the RF extra-corticosterone production (18, 21) (Fig. S8G) can be ascribed to an aberrant increase in adrenal CREB activity, which induces the adrenal expression of corticosterone synthesizing genes (Fig. S8D). Importantly, this RF-induced increase in adrenal CREB activity is accompanied by a surge in adrenocorticotropic hormone (ACTH) secretion (Fig. S8H), which is known to increase the cAMP-PKA–dependent CREB activity (22). Interestingly, this RF extra-ACTH-corticosterone surge temporally coincides with an RF blood increase in the liver-derived growth factor FGF21 (Fig. 1D and Fig. S2F), which was recently found to increase the hypothalamic corticotropin-releasing hormone (CRH) and pituitary ACTH secretion and, subsequently, corticosterone production (24). Thus, the RF-dependent increase in the FGF21 level provides a rationale for the previously reported suprachiasmatic nucleus (SCN)-independent corticosterone production during RF (21).
The delayed CC shift in tissues of RF PPARα mutants (see above) suggested to us that the delayed CC shift in muscle and heart, previously reported to be lagging behind that of liver (1), could reflect a delayed activation of PPARα. As this delay disappeared in ADX mice, it was ascribed to the RF extra-corticosterone production (18). Interestingly, PPARα activation in muscle and heart is dependent on the expression of PPARβ in liver (19), which reaches its zenith at ZT20–ZT4 (Fig. 5E). Notably, we found that, during early RF, the PPARβ promoter that contains an IR2 nGRE DBS (20) is repressed in liver by extra-corticosterone–liganded GR, thus accounting for the delayed activation of PPARα in muscle and heart (Fig. S7 E–H and Fig. 5 F and G) and also providing a rationale for the glucocorticoid-dependent inertia (18) of their RF CC shift.
Methods
Mice and Treatments.
Eight- to 12-wk-old C57BL6/J male WT and adrenalectomized mice (Charles River Laboratories) were used. Control mice were provided food and water ad libitum, under 12-h light (6:00 AM–6:00 PM) and 12-h dark (6:00 PM–6:00 AM) conditions. RF mice were provided food during the entire light period (1). Breeding, maintenance, and experimental manipulations were approved by the Animal Care and Use Committee of IGBMC/ICS.
Statistics.
Data are represented as mean ± SEM of at least three independent experiments and were analyzed by SyStat and Microsoft Excel statistics software using the Student t test (RNA transcripts) and one-way ANOVA (blood metabolic analysis). P < 0.05 was considered significant.
SI Methods
Mice.
Hepatocyte-specific ablation of Bmal1 (Bmal1hep−/−), PPARα (PPARα hep−/−), RevErbα (RevErbα hep−/−), and PPARβ (PPARβ hep−/−) was achieved by crossing floxed female mice with albumin-CreERT2 floxed male mice (25), and subsequent tamoxifen injection for 5 d. IEC-selective mutants of Bmal1 (Bmal1iec−/−), PPARα (PPARαiec−/−), and RevErbα (RevErbαiec−/−) were derived by crossing floxed female mice with Villin-Cre floxed male mice (12). Bmal1 floxed mice were obtained from Jackson Laboratories [B6.129S4 (Cg)-Arntltm1Weit/J], and all other floxed mice were generated and maintained in Institut de Génétique et de Biologie Moléculaire et Cellulaire (IGBMC)/Institut Clinique de la souris (ICS). Genotyping was performed by PCR on genomic DNA isolated from mouse tails. All experiments were performed under light-dark (L/D) conditions, with ZT0 being the start of the light period (6:00 AM) and ZT12 the start of the dark period (6:00 PM). Mice were killed at 4-h interval starting from ZT12 or ZT0. Food was removed from the RF cages at 6:00 PM and reintroduced at 6:00 AM. Food intake was measured (in 12 control and 20 RF mice) by continuously measuring the weight of the food supplied for individual animals (individual pellets weighing 20 mg). Overall food intake was measured by determining the amount of the consumed per week per mouse. All mice were fed the normal laboratory chow diet.
IEC Isolation.
IECs were isolated using a modification of a nonenzymatic protocol (12, 26, 27). Briefly, ∼5- to 6-cm-long pieces of distal ileum were excised and placed in Petri dishes containing cold HBSS with 0.2% horse serum. Blood vessels and associated fat were removed, and the intestine was opened longitudinally, gently cleared of feces, and extensively washed on ice in HBSS with 1 mM DTT to remove mucus. The intestinal segments were placed in fresh PBS with 30 mM EDTA and shaken at 50 × g (37 °C for 10 min). The supernatant was transferred into a fresh tube and centrifuged (500 × g, 5 min at 4 °C), and the pellet was either immediately processed for subsequent analysis or snap frozen and stored at −70 °C for future use. The viability and purity of samples were checked by trypan blue dye exclusion and by measuring the relative transcript levels of alkaline phosphatase and Villin.
RNA Transcript Determination.
Freshly isolated IECs, liver, pancreas, adrenal glands, muscles (gastrocnemius), and heart (left ventricle) samples were used for RNA isolation using TRI reagent (Molecular Research Center). Subsequent to the verification of RNA quality (gel electrophoresis), 1 μg total RNA (determined spectrophotometrically) was reverse transcribed using random hexamers and SuperScript II reagents (Invitrogen) as per the manufacturer’s instructions. The synthesized cDNA was used for qRT-PCR with SYBRgreen (QIAGEN) and expressed relative to the hypoxanthine phosphoribosyltransferase (HPRT) levels, as previously described (12). Primer sequences are available on request. For transcript determination, four control and four RF mice were killed at each time point, and each experiment were replicated three times.
Protein Immunoblots.
Immunoblots from isolated IECs, liver, and adrenal glands were performed following standard SDS/PAGE procedures. Proteins were visualized following ECL (Pierce), and images were captured using CCD. The primary antibodies for CREB1 (Sc-25785, H-74), PPARα (Sc-9000, H-98), and pCREB-1 Ser133 (Sc-101663) were from Santa Cruz Biotechnology, whereas the Cyp11a (SH-A11435) and GAPDH antibodies were from NovateinBio and Millipore, respectively. pAkt Ser473 (4060), Akt (4685), pGSK3β Ser9 (5558), GSK3β (12456), and pRevErbα Ser55/59 (2129) were obtained from Cell Signaling Technology. Bmal1 (ab93806) antibodies was obtained from abcam.
NAD+ Measurement.
NAD+ measurement was performed from the liver extracts of control and RF1 mice (six mice per group) using the NAD/NADH colorimetric assay kit (ab65348; abcam), per the manufacturer’s instructions.
FGF21 Measurement.
FGF21 was assayed from the plasma samples obtained from the retro-orbital blood of control and RF1 mice (eight mice per group), using the FGF21 quantikine ELISA kit (R&D; MF2100) per the manufacturer’s instructions.
ChIP Assays.
ChIP was performed as previously reported (12, 15) with some minor modifications. Briefly, isolated IEC suspension in PBS was cross-linked with 1% formaldehyde for 15 min at room temperature; cross-linking was stopped with the addition of 2 M glycine (0.125 M final concentration) at room temperature for 5 min. Cells were pelleted, and 500 μL lysis buffer was added in the presence of protease inhibitors (Roche) on ice. For liver samples, identical lobes of liver from different groups of mice were disrupted using a dounce homogenizer; samples were then cross-linked and processed as described above. For adrenal glands, 12 adrenal glands were pulled and homogenized for each antibody per time point. Following cell lysis, the samples were sonicated (Bioruptor; Diagenode) to generate fragments of average length of 200–500 bp. Cellular debris were removed by centrifugation at 4 °C for 10 min (10,000 × g), and supernatant was precleared with Protein A/G-Sepharose (Roche) beads and preblocked with salmon DNA and BSA for 60 min at 4 °C. Beads were pelleted and discarded; 10% of the lysate was stored from each sample as the source of Input, and the remaining lysate was diluted eight times (five times for adrenal glands) in dilution buffer [16.7 mM Tris⋅HCl, pH 8.1, 0.01% (wt/vol) SDS, 1.1% (vol/vol) Triton X-100,1.2 mM EDTA, 16.7 mM NaCl, protease inhibitor mixture], in the presence of different primary antibodies for 14 h at 4 °C, on a flip-flop rocker. Protein A/G-Sepharose beads (90 μL; preblocked with salmon DNA and BSA) were then added for 90 min at 4 °C. Immunecomplexes were recovered by centrifugation at 500 × g for 1 min. Beads were washed extensively at 4 °C in low salt buffer [20 mM Tris⋅HCl, pH 8.1, 0.1% (wt/vol) SDS, 1% (vol/vol) Triton X-100, 2 mM EDTA, 150 mM NaCl], in high salt buffer [20 mM Tris⋅HCl, pH 8.1, 0.1% (wt/vol) SDS, 1% (vol/vol) Triton X-100, 2 mM EDTA, 500 mM NaCl], and in LiCl buffer [10 mM Tris⋅HCl, pH 8.1, 250 mM LiCl, 1% (vol/vol) Nonidet P-40, 1% (wt/vol) sodium deoxycholate, 1 mM EDTA], and finally in 1 mL TE buffer (10 mM Tris⋅HCl, pH 8.0, 1 mM EDTA). The bound chromatin was released from the beads by intermittent vortexing at room temperature in 200 μL elution buffer [1 (wt/vol) SDS and 100 mM NaHCO3]. One milliliter of 10 mg/mL RnaseA and 5 M NaCl (200 mM final concentration) was added to the eluate and incubated overnight at 65 °C and then treated with Proteinase K for 1 h at 55 °C; DNA was purified using the QIAGEN PCR purification kit in a final volume of 50 μL. The qPCR was done using this eluted DNA and SYBRgreen reagent (QIAGEN). PCR cycles were verified to be within the linear range of amplification. Primer sequences are available on request. Antibodies used in ChIP assays were as follows: CREB-1 (H74x, sc-25785x; Santa Cruz Biotechnology), PPARα (ab2779, 3B6/PPAR; abcam), and Bmal1 (ab3350; abcam).
Plasma Metabolic Analysis.
Blood glucose, insulin, glucagon, ACTH, corticosterone, TG, FFA, and βOHB (ketone bodies) levels were measured from control and RF mice (eight mice per group per time point) at indicated ZTs. Blood glucose levels were determined on blood collected from the tail vein using a handheld Accu-check active glucometer (Roche). For all other measurements, blood was collected by retro-orbital puncture in EDTA-coated vials, plasma was separated, and measurements were done in the metabolomics unit of the IGBMC/ICS. For the experiments involving glucose administration to RF mice, following food withdrawal at ZT12, glucose (2 g/kg) was i.p. administered to one group of RF mice (RF+Glucose) at ZT15. The RF+Glucose mice were provided food at ZT0 (6:00 AM), simultaneously with the RF mice.
Acknowledgments
We thank the staffs of animal house facilities in Institut de Génétique et de Biologie Moléculaire et Cellulaire (IGBMC)/Institut Clinique de la souris (ICS) for help and Marie-France Champy (ICS) for help in metabolic analysis. This work was supported by the Centre national de la recherche scientifique (CNRS), Institut national de la santé et de la recherche médicale (INSERM), University of Strasbourg Institute for Advanced Studies, and the Association pour la Recherche à l’IGBMC (ARI). A.M. and A.K. were supported by fellowships from ARI.
Footnotes
The authors declare no conflict of interest.
This article contains supporting information online at www.pnas.org/lookup/suppl/doi:10.1073/pnas.1519735112/-/DCSupplemental.
References
- 1.Damiola F, et al. Restricted feeding uncouples circadian oscillators in peripheral tissues from the central pacemaker in the suprachiasmatic nucleus. Genes Dev. 2000;14(23):2950–2961. doi: 10.1101/gad.183500. [DOI] [PMC free article] [PubMed] [Google Scholar]
- 2.Stokkan KA, Yamazaki S, Tei H, Sakaki Y, Menaker M. Entrainment of the circadian clock in the liver by feeding. Science. 2001;291(5503):490–493. doi: 10.1126/science.291.5503.490. [DOI] [PubMed] [Google Scholar]
- 3.Asher G, Schibler U. Crosstalk between components of circadian and metabolic cycles in mammals. Cell Metab. 2011;13(2):125–137. doi: 10.1016/j.cmet.2011.01.006. [DOI] [PubMed] [Google Scholar]
- 4.Bass J, Takahashi JS. Circadian integration of metabolism and energetics. Science. 2010;330(6009):1349–1354. doi: 10.1126/science.1195027. [DOI] [PMC free article] [PubMed] [Google Scholar]
- 5.Asher G, Sassone-Corsi P. Time for food: The intimate interplay between nutrition, metabolism, and the circadian clock. Cell. 2015;161(1):84–92. doi: 10.1016/j.cell.2015.03.015. [DOI] [PubMed] [Google Scholar]
- 6.Vollmers C, et al. Time of feeding and the intrinsic circadian clock drive rhythms in hepatic gene expression. Proc Natl Acad Sci USA. 2009;106(50):21453–21458. doi: 10.1073/pnas.0909591106. [DOI] [PMC free article] [PubMed] [Google Scholar]
- 7.Asher G, et al. Poly(ADP-ribose) polymerase 1 participates in the phase entrainment of circadian clocks to feeding. Cell. 2010;142(6):943–953. doi: 10.1016/j.cell.2010.08.016. [DOI] [PubMed] [Google Scholar]
- 8.Saini C, et al. Real-time recording of circadian liver gene expression in freely moving mice reveals the phase-setting behavior of hepatocyte clocks. Genes Dev. 2013;27(13):1526–1536. doi: 10.1101/gad.221374.113. [DOI] [PMC free article] [PubMed] [Google Scholar]
- 9.Saltiel AR, Kahn CR. Insulin signalling and the regulation of glucose and lipid metabolism. Nature. 2001;414(6865):799–806. doi: 10.1038/414799a. [DOI] [PubMed] [Google Scholar]
- 10.Altarejos JY, Montminy M. CREB and the CRTC co-activators: Sensors for hormonal and metabolic signals. Nat Rev Mol Cell Biol. 2011;12(3):141–151. doi: 10.1038/nrm3072. [DOI] [PMC free article] [PubMed] [Google Scholar]
- 11.Kersten S, Desvergne B, Wahli W. Roles of PPARs in health and disease. Nature. 2000;405(6785):421–424. doi: 10.1038/35013000. [DOI] [PubMed] [Google Scholar]
- 12.Mukherji A, Kobiita A, Ye T, Chambon P. Homeostasis in intestinal epithelium is orchestrated by the circadian clock and microbiota cues transduced by TLRs. Cell. 2013;153(4):812–827. doi: 10.1016/j.cell.2013.04.020. [DOI] [PubMed] [Google Scholar]
- 13.Mukherji A, et al. Shifting eating to the circadian rest phase misaligns the peripheral clocks with the master SCN clock and leads to a metabolic syndrome. Proc Natl Acad Sci USA. 2015;112:E6691–E6698. doi: 10.1073/pnas.1519807112. [DOI] [PMC free article] [PubMed] [Google Scholar]
- 14.Duez H, Staels B. Rev-erb α gives a time cue to metabolism. FEBS Lett. 2008;582(1):19–25. doi: 10.1016/j.febslet.2007.08.032. [DOI] [PubMed] [Google Scholar]
- 15.Koike N, et al. Transcriptional architecture and chromatin landscape of the core circadian clock in mammals. Science. 2012;338(6105):349–354. doi: 10.1126/science.1226339. [DOI] [PMC free article] [PubMed] [Google Scholar]
- 16.Travnickova-Bendova Z, Cermakian N, Reppert SM, Sassone-Corsi P. Bimodal regulation of mPeriod promoters by CREB-dependent signaling and CLOCK/BMAL1 activity. Proc Natl Acad Sci USA. 2002;99(11):7728–7733. doi: 10.1073/pnas.102075599. [DOI] [PMC free article] [PubMed] [Google Scholar]
- 17.Mao T, et al. PKA phosphorylation couples hepatic inositol-requiring enzyme 1α to glucagon signaling in glucose metabolism. Proc Natl Acad Sci USA. 2011;108(38):15852–15857. doi: 10.1073/pnas.1107394108. [DOI] [PMC free article] [PubMed] [Google Scholar]
- 18.Le Minh N, Damiola F, Tronche F, Schütz G, Schibler U. Glucocorticoid hormones inhibit food-induced phase-shifting of peripheral circadian oscillators. EMBO J. 2001;20(24):7128–7136. doi: 10.1093/emboj/20.24.7128. [DOI] [PMC free article] [PubMed] [Google Scholar]
- 19.Liu S, et al. A diurnal serum lipid integrates hepatic lipogenesis and peripheral fatty acid use. Nature. 2013;502(7472):550–554. doi: 10.1038/nature12710. [DOI] [PMC free article] [PubMed] [Google Scholar]
- 20.Surjit M, et al. Widespread negative response elements mediate direct repression by agonist-liganded glucocorticoid receptor. Cell. 2011;145(2):224–241. doi: 10.1016/j.cell.2011.03.027. [DOI] [PubMed] [Google Scholar]
- 21.Krieger DT, Hauser H, Krey LC. Suprachiasmatic nuclear lesions do not abolish food-shifted circadian adrenal and temperature rhythmicity. Science. 1977;197(4301):398–399. doi: 10.1126/science.877566. [DOI] [PubMed] [Google Scholar]
- 22.Spiga F, Liu Y, Aguilera G, Lightman SL. Temporal effect of adrenocorticotrophic hormone on adrenal glucocorticoid steroidogenesis: Involvement of the transducer of regulated cyclic AMP-response element-binding protein activity. J Neuroendocrinol. 2011;23(2):136–142. doi: 10.1111/j.1365-2826.2010.02096.x. [DOI] [PMC free article] [PubMed] [Google Scholar]
- 23.Mueller M, et al. Differential regulation of glucocorticoid synthesis in murine intestinal epithelial versus adrenocortical cell lines. Endocrinology. 2007;148(3):1445–1453. doi: 10.1210/en.2006-0591. [DOI] [PubMed] [Google Scholar]
- 24.Bookout AL, et al. FGF21 regulates metabolism and circadian behavior by acting on the nervous system. Nat Med. 2013;19(9):1147–1152. doi: 10.1038/nm.3249. [DOI] [PMC free article] [PubMed] [Google Scholar]
- 25.Schuler M, Dierich A, Chambon P, Metzger D. Efficient temporally controlled targeted somatic mutagenesis in hepatocytes of the mouse. Genesis. 2004;39(3):167–172. doi: 10.1002/gene.20039. [DOI] [PubMed] [Google Scholar]
- 26.Cima I, et al. Intestinal epithelial cells synthesize glucocorticoids and regulate T cell activation. J Exp Med. 2004;200(12):1635–1646. doi: 10.1084/jem.20031958. [DOI] [PMC free article] [PubMed] [Google Scholar]
- 27.Greten FR, et al. IKKbeta links inflammation and tumorigenesis in a mouse model of colitis-associated cancer. Cell. 2004;118(3):285–296. doi: 10.1016/j.cell.2004.07.013. [DOI] [PubMed] [Google Scholar]


