

Abstract
Aims
Global longitudinal strain (GLS) assessed by speckle-tracking echocardiography has been proposed as a parameter able to reflect early changes in left ventricular (LV) systolic function at a stage when LV ejection fraction (LVEF) is still normal. This study aimed at assessing prevalence and prognostic value of LV systolic dysfunction (LVSD) assessed by echocardiographic speckle-tracking GLS in a community-based cohort.
Methods and Results
Participants from the community-based prospective Northern Manhattan Study underwent 2-dimensional transthoracic echocardiography as part of the Cardiovascular Abnormalities and Brain Lesions study. LV systolic function was assessed by LVEF and speckle-tracking GLS. Subjects were followed annually (mean=4.8±1.5 years) and incident vascular events (ischemic stroke, myocardial infarction, and vascular death) were reviewed and adjudicated. Of the 708 study participants, 114 (16.1%) had abnormal GLS but normal LVEF (GLS-LVSD), 30 (4.2%) had abnormal LVEF (LVEF-LVSD), and 564 (79.7%) had normal GLS and LVEF (no-LVSD). In multivariate analysis, risk of events was significantly greater in GLS-LVSD [adjusted hazard ratio (HR)=2.39, 95% confidence intervals (CI)=1.20–4.77] and in LVEF-LVSD (adjusted HR=3.51, 95% CI=1.25–9.88) compared to no-LVSD. Among participants with normal LVEF, lower GLS was significantly associated with events (adjusted HR/unit decrease=1.15, 95% CI=1.03–1.28) whereas LVEF was not (adjusted HR/unit decrease=1.01, 95% CI=0.94–1.07). GLS prognostic value was incremental to risk factors and LVEF both in the overall population (chi-square change=7.406, p=0.006) and in participants with normal LVEF (chi-square change=6.357, p=0.012).
Conclusion
In a community-based cohort, GLS-LVSD was four times more frequent than LVEF-LVSD. GLS-LVSD was a powerful and independent predictor of cardiovascular events. LV function assessment by GLS may improve cardiovascular risk stratification in subjects with normal LVEF.
Keywords: Left ventricular systolic dysfunction, global longitudinal strain, ejection fraction, outcome
INTRODUCTION
Left ventricular (LV) ejection fraction (LVEF) by echocardiography is the cornerstone of LV systolic function assessment in clinical practice. Large epidemiology studies have shown that the prevalence of LV systolic dysfunction (LVSD), defined as a reduced LVEF, progressively increases with age, and ranges from 1.7% to 14% depending on the characteristics of the studied population and on the cutoff considered for abnormal LVEF definition.1–10 LVSD is associated with cardiovascular risk factors, and is more frequent among subjects with an established diagnosis of cardiac disease; however, most individuals with LVSD in population studies did not have a previous history of cardiac disease or heart failure symptoms.5,8 LVSD, even when not associated with a definite diagnosis of heart failure or history of heart disease, has been demonstrated to be a predictor of unfavorable cardiovascular outcome.1,5,7,11
In recent years, myocardial tissue deformation analysis by echocardiographic speckle-tracking imaging has provided new insights in the cardiac function assessment. LV global longitudinal strain (GLS), a measure of the LV myocardial systolic deformation over the longitudinal axis, has proved to be able to detect early LV systolic dysfunction in a variety of conditions, even when LVEF is still in the normal range.12,13 Studies in selected samples of patients with cardiac diseases have shown that GLS is a predictor of cardiovascular outcome, and that its prognostic value is independent of and additive to LVEF.14,15 However, it is not known whether GLS is associated with cardiovascular outcomes in a population setting in the context of normal LVEF. Accordingly, the aims of the present study were: 1) to evaluate the prevalence of LVSD by GLS in a community-based cohort of middle-aged to elderly individuals, and 2) to assess the association of LVSD assessed by GLS with the future occurrence of cardiovascular events.
METHODS
Study population
The Cardiovascular Abnormalities and Brain Lesion (CABL) study is a community-based epidemiologic study designed to investigate the cardiovascular predictors of silent cerebrovascular disease in the community. CABL based its recruitment on the Northern Manhattan Study (NOMAS), a population-based prospective study designed to investigate the epidemiology and risk factors for stroke and cardiovascular disease that enrolled 3,298 participants from the community living in northern Manhattan between 1993 and 2001. The study design and recruitment details of NOMAS have been described previously.16 Beginning in 2003, participants were invited to participate in a brain MRI substudy if they: 1) were at least 50 years of age; 2) had no contraindications to MRI; and 3) did not have a prior diagnosis of stroke. From September 2005 to July 2010, NOMAS MRI participants that voluntarily agreed to undergo an extensive cardiovascular evaluation were included in CABL. Of the 1,004 CABL participants, 151 had either no digitally acquired echocardiographic study or no raw data for speckle-tracking assessment. Of the remaining 854 participants, 125 were excluded because of suboptimal image quality for speckle-tracking analysis. Twenty participants were excluded because an event occurred before enrollment in the study, leading to the final study sample of 708 (Figure 1). Among the excluded participants with no events at enrollment, 8 subjects had LVEF<50% and there were a total of 22 events.. Written informed consent was obtained from all study participants. The study complies with the Declaration of Helsinki, and was approved by the Institutional Review Boards of Columbia University Medical Center and of the University of Miami.
Figure 1.
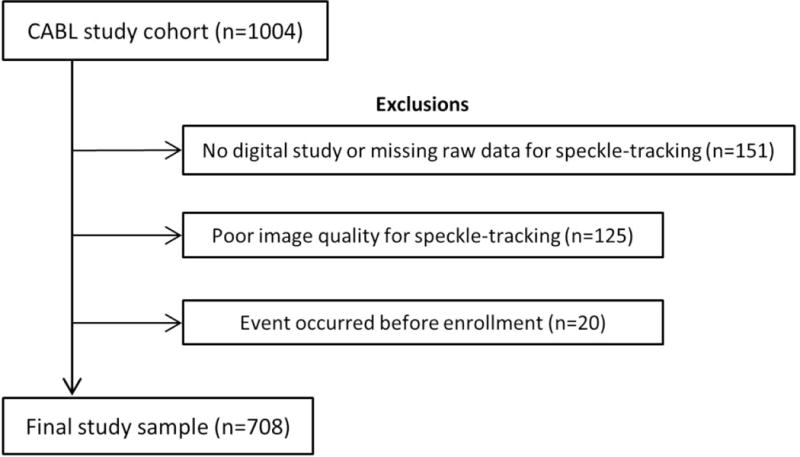
Flow diagram showing selection of the present study population from the original CABL cohort.
Baseline assessment
Cardiovascular risk factors were ascertained through direct examination and interview by trained research assistants as previously described.16 Hypertension was defined as systolic blood pressure (SBP)≥140 mmHg or diastolic blood pressure (DBP)≥90 mmHg, or self-reported history of hypertension or use of anti-hypertensive medication. Diabetes mellitus was defined as fasting blood glucose ≥126 mg/dL or self-reported history of diabetes or use of diabetes medications. Hypercholesterolemia was defined as total serum cholesterol >240 mg/dL, self-report of hypercholesterolemia or use of lipid-lowering treatment. Cigarette smoking, either at the time of the interview or in the past, was recorded. Coronary artery disease was defined as history of myocardial infarction, coronary artery bypass grafting, or percutaneous coronary intervention. Atrial fibrillation was defined from ECG at the time of echocardiography or from self-reported history. The race-ethnicity classification was based on self-identification, and modeled after the U.S. Census.
Echocardiographic assessment and definition of LVSD
Two-dimensional echocardiography
Transthoracic echocardiography was performed using a commercially available system (iE 33, Philips, Andover, MA) by a trained, registered cardiac sonographer according to a standardized protocol. Interventricular septum and posterior wall thickness, LV end-diastolic diameter, and left atrial antero-posterior diameter were measured from a parasternal long-axis view according to the recommendations of the American Society of Echocardiography.17 LV end-diastolic diameter (LVEDi) was indexed by body surface area. LVEF was calculated using the biplane modified Simpson’s rule. LVSD by LVEF (LVEF-LVSD) was defined as a LVEF<50%.11 LV mass was calculated with a validated method18 and indexed by body surface area (LV mass index). LV relative wall thickness was calculated as: 2 × posterior wall thickness/LV end-diastolic diameter. Left atrial volume was assessed by three-dimensional echocardiography and indexed by body surface area.19 Significant valvular disease was defined as regurgitation or stenosis of mitral or aortic valve of more than mild degree. LV diastolic function assessment has been previously described.19,20 Briefly, in apical 4-chamber view, pulsed-wave Doppler sample volume was placed at the level of mitral valve leaflet tips to sample trans-mitral inflow. Peak early velocity (E), its deceleration time (DT), and late velocity (A) of mitral inflow were measured, and the E/A ratio was calculated. Mitral annular velocities were evaluated by pulsed-wave tissue-Doppler imaging from the apical 4-chamber view. Peak early diastolic velocity (e′) of the lateral and septal mitral annulus were measured and averaged. Diastolic dysfunction was defined as: E/A ≤ 0.7 or DT>260 ms; or E/A between 0.7–1.5 and e′ < 7 cm/s; or E/A > 1.5 and e′ < 7 cm/s or DT<140 ms.
Speckle-tracking strain imaging
Speckle-tracking analysis was performed off-line using commercially available software (Philips QLAB Advanced Quantification Software version 8.1) as previously described.21 Briefly, analysis of LV myocardial deformation over the longitudinal axis was performed from two-dimensional gray-scale loops by automatic tracking of myocardial speckles after manual selection of landmark points. Global longitudinal systolic strain (GLS) was calculated averaging the negative peak of longitudinal strain from 12 ventricular segments from the apical 4-chamber and 2-chamber views. At least two cardiac cycles were recorded at a frame rate ≥ 45 fps, and were averaged for strain analysis. Aortic valve opening and closing times were measured from the LV outflow Doppler profile and were incorporated in the speckle-tracking strain profile in order to exclude post-systolic components. Because GLS is represented by negative values, with more negative numbers expressing greater systolic shortening and therefore better function, we adopted the terminology “lower GLS” referring to less negative values, therefore expressing smaller systolic shortening. Normal GLS values were derived from a healthy subgroup of participants free of hypertension, diabetes mellitus, coronary artery disease, arrhythmias, and with body mass index ≤ 25 kg/m2; mean GLS in the healthy reference sample was −18.1±2.4%, and the value identifying the lower 5% of the normal GLS distribution was used to define abnormal GLS (95th percentile= −14.7%). Reproducibility of speckle-tracking measurements has been reported previously.22
Follow-up and outcome evaluation
All subjects were followed-up annually by telephone interviews. Any vascular event or acknowledgment of neurological or cardiac symptoms during the standardized interview triggered an in-person assessment. In addition, active hospital surveillance of admission and discharge ICD-9 codes was performed. Outcomes were ischemic stroke, myocardial infarction, and vascular death. Stroke was defined by the first symptomatic occurrence of any type of stroke as defined by TOAST criteria.23 Diagnosis of ischemic stroke was determined by two neurologists independently, and disagreements were adjudicated by the NOMAS principal investigators (RLS/MSVE). Myocardial infarction was defined by criteria adapted from the Cardiac Arrhythmia Suppression Trial24 and the Lipid Research Clinics Coronary Primary Prevention trial25 and adjudicated by a study team cardiologist. Death was classified as either vascular or nonvascular based on information from family, medical records, death certificate, and primary care physicians. Vascular causes of death were stroke, myocardial infarction, heart failure, pulmonary embolus, cardiac arrhythmia, and other vascular causes.
Statistical analysis
Data are presented as means ± standard deviation for continuous variables and as percentages for categorical variables. The t-test, one-way ANOVA, and Chi-square tests were used to assess differences between groups with different LV systolic function. Cox proportional hazards models were used to test the association of parameters of LV function with incident cardiovascular events, and hazard ratios (HR) and 95% confidence intervals (CI) were reported. Multivariate models were built selecting covariates from their univariate association with LVSD. The likelihood ratio test was used with a series of nested Cox proportional hazards models to examine the incremental value of LVEF and GLS in the prediction of events. Kaplan-Meier plots were created to analyze event-free probability in LVSD groups vs. no LVSD. The event rates were estimated with the Kaplan-Meier method. For all statistical analyses, a two-tailed p<0.05 was considered significant. Statistical analyses were performed using SAS software version 9.3 (SAS Institute Inc., Cary, NC).
RESULTS
Prevalence of LVSD and baseline characteristics of the study population
Mean age of the study population (n=708) was 71±9 years, 61% were women, 66.8% were Hispanics, 17.1% blacks, 14.1% whites, and 2% of other race-ethnicities. Thirty participants (4.2%) had an abnormal LVEF (LVEF-LVSD). Among participants with normal LVEF, 114 (16.8%) had abnormal GLS (GLS-LVSD), and 564 had normal GLS (no LVSD). The prevalence of LVSD progressively increased with age, with GLS-LVSD showing higher prevalence than LVEF-LVSD in all age groups (Figure 2). Demographics and clinical characteristics of the study participants are shown in Table 1. Subjects in LVSD groups were significantly older than those without LVSD and had higher rates of hypertension. Participants with GLS-LVSD showed higher values of SBP and DBP, and higher prevalence of diabetes mellitus compared to those with no LVSD. Participants with LVEF-LVSD were more frequently males compared to the other groups.
Figure 2.
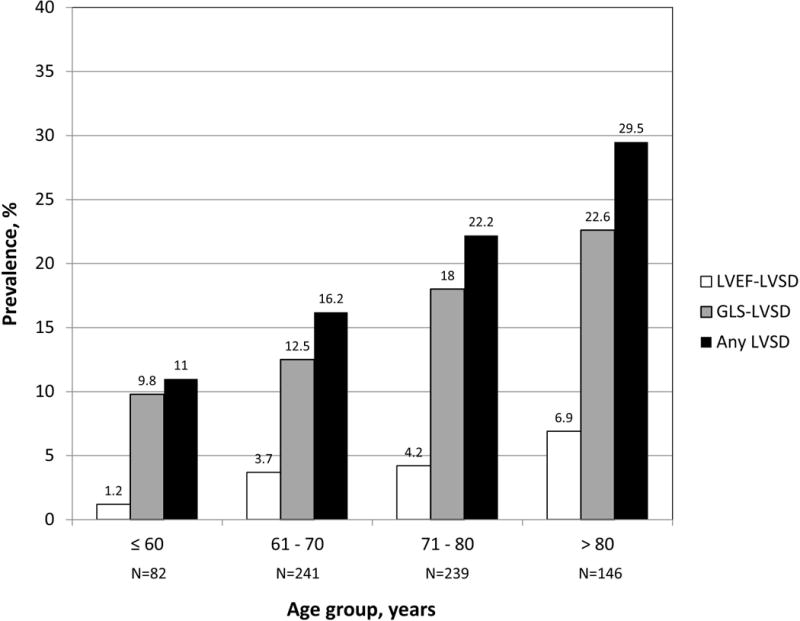
Prevalence of LVSD by age.
Table 1.
Demographics and clinical characteristics of the study population by LV systolic function categories
| No LVSD (N=564) | GLS-LVSD (N=114) | LVEF-LVSD (N=30) | Overall test P value | |
|---|---|---|---|---|
| Age, years | 70.7±9.4 | 73.7±9.4* | 75.5±9.3* | <0.001 |
| Women, n (%) | 351 (62.2) | 69 (60.5) | 11 (36.7)*† | 0.020 |
| Body mass index, kg/m2 | 27.6±4.7 | 28.6±4.4 | 27.2±4.0 | 0.085 |
| SBP, mmHg | 134.2±16.4 | 140.9±16.6* | 133.0±17.3† | <0.001 |
| DBP, mmHg | 77.6±9.2 | 81.4±9.9* | 77.4±10.4† | <0.001 |
| Hypertension, n (%) | 418 (74.1) | 102 (89.5)* | 28 (93.3)* | <0.001 |
| Anti-hypertensive treatment | ||||
| ACE-inhibitors/ARBs, n (%) | 159 (28.2) | 31 (27.2) | 11 (36.7) | 0.576 |
| Beta-blockers, n (%) | 123 (21.8) | 42 (36.8) | 12 (40.0) | <0.001 |
| Diuretics, n (%) | 115 (20.4) | 26 (22.8) | 6 (20.0) | 0.840 |
| Ca-channel blockers, n (%) | 153 (27.1) | 46 (40.4) | 10 (33.3) | 0.017 |
| Diabetes mellitus, n (%) | 142 (25.2) | 47 (41.2)* | 8 (26.7) | 0.002 |
| Hypercholesterolemia, n (%) | 359 (63.7) | 81 (71.7) | 22 (73.3) | 0.168 |
| Smoking history, n (%) | 300 (53.2) | 54 (47.4) | 20 (66.7) | 0.157 |
| Coronary artery disease, n (%) | 24 (4.3) | 10 (8.8) | 2 (6.7) | 0.124 |
| Atrial fibrillation, n (%) | 24 (4.3) | 14 (12.3)* | 3 (10.0) | 0.002 |
LVSD: LV systolic dysfunction. LVEF: LV ejection fraction. GLS: Global longitudinal strain. SBP: Systolic blood pressure. DBP: Diastolic blood pressure.
Pairwise comparisons:
p<0.05 vs. no LVSD.
p<0.05 vs. GLS-LVSD.
Echocardiographic characteristics of the three groups are shown in table 2. LV wall thickness was greater in both LVSD groups than in no LVSD, LVEDi was greater in the LVEF-LVSD group than in the other groups, LV mass index was greater in GLS-LVSD than in no LVSD and was greatest in LVEF-LVSD. Relative wall thickness was greater in GLS-LVSD and smaller in LVEF-LVSD compared to no LVSD. Left atrial volume index was greater in LVEF-LVSD than in the other groups. E/A was lower, E/e’ was higher, and diastolic dysfunction was more prevalent in both LVSD groups compared with no LVSD.
Table 2.
Echocardiographic data by LV systolic function categories
| No-LVSD (N=564) | GLS-LVSD (N=114) | LVEF-LVSD (N=30) | Overall test P value | |
|---|---|---|---|---|
| LV septal thickness, mm | 11.1±1.7 | 12.2±1.7* | 11.9±1.7* | <0.001 |
| LVEDi, mm/m2 | 25.5±2.9 | 25.1±3.2 | 28.6±4.2*† | <0.001 |
| LV posterior wall thickness, mm | 10.9±1.5 | 11.7±1.4* | 11.7±1.4* | <0.001 |
| LV mass index, g/m2 | 99.6±23.6 | 110.1±26.1* | 132.4±26.7*† | <0.001 |
| Relative wall thickness | 0.50±0.08 | 0.53±0.09* | 0.46±0.08*† | <0.001 |
| LVEF, % | 64.6±4.8 | 63.7±5.0 | 40.9±9.6*† | <0.001 |
| GLS, % | −18.2±2.4 | −12.8±1.8* | −12.6±4.2* | <0.001 |
| Left atrial volume index, ml/m2 | 24.3±7.3 | 25.2±8.4 | 28.4±9.6*† | 0.015 |
| E/A | 0.85±0.24 | 0.78±0.30* | 0.73±0.26* | 0.003 |
| E/e′ | 9.99±3.1 | 11.1±3.4* | 11.3±4.8 | 0.001 |
| Diastolic dysfunction, n (%) | 284 (50.6) | 81 (71.7)* | 26 (86.7)* | <0.001 |
| Significant valve disease, n (%) | 42 (7.5) | 10 (8.8) | 3 (10.0) | 0.804 |
LV: Left ventricular. LVSD: LV systolic dysfunction. LVEF: LV ejection fraction. GLS: Global longitudinal strain. LVEDi: LV end-diastolic dimension index.
Pairwise comparisons:
p<0.05 vs. no LVSD.
p<0.05 vs. GLS-LVSD.
LVSD and cardiovascular events
During an average follow-up period of 4.8 years (minimum 0.06, maximum 7.38 years), 58 total cardiovascular events were recorded, including 10 myocardial infarctions, 16 ischemic strokes, and 32 vascular deaths. Kaplan-Meier estimates of event rates were: 32.9% [standard error (SE)=15.3%] in the GLS-LVSD group, 29.1% (SE=11.3%) in the LVEF-LVSD group, and 7.45% (SE=2.16%) in the no LVSD group. Event-free survival curves in participants with any LVSD vs. no LVSD are shown in figure 3A. Participants with any LVSD showed a significantly higher risk of cardiovascular events during the follow-up period, with a HR=3.52 (95% CI=1.99–6.23, p<0.001). In multivariate analysis, adjusted HR for cardiovascular events associated with any LVSD was 2.59 (95% CI=1.36–4.93, p=0.004). Event-free survival probability in participants with GLS-LVSD and LVEF-LVSD vs. no LVSD are shown in figure 3B. The risk of cardiovascular events was significantly higher in subjects with GLS-LVSD (HR=3.22, 95% CI=1.74–5.98) and in those with LVEF-LVSD (HR=4.84, 95% CI=1.97–11.88) compared to those with no LVSD (table 3, model 1). In multivariate analysis, both GLS-LVSD (adjusted HR=2.39, 95% CI=1.20–4.77) and LVEF-LVSD (adjusted HR=3.51, 95% CI=1.25–9.88) remained significantly associated with events compared to those with no LVSD (table 3, models 2 and 3).
Figure 3A.
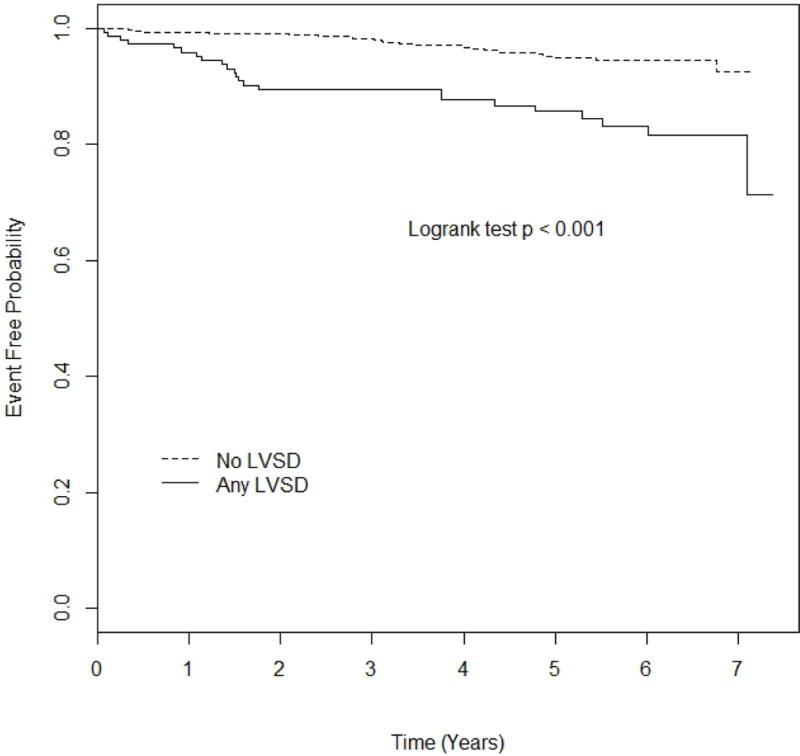
Kaplan-Meier plot comparing event-free probability in participants with any LVSD vs. no LVSD.
Figure 3B.
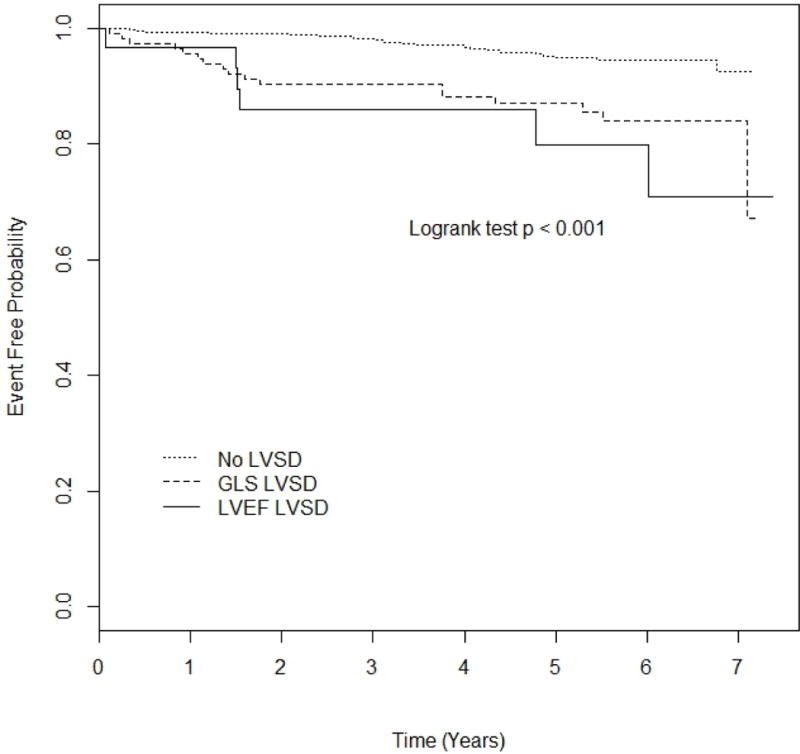
Kaplan-Meier plot comparing event-free probability in participants with LVEF-LVSD, GLS-LVSD, and no LVSD.
Table 3.
Risk of cardiovascular events associated with LVSD detected by GLS and by LVEF.
| Model 1 | Model 2 | Model 3 | ||||
|---|---|---|---|---|---|---|
| HR (95% CI) | P value | HR (95% CI) | P value | HR (95% CI) | P value | |
|
|
|
|
||||
| No LVSD | Reference | – | Reference | – | Reference | – |
| LVEF-LVSD | 4.84 (1.97–11.88) | <0.001 | 3.23 (1.29–8.08) | 0.012 | 3.51 (1.25–9.88) | 0.017 |
| GLS-LVSD | 3.22 (1.74–5.98) | <0.001 | 2.62 (1.41–4.88) | 0.002 | 2.39 (1.20–4.77) | 0.014 |
HR: Hazard ratio. CI: Confidence intervals. GLS: Global longitudinal strain. LVEF: Left ventricular ejection fraction. LVSD: LV systolic dysfunction. Model 1: Unadjusted. Model 2: adjusted for age and sex. Model 3: adjusted for age, sex, SBP, DBP, hypertension, anti-hypertensive medications, diabetes, LV mass index, relative wall thickness, left atrial volume index, diastolic dysfunction, and atrial fibrillation.
The association of LVEF and GLS with cardiovascular events was also assessed in the 678 study participants with normal LVEF (table 4). In this group, LVEF was not predictive of cardiovascular events (HR/unit decrease=1.03, 95% CI=0.96–1.09), whereas GLS showed significant associations with outcome in both univariate (HR/unit decrease=1.24, 95% CI=1.12–1.37) and multivariate analysis (adjusted HR/unit decrease=1.15, 95% CI 1.03–1.28). Further adjustment for LVEF did not affect the predictive value of GLS.
Table 4.
LV systolic function parameters and risk of combined vascular events (myocardial infarction, ischemic stroke, vascular death) in participants with normal LVEF (n=678).
| Model 1 | Model 2 | Model 2 + LVEF | ||||
|---|---|---|---|---|---|---|
| HR (95% CI) | P value | HR (95% CI) | P value | HR (95% CI) | P value | |
|
|
|
|
||||
| LVEF | 1.03 (0.96–1.09) | 0.413 | 1.01 (0.94–1.07) | 0.844 | – | – |
| GLS | 1.24 (1.12–1.37) | <0.001 | 1.15 (1.03–1.28) | 0.012 | 1.15 (1.03–1.28) | 0.012 |
HR: Hazard ratio (per unit decrease). CI: Confidence intervals. GLS: Global longitudinal strain. LVEF: Left ventricular ejection fraction. Model 1: Unadjusted. Model 2: Adjusted for age, sex, SBP, DBP, hypertension, anti-hypertensive medications, diabetes, LV mass index, relative wall thickness, left atrial volume index, diastolic dysfunction, and atrial fibrillation.
The likelihood ratio test (table 5) showed that LVEF did not increase the predictive value of a model that already included risk factors, whereas the prognostic value of GLS towards cardiovascular events was incremental to risk factors and LVEF both in the overall population (chi-square change=7.406, p=0.006) and in the sub-group with normal LVEF (chi-square change=6.357, p=0.012).
Table 5.
Likelihood ratio test showing the incremental prognostic value of GLS for cardiovascular events over cardiovascular risk factors and LVEF.
| Overall population | Risk factors* | Risk factors + LVEF | Risk factors + LVEF + GLS |
|---|---|---|---|
|
|
|||
| −2 LOG likelihood | 514.118 | 512.330 | 504.923 |
| Chi-square (change vs. previous step) | Reference | +1.789 | +7.406 |
| Degrees of freedom (change vs. previous step) | – | +1 | +1 |
| p-value vs. previous step | – | 0.181 | 0.006 |
|
| |||
| Participant with normal LVEF | |||
| −2 LOG likelihood | 442.264 | 442.226 | 435.869 |
| Chi-square (change vs. previous step) | Reference | +0.039 | +6.357 |
| Degrees of freedom (change vs. previous step) | – | +1 | +1 |
| p-value vs. previous step | – | 0.844 | 0.012 |
Risk factors: age, sex, SBP, DBP, hypertension, anti-hypertensive medications, diabetes, LV mass index, relative wall thickness, left atrial volume index, diastolic dysfunction, and atrial fibrillation.
DISCUSSION
In this study, we investigated the prevalence of LVSD combining conventional echocardiographic assessment and speckle-tracking imaging in a community-based cohort of middle-aged and elderly individuals. In our study population, the prevalence abnormal LVEF was 4.2%; however, an impaired GLS was present in 16.8% of subjects with normal LVEF. Thus, the application of speckle-tracking imaging to a large cohort study allowed the identification of a significant number of individuals with subclinical LV dysfunction that was otherwise undetected by traditional LVEF assessment. Additionally, we assessed the prognostic value of GLS towards cardiovascular events. In our cohort, GLS was a powerful predictor of a combined endpoint of myocardial infarction, ischemic stroke, and vascular death. The prognostic value of GLS-LVSD was strong and independent of confounders, showing hazard ratios for events only slightly smaller than that of LVEF-LVSD, a well-established and powerful outcome predictor. GLS showed an independent significant association with incident cardiovascular events even among subjects with normal LVEF, and its prognostic value was incremental to risk factors and LVEF.
The prevalence of LVSD reported in previous studies varied widely (1.5% to 14.0%), depending on the mean age of the population, the subjects’ risk profiles, and the LVEF threshold used for LVSD definition.1–10,26,27 The prevalence of LVEF-LVSD observed in our study is comparable to that reported by studies using a similar LVEF cut-off in middle-aged to elderly subjects.1,5,6,10,27 However, while the prognostic value of LVEF-LVSD has been documented, the prognostic value of GLS has been so far documented only in patients with myocardial infarction,28–30 heart failure,15,31 ischemic cardiomyopathy,32 and in selected series referred to cardiologists for known or suspected heart disease.14,33 The observation that a significant proportion of LVSD in the population goes undetected by traditional echocardiographic assessment, along with the demonstration of the powerful predictive value of GLS-LVSD for cardiovascular events, raises the issue of what should be done in individuals with preserved LVEF but impaired GLS. In patients with low LVEF (considered at stage B of heart failure), the guidelines for the management of heart failure recommend treatment with ACE-inhibitors to prevent or delay the onset of symptomatic heart failure, even in the absence of a history of MI.34 Whether medical treatment might have an impact on the outcome of patients with isolated abnormal GLS is not known, and specifically designed studies are needed to address this question.
The mechanisms for the unfavorable prognostic value of abnormal GLS are not completely understood. GLS is a measure of LV myocardial shortening in the longitudinal direction, and is known to be associated with several cardiovascular risk factors, such as hypertension, diabetes, and LV hypertrophy,12,13 which may in part mediate its association with cardiovascular events. Recently, we demonstrated that lower GLS is associated with silent brain disease in subjects without overt cardiovascular disease,35 suggesting that GLS might be an indicator of the early changes associated with subclinical atherosclerosis and small vessel alterations (medial hyperplasia, perivascular and interstitial fibrosis) that have been described in hypertensive patients in various vascular territories.36 Furthermore, because longitudinally oriented myofibers are mostly located in the subendocardium, GLS is considered to be particularly sensitive to subendocardial ischemia, hemodynamic overload, or early myocardial damage at a stage when LVEF is not yet impaired.37,38
Although differences in normal GLS values have been reported in previous studies, mean values ranged between −16% and −19% in most studies.39 In a healthy population significantly younger than our healthy reference sample, mean GLS was −18.6±5.1%.40 In our healthy reference group, mean GLS was -18.1%, therefore in line with past reports. Our abnormal GLS cut-off is also similar to those adopted and reported by other studies in cohorts of similar age. In the Framingham study, the 97th percentile of GLS in a normal healthy population was −14.4% in subjects >75 years, and −15.3% and −14.7% in men and women 65 to 74 years old, values comparable to our −14.7%.41 Recent improvements in echocardiographic software, and its inclusion in most commercially available echocardiographic systems, have made speckle-tracking analysis widely available. However, the lack of standardization across commercially available speckle-tracking software makes the evaluation of myocardial strain vendor-dependent. As GLS is emerging as a promising tool that might improve risk stratification in different clinical conditions, standardization across vendors will become a crucial factor for its future utilization on a large scale.42
Strengths and limitations
Strengths of our study are: the large number of subjects from a tri-ethnic community-based cohort, the prospective design of the study, the use of advanced imaging techniques, and the wide range of cardiovascular risk profiles present in our study population. However, our study also has limitations. The study sample included subjects over 50 years old, with a large representation of Hispanic ethnicity, which might preclude the generalization of our findings to populations with different demographic composition. Also for this reason, and for the relatively low prevalence of LVSD, we could not perform subgroup analyses. Finally, although we accounted for several confounders and performed multivariate analyses adjusting for established cardiovascular risk factors, we cannot rule out the possibility of unmeasured confounders playing a role in the observed associations.
Conclusion
In middle-aged to elderly subjects with normal LVEF from the community, the use of speckle-tracking GLS allowed the detection of subclinical LVSD in 16.8% of the study participants. GLS-LVSD was independently associated with an over 2-fold increase risk of cardiovascular events during follow-up. GLS prognostic value was incremental to risk factors and LVEF. Our findings suggest that LV function assessment by GLS may refine risk stratification in subjects with normal LVEF by identifying those at higher risk of future cardiovascular events.
Acknowledgments
The authors wish to thank Janet De Rosa, MPH (project manager), Rui Liu, MD, Rafi Cabral, MD, Michele Alegre, RDCS, and Palma Gervasi-Franklin (collection and management of the data).
FUNDING: This work was supported by the National Institute of Neurological Disorders and Stroke [grant number R01 NS36286 to MDT and R37 NS29993 to RLS/MSE].
Footnotes
CONFLICT OF INTEREST: None declared.
References
- 1.Wang TJ, Evans JC, Benjamin EJ, Levy D, LeRoy EC, Vasan RS. Natural history of asymptomatic left ventricular systolic dysfunction in the community. Circulation. 2003;108:977–982. doi: 10.1161/01.CIR.0000085166.44904.79. [DOI] [PubMed] [Google Scholar]
- 2.McDonagh TA, Morrison CE, Lawrence A, Ford I, Tunstall-Pedoe H, McMurray JJ, Dargie HJ. Symptomatic and asymptomatic left-ventricular systolic dysfunction in an urban population. Lancet. 1997;350:829–833. doi: 10.1016/S0140-6736(97)03033-X. [DOI] [PubMed] [Google Scholar]
- 3.Devereux RB, Roman MJ, Paranicas M, Lee ET, Welty TK, Fabsitz RR, Robbins D, Rhoades ER, Rodeheffer RJ, Cowan LD, Howard BV. A population-based assessment of left ventricular systolic dysfunction in middle-aged and older adults: the Strong Heart Study. Am Heart J. 2001;141:439–446. doi: 10.1067/mhj.2001.113223. [DOI] [PubMed] [Google Scholar]
- 4.Devereux RB, Bella JN, Palmieri V, Oberman A, Kitzman DW, Hopkins PN, Rao DC, Morgan D, Paranicas M, Fishman D, Arnett DK. Left ventricular systolic dysfunction in a biracial sample of hypertensive adults: The Hypertension Genetic Epidemiology Network (HyperGEN) Study. Hypertension. 2001;38:417–423. doi: 10.1161/01.hyp.38.3.417. [DOI] [PubMed] [Google Scholar]
- 5.Redfield MM, Jacobsen SJ, Burnett JC, Jr, Mahoney DW, Bailey KR, Rodeheffer RJ. Burden of systolic and diastolic ventricular dysfunction in the community: appreciating the scope of the heart failure epidemic. JAMA. 2003;289:194–202. doi: 10.1001/jama.289.2.194. [DOI] [PubMed] [Google Scholar]
- 6.Davies M, Hobbs F, Davis R, Kenkre J, Roalfe AK, Hare R, Wosornu D, Lancashire RJ. Prevalence of left-ventricular systolic dysfunction and heart failure in the Echocardiographic Heart of England Screening study: a population based study. Lancet. 2001;358:439–444. doi: 10.1016/s0140-6736(01)05620-3. [DOI] [PubMed] [Google Scholar]
- 7.Yeboah J, Rodriguez CJ, Stacey B, Lima JA, Liu S, Carr JJ, Hundley WG, Herrington DM. Prognosis of individuals with asymptomatic left ventricular systolic dysfunction in the multi-ethnic study of atherosclerosis (MESA) Circulation. 2012;126:2713–2719. doi: 10.1161/CIRCULATIONAHA.112.112201. [DOI] [PMC free article] [PubMed] [Google Scholar]
- 8.Mosterd A, Hoes AW, de Bruyne MC, Deckers JW, Linker DT, Hofman A, Grobbee DE. Prevalence of heart failure and left ventricular dysfunction in the general population; The Rotterdam Study. Eur Heart J. 1999;20:447–455. [PubMed] [Google Scholar]
- 9.Aurigemma GP, Gottdiener JS, Shemanski L, Gardin J, Kitzman D. Predictive value of systolic and diastolic function for incident congestive heart failure in the elderly: the Cardiovascular Health Study. J Am Coll Cardiol. 2001;37:1042–1048. doi: 10.1016/s0735-1097(01)01110-x. [DOI] [PubMed] [Google Scholar]
- 10.Abhayaratna WP, Smith WT, Becker NG, Marwick TH, Jeffery IM, McGill DA. Prevalence of heart failure and systolic ventricular dysfunction in older Australians: the Canberra Heart Study. Med J Aust. 2006;184:151–154. doi: 10.5694/j.1326-5377.2006.tb00173.x. [DOI] [PubMed] [Google Scholar]
- 11.Hays AG, Sacco RL, Rundek T, Sciacca RR, Jin Z, Liu R, Homma S, Di Tullio MR. Left ventricular systolic dysfunction and the risk of ischemic stroke in a multiethnic population. Stroke. 2006;37:1715–1719. doi: 10.1161/01.STR.0000227121.34717.40. [DOI] [PMC free article] [PubMed] [Google Scholar]
- 12.Ng AC, Delgado V, Bertini M, van der Meer RW, Rijzewijk LJ, Shanks M, Nucifora G, Smit JW, Diamant M, Romijn JA, de Roos A, Leung DY, Lamb HJ, Bax JJ. Findings from left ventricular strain and strain rate imaging in asymptomatic patients with type 2 diabetes mellitus. Am J Cardiol. 2009;104:1398–1401. doi: 10.1016/j.amjcard.2009.06.063. [DOI] [PubMed] [Google Scholar]
- 13.Hare JL, Brown JK, Marwick TH. Association of myocardial strain with left ventricular geometry and progression of hypertensive heart disease. Am J Cardiol. 2008;102:87–91. doi: 10.1016/j.amjcard.2008.02.101. [DOI] [PubMed] [Google Scholar]
- 14.Stanton T, Leano R, Marwick TH. Prediction of all-cause mortality from global longitudinal speckle strain: comparison with ejection fraction and wall motion scoring. Circ Cardiovasc Imaging. 2009;2:356–364. doi: 10.1161/CIRCIMAGING.109.862334. [DOI] [PubMed] [Google Scholar]
- 15.Motoki H, Borowski AG, Shrestha K, Troughton RW, Tang WH, Thomas JD, Klein AL. Incremental prognostic value of assessing left ventricular myocardial mechanics in patients with chronic systolic heart failure. J Am Coll Cardiol. 2012;60:2074–2081. doi: 10.1016/j.jacc.2012.07.047. [DOI] [PubMed] [Google Scholar]
- 16.Sacco RL, Khatri M, Rundek T, Xu Q, Gardener H, Boden-Albala B, Di Tullio MR, Homma S, Elkind MS, Paik MC. Improving Global Vascular Risk Prediction With Behavioral and Anthropometric Factors The Multiethnic NOMAS (Northern Manhattan Cohort Study) J Am Coll Cardiol. 2009;54:2303–2311. doi: 10.1016/j.jacc.2009.07.047. [DOI] [PMC free article] [PubMed] [Google Scholar]
- 17.Lang RM, Bierig M, Devereux RB, Flachskampf FA, Foster E, Pellikka PA, Picard MH, Roman MJ, Seward J, Shanewise JS, Solomon SD, Spencer KT, Sutton MS, Stewart WJ. Recommendations for chamber quantification: a report from the American Society of Echocardiography’s Guidelines and Standards Committee and the Chamber Quantification Writing Group, developed in conjunction with the European Association of Echocardiography, a branch of the European Society of Cardiology. J Am Soc Echocardiogr. 2005;18:1440–1463. doi: 10.1016/j.echo.2005.10.005. [DOI] [PubMed] [Google Scholar]
- 18.Devereux RB, Reichek N. Echocardiographic determination of left ventricular mass in man. Anatomic validation of the method. Circulation. 1977;55:613–618. doi: 10.1161/01.cir.55.4.613. [DOI] [PubMed] [Google Scholar]
- 19.Russo C, Jin Z, Liu R, Iwata S, Tugcu A, Yoshita M, Homma S, Elkind MS, Rundek T, DeCarli C, Wright CB, Sacco RL, Di Tullio MR. LA volumes and reservoir function are associated with subclinical cerebrovascular disease: the CABL (Cardiovascular Abnormalities and Brain Lesions) study. JACC Cardiovasc Imaging. 2013;6:313–323. doi: 10.1016/j.jcmg.2012.10.019. [DOI] [PMC free article] [PubMed] [Google Scholar]
- 20.Russo C, Jin Z, Homma S, Rundek T, Elkind MS, Sacco RL, Di Tullio MR. Effect of obesity and overweight on left ventricular diastolic function: a community-based study in an elderly cohort. J Am Coll Cardiol. 2011;57:1368–1374. doi: 10.1016/j.jacc.2010.10.042. [DOI] [PMC free article] [PubMed] [Google Scholar]
- 21.Russo C, Jin Z, Homma S, Elkind MS, Rundek T, Yoshita M, DeCarli C, Wright CB, Sacco RL, Di Tullio MR. Subclinical Left Ventricular Dysfunction and Silent Cerebrovascular Disease: The Cardiovascular Abnormalities and Brain Lesions (CABL) Study. Circulation. 2013;128:1105–1111. doi: 10.1161/CIRCULATIONAHA.113.001984. [DOI] [PMC free article] [PubMed] [Google Scholar]
- 22.Russo C, Jin Z, Homma S, Rundek T, Elkind MS, Sacco RL, Di Tullio MR. Relationship of Multidirectional Myocardial Strain with Radial Thickening and Ejection Fraction and Impact of Left Ventricular Hypertrophy: A Study in a Community-Based Cohort. Echocardiography. 2013;30:794–802. doi: 10.1111/echo.12134. [DOI] [PMC free article] [PubMed] [Google Scholar]
- 23.Adams HP, Jr, Bendixen BH, Kappelle LJ, Biller J, Love BB, Gordon DL, Marsh EE., III Classification of subtype of acute ischemic stroke. Definitions for use in a multicenter clinical trial. TOAST. Trial of Org 10172 in Acute Stroke Treatment. Stroke. 1993;24:35–41. doi: 10.1161/01.str.24.1.35. [DOI] [PubMed] [Google Scholar]
- 24.Greene HL, Richardson DW, Barker AH, Roden DM, Capone RJ, Echt DS, Friedman LM, Gillespie MJ, Hallstrom AP, Verter J. Classification of deaths after myocardial infarction as arrhythmic or nonarrhythmic (the Cardiac Arrhythmia Pilot Study) Am J Cardiol. 1989;63:1–6. doi: 10.1016/0002-9149(89)91065-5. [DOI] [PubMed] [Google Scholar]
- 25.Schaefer EJ, Lamon-Fava S, Jenner JL, McNamara JR, Ordovas JM, Davis CE, Abolafia JM, Lippel K, Levy RI. Lipoprotein(a) levels and risk of coronary heart disease in men. The lipid Research Clinics Coronary Primary Prevention Trial. JAMA. 1994;271:999–1003. doi: 10.1001/jama.1994.03510370051031. [DOI] [PubMed] [Google Scholar]
- 26.Pandhi J, Gottdiener JS, Bartz TM, Kop WJ, Mehra MR. Comparison of characteristics and outcomes of asymptomatic versus symptomatic left ventricular dysfunction in subjects 65 years old or older (from the Cardiovascular Health Study) Am J Cardiol. 2011;107:1667–1674. doi: 10.1016/j.amjcard.2011.01.051. [DOI] [PMC free article] [PubMed] [Google Scholar]
- 27.McGrady M, Krum H, Carrington MJ, Stewart S, Zeitz C, Lee GA, Marwick TH, Haluska BA, Brown A. Heart failure, ventricular dysfunction and risk factor prevalence in Australian Aboriginal peoples: the Heart of the Heart Study. Heart. 2012;98:1562–1567. doi: 10.1136/heartjnl-2012-302229. [DOI] [PubMed] [Google Scholar]
- 28.Antoni ML, Mollema SA, Delgado V, Atary JZ, Borleffs CJ, Boersma E, Holman ER, van der Wall EE, Schalij MJ, Bax JJ. Prognostic importance of strain and strain rate after acute myocardial infarction. Eur Heart J. 2010;31:1640–1647. doi: 10.1093/eurheartj/ehq105. [DOI] [PubMed] [Google Scholar]
- 29.Ersboll M, Valeur N, Andersen MJ, Mogensen UM, Vinther M, Svendsen JH, Moller JE, Kisslo J, Velazquez EJ, Hassager C, Sogaard P, Kober L. Early echocardiographic deformation analysis for the prediction of sudden cardiac death and life-threatening arrhythmias after myocardial infarction. JACC Cardiovasc Imaging. 2013;6:851–860. doi: 10.1016/j.jcmg.2013.05.009. [DOI] [PubMed] [Google Scholar]
- 30.Ersboll M, Valeur N, Mogensen UM, Andersen MJ, Moller JE, Velazquez EJ, Hassager C, Sogaard P, Kober L. Prediction of all-cause mortality and heart failure admissions from global left ventricular longitudinal strain in patients with acute myocardial infarction and preserved left ventricular ejection fraction. J Am Coll Cardiol. 2013;61:2365–2373. doi: 10.1016/j.jacc.2013.02.061. [DOI] [PubMed] [Google Scholar]
- 31.Mignot A, Donal E, Zaroui A, Reant P, Salem A, Hamon C, Monzy S, Roudaut R, Habib G, Lafitte S. Global longitudinal strain as a major predictor of cardiac events in patients with depressed left ventricular function: a multicenter study. J Am Soc Echocardiogr. 2010;23:1019–1024. doi: 10.1016/j.echo.2010.07.019. [DOI] [PubMed] [Google Scholar]
- 32.Bertini M, Ng AC, Antoni ML, Nucifora G, Ewe SH, Auger D, Marsan NA, Schalij MJ, Bax JJ, Delgado V. Global longitudinal strain predicts long-term survival in patients with chronic ischemic cardiomyopathy. Circ Cardiovasc Imaging. 2012;5:383–391. doi: 10.1161/CIRCIMAGING.111.970434. [DOI] [PubMed] [Google Scholar]
- 33.Shan Y, Villarraga HR, Pislaru C, Shah AA, Cha SS, Pellikka PA. Quantitative assessment of strain and strain rate by velocity vector imaging during dobutamine stress echocardiography to predict outcome in patients with left bundle branch block. J Am Soc Echocardiogr. 2009;22:1212–1219. doi: 10.1016/j.echo.2009.07.011. [DOI] [PubMed] [Google Scholar]
- 34.Hunt SA, Abraham WT, Chin MH, Feldman AM, Francis GS, Ganiats TG, Jessup M, Konstam MA, Mancini DM, Michl K, Oates JA, Rahko PS, Silver MA, Stevenson LW, Yancy CW. 2009 focused update incorporated into the ACC/AHA 2005 Guidelines for the Diagnosis and Management of Heart Failure in Adults: a report of the American College of Cardiology Foundation/American Heart Association Task Force on Practice Guidelines: developed in collaboration with the International Society for Heart and Lung Transplantation. Circulation. 2009;119:e391–e479. doi: 10.1161/CIRCULATIONAHA.109.192065. [DOI] [PubMed] [Google Scholar]
- 35.Russo C, Jin Z, Homma S, Elkind MS, Rundek T, Yoshita M, DeCarli C, Wright CB, Sacco RL, Di Tullio MR. Subclinical Left Ventricular Dysfunction and Silent Cerebrovascular Disease: The Cardiovascular Abnormalities and Brain Lesions (CABL) Study. Circulation. 2013;128:1105–1111. doi: 10.1161/CIRCULATIONAHA.113.001984. [DOI] [PMC free article] [PubMed] [Google Scholar]
- 36.Thompson CS, Hakim AM. Living beyond our physiological means: small vessel disease of the brain is an expression of a systemic failure in arteriolar function: a unifying hypothesis. Stroke. 2009;40:e322–e330. doi: 10.1161/STROKEAHA.108.542266. [DOI] [PubMed] [Google Scholar]
- 37.Chan J, Hanekom L, Wong C, Leano R, Cho GY, Marwick TH. Differentiation of subendocardial and transmural infarction using two-dimensional strain rate imaging to assess short-axis and long-axis myocardial function. J Am Coll Cardiol. 2006;48:2026–2033. doi: 10.1016/j.jacc.2006.07.050. [DOI] [PubMed] [Google Scholar]
- 38.Reimer KA, Lowe JE, Rasmussen MM, Jennings RB. The wavefront phenomenon of ischemic cell death. 1. Myocardial infarct size vs duration of coronary occlusion in dogs. Circulation. 1977;56:786–794. doi: 10.1161/01.cir.56.5.786. [DOI] [PubMed] [Google Scholar]
- 39.Mor-Avi V, Lang RM, Badano LP, Belohlavek M, Cardim NM, Derumeaux G, Galderisi M, Marwick T, Nagueh SF, Sengupta PP, Sicari R, Smiseth OA, Smulevitz B, Takeuchi M, Thomas JD, Vannan M, Voigt JU, Zamorano JL. Current and evolving echocardiographic techniques for the quantitative evaluation of cardiac mechanics: ASE/EAE consensus statement on methodology and indications endorsed by the Japanese Society of Echocardiography. Eur J Echocardiogr. 2011;12:167–205. doi: 10.1093/ejechocard/jer021. [DOI] [PubMed] [Google Scholar]
- 40.Marwick TH, Leano RL, Brown J, Sun JP, Hoffmann R, Lysyansky P, Becker M, Thomas JD. Myocardial strain measurement with 2-dimensional speckle-tracking echocardiography: definition of normal range. JACC Cardiovasc Imaging. 2009;2:80–84. doi: 10.1016/j.jcmg.2007.12.007. [DOI] [PubMed] [Google Scholar]
- 41.Cheng S, Larson MG, McCabe EL, Osypiuk E, Lehman BT, Stanchev P, Aragam J, Benjamin EJ, Solomon SD, Vasan RS. Age- and sex-based reference limits and clinical correlates of myocardial strain and synchrony: the Framingham Heart Study. Circ Cardiovasc Imaging. 2013;6:692–699. doi: 10.1161/CIRCIMAGING.112.000627. [DOI] [PMC free article] [PubMed] [Google Scholar]
- 42.Thomas JD, Badano LP. EACVI-ASE-industry initiative to standardize deformation imaging: a brief update from the co-chairs. Eur Heart J Cardiovasc Imaging. 2013;14:1039–1040. doi: 10.1093/ehjci/jet184. [DOI] [PubMed] [Google Scholar]