

Abstract
The Sample Analysis at Mars (SAM) instrument on board the Mars Science Laboratory Curiosity rover is designed to conduct inorganic and organic chemical analyses of the atmosphere and the surface regolith and rocks to help evaluate the past and present habitability potential of Mars at Gale Crater. Central to this task is the development of an inventory of any organic molecules present to elucidate processes associated with their origin, diagenesis, concentration, and long-term preservation. This will guide the future search for biosignatures. Here we report the definitive identification of chlorobenzene (150–300 parts per billion by weight (ppbw)) and C2 to C4 dichloroalkanes (up to 70 ppbw) with the SAM gas chromatograph mass spectrometer (GCMS) and detection of chlorobenzene in the direct evolved gas analysis (EGA) mode, in multiple portions of the fines from the Cumberland drill hole in the Sheepbed mudstone at Yellowknife Bay. When combined with GCMS and EGA data from multiple scooped and drilled samples, blank runs, and supporting laboratory analog studies, the elevated levels of chlorobenzene and the dichloroalkanes cannot be solely explained by instrument background sources known to be present in SAM. We conclude that these chlorinated hydrocarbons are the reaction products of Martian chlorine and organic carbon derived from Martian sources (e.g., igneous, hydrothermal, atmospheric, or biological) or exogenous sources such as meteorites, comets, or interplanetary dust particles.
Key Points
First in situ evidence of nonterrestrial organics in Martian surface sediments
Chlorinated hydrocarbons identified in the Sheepbed mudstone by SAM
Organics preserved in sample exposed to ionizing radiation and oxidative condition
Keywords: organic molecules, chlorobenzene, MSL, Mars, SAM, oxychlorine
1 Introduction
The exploration of habitable environments on Mars, including an assessment of the preservation potential for organic compounds of either abiotic or biotic origin in Martian rock, regolith fines, and the atmosphere, is one of the key goals of the Mars Science Laboratory (MSL) mission which landed the Curiosity Rover in Gale Crater [Grotzinger et al., 2012]. The Sample Analysis at Mars (SAM) instrument suite [Mahaffy et al., 2012] on the Curiosity rover is conducting the most extensive search for volatiles and organic compounds in the Martian near-surface materials since the Viking missions in 1976. SAM has made 21 separate measurements of four different solid samples including a scoop from the Rocknest aeolian deposit, multiple drill samples from Yellowknife Bay and Pahrump Hills (Figure1) and associated blank runs, using both pyrolysis evolved gas analysis-quadrupole mass spectrometry (EGA) and gas chromatography mass spectrometry (GCMS) (Table1). The first samples analyzed by both SAM and the Chemistry and Mineralogy (CheMin) X-ray diffraction instrument [Bish et al., 2013] at the Rocknest (RN) site (Figure1) were shown to be unconsolidated basaltic windblown sand, silt, and dust [Blake et al., 2013], with an elemental composition similar to soils measured by the Mars rovers Spirit and Opportunity [Bish et al., 2013]. Upon heating, the RN materials released several chlorine-bearing hydrocarbons at approximately the same temperature where a rise in O2 and HCl were observed, providing strong evidence for the presence of an oxychlorine phase such as hydrated Ca-perchlorate (Ca(ClO4)2 · nH2O) [Archer et al., 2014; Glavin et al., 2013; Leshin et al., 2013]. Although the chlorine in the chloromethanes identified at RN was derived from the Martian oxychlorine phase, the carbon source was argued to be primarily of terrestrial origin [Glavin et al., 2013; Leshin et al., 2013]. In 1976, the Viking landers had also detected chloromethane and dichloromethane after pyrolysis GCMS analyses of the surface soil collected at two separate locations [Biemann et al., 1976, 1977]. These chloromethanes were originally thought to be derived from terrestrial sources [Biemann et al., 1977], although this conclusion has more recently been revisited [Biemann and Bada, 2011; Navarro-Gonzalez et al., 2010].
Figure 1.
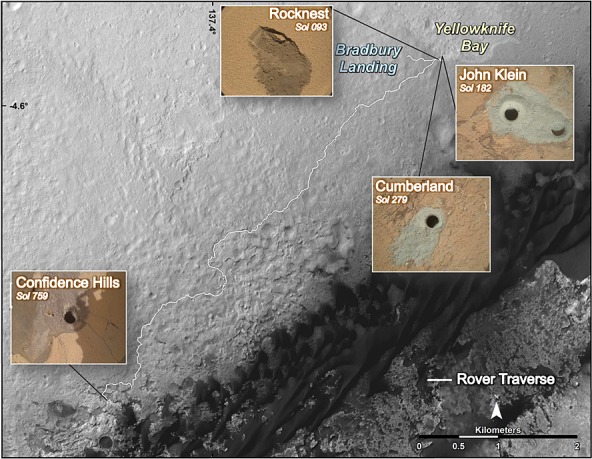
Curiosity’s route as of Sol 653, from Bradbury landing site to Pahrump Hills. The base image is from the High Resolution Imaging Science Experiment camera on Mars Reconnaissance Orbiter. Traverse map produced by Fred Calef, Jet Propulsion Laboratory-Caltech. Rocknest (RN) scooped site, John Klein (JK), Cumberland (CB), and Confidence Hills drilled sites are represented along with their respective sol of sample collection.
Table 1.
SAM Pyrolytic Conditions and GCMS Abundances of Chlorobenzene (C6H5Cl) and 1,2-DCP (C3H6Cl2) Sampled in the Hydrocarbon Trap Temperature Cutsa
| Sample (Mass) | Analysis on Mars (Sol) | Cup and Sample Preheat | Pyrolysis Temperature Rampb | GC Hydrocarbon Trap Cutc | C6H5Cld (pmol) BG Subtractede | C6H5Cld(pmol) Non-BG Subtracted | C3H6Cl2d (pmol) |
|---|---|---|---|---|---|---|---|
| RN-Blank | 86/88 | None | ∼45–875°C | ∼92–479°C | <1 | < 1 | <2 |
| RN-1 (50 ± 8 mg) | 93 | None | ∼45–875°C | ∼92–479°C | <2 | 8 ± 1 | <5 |
| JK-Blank | 177 | Sample Boil-off ∼320°C | ∼320–881°C | ∼349–820°C | <1 | 2 ± 1 | <3 |
| JK-3 (3X portion) | 224 | Sample Boil-off ∼320°C | ∼320–881°C | ∼326–581°C | <1 | 7 ± 1 | <4 |
| CB-Blank-1 | 277 | None | ∼45–875°C | ∼380–495°C | <1 | 4 ± 1 | <4 |
| CB-1 | 282/283 | None | ∼45–875°C | ∼380–495°C | <1 | 3 ± 1 | <4 |
| CB-2 | 286 | None | ∼45–875°C | ∼524–794°C | <1 | 6 ± 1 | <4 |
| CB-3 (45 ± 18 mg) | 290 | None | ∼45–875°C | ∼157–275°C | 31 ± 6 (120 ± 23f) | 36 ± 7 | 26 ± 5 |
| CB-5 (45 ± 18 mg) | 368 | Cup preheat ∼200°C | ∼45–875°C | ∼157–275°C | 27 ± 5 (90 ± 17f) | 71 ± 13 | 14 ± 3 |
| CB-6 (135 ± 31 mg) | 382 | Cup preheat ∼250°C Sample Boil-off ∼250°C | ∼250–870°C | ∼272–320°C | 30 ± 6 (180 ± 32f) | 74 ± 14 | <4 |
| CB-6 residue | 394 | Cup preheat ∼250°C Sample Boil-off ∼250°C | ∼250–870°C | ∼272–320°C | <3 | 47 ± 9 | <2 |
| CB-7 (3x portion) | 408 | Cup preheat ∼250°C Sample Boil-off ∼250°C | ∼250–870°C | ∼420–784°C | <1 | 39 ± 7 | <2 |
| CB-Blank-2 | 421 | Cup preheat ∼250°C Sample Boil-off ∼250°C | ∼250–870°C | ∼420–784°C | <3 | 47 ± 9 | <3 |
| CH-Blank | 770 | None | ∼45–960°C | ∼210–960°C | <3 | 3 ± 1 | <2 |
| CH-1 (45 ± 18 mg) | 773 | None | ∼45–960°C | ∼210–960°C | 3 | 9 ± 2 | <2 |
Italicized rows are the runs that include GC cuts within the expected chlorobenzene release temperature range.
The sample temperatures are determined from thermocouple measurements of fused silica powder heated in a SAM flight spare oven using the same power profile as the SAM flight oven. These data are recent and may thus differ from temperatures published in previous manuscript.
Gas chromatography (GC) hydrocarbon trap cut refers to the cup temperature range over which volatiles were collected on the hydrocarbon trap during pyrolysis for GCMS analyses.
The uncertainties (δx) are based on the standard deviation of the average value of five separate hexane calibration measurements (n) made during preflight calibration of SAM with a standard error, δx = σx · (n − 1)−1/2.
Background-subtracted abundances based on methods described in section 2. The background-subtracted abundances thus correspond to a lower limit.
Values corrected for the fraction of gas sent to the hydrocarbon trap (using m/z 112) during the pyrolysis experiment for GCMS analysis based on the specific hydrocarbon trap cut temperature range. If m/z 112 was not detected by EGA in the run or in the GC temperature cut selected, no EGA correction factor was used for the chlorobenzene abundances.
After the RN analyses, Curiosity traveled to the lowermost stratigraphic unit in the Yellowknife Bay formation, informally named the Sheepbed member, and proceeded to drill two holes designated John Klein (JK) and Cumberland (CB) (Figure1). The Sheepbed samples contained ∼20 wt % smectite clay [Ming et al., 2014; Vaniman et al., 2014] and were interpreted to be mudstone formed in an ancient lacustrine environment [Grotzinger et al., 2014]. Terrestrial phyllosilicates like smectite serve to transport and protect organic compounds when rapidly deposited under reducing chemical conditions [Farmer and Des Marais, 1999; Summons et al., 2011]. This suggests that the Sheepbed mudstone contains mineralogy ideally suited for preserving organics. Again, chloromethanes were detected during pyrolysis of the JK and CB samples, and mostly attributed to instrument internal carbon sources [Ming et al., 2014]. However, larger amounts of chloromethane and dichloromethane from the JK and CB drilled mudstone samples compared to the RN, suggested that an additional Martian organic carbon source in the Sheepbed mudstone was possible [Ming et al., 2014]. Curiosity then traveled to Pahrump Hills at the base of Mount Sharp where a drill sample was collected called Confidence Hills (CH). This report describes EGA combined with GCMS analyses performed on the RN, JK, CB, and CH samples, associated blank runs, and the supporting laboratory experiment. We report the discovery of chlorobenzene and several dichloroalkanes at CB, derived primarily from reactions between oxychlorine phases and a reduced organic carbon source indigenous to the Sheepbed mudstone.
2 SAM Instrument Modes and Background—Methods
The multiple changes in SAM operational modes with variations in instrument parameters reflect a results-driven strategy in a Martian environment, with limited resources and consumables. Best compromises between MSL experiments, as well as between SAM instrument measurement modes, were discussed in detail before each SAM analysis. Here we summarize the challenges associated with the complexity of in situ analyses and limited resources in a harsh and remote environment and the balance that must be obtained to accomplish multiple instrument and mission science objectives.
2.1 SAM Instrument Modes
SAM is a suite of three instruments that measure volatiles extracted from solid samples using three primary analytical modes for analysis of organic compounds: (1) Evolved gas analysis-quadrupole mass spectrometry (EGA), where solid samples are heated inside a pyrolysis oven up to ∼1000°C and the gases released are ionized by electron impact and continuously monitored by quadrupole mass spectrometry (QMS), with portions of evolved gas isolated for gas chromatography mass spectrometry (GCMS) and/or tunable laser spectrometry (TLS) analyses (Figures2 and 3). (2) Combustion, where the solid sample is exposed to pure molecular oxygen gas while being heated in the oven and the products analyzed by QMS, GCMS, and/or TLS (Figure2). (3) Wet chemistry experiments, which consist of a low-temperature extraction and derivatization with N-methyl-N-(tert-butyldimethylsilyl)-trifluoroacetamide (MTBSTFA) or thermochemolysis with tetramethylammonium hydroxide of organic compounds in a solid sample followed by direct EGA and GCMS analysis of the reaction products (Figure2). In addition to direct detection of organic molecules through the EGA and GCMS modes, the combustion experiment is designed to provide indirect evidence for the presence of organics in a sample through the quantification and carbon isotopic analysis of evolved CO2 by TLS.
Figure 2.
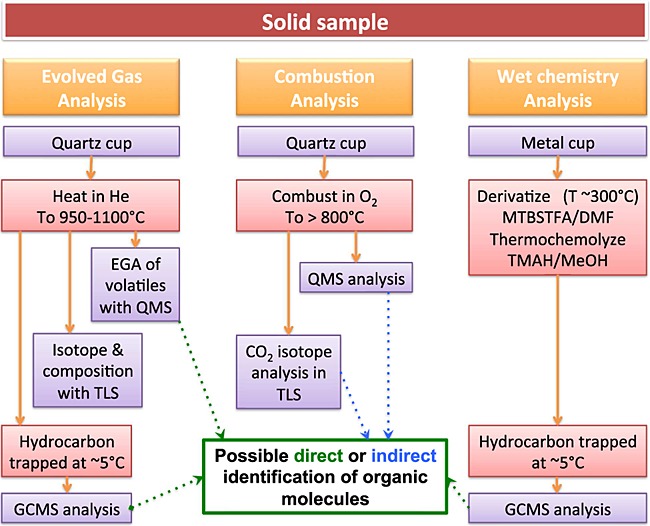
The three different modes of analysis of a solid sample for organic compounds by the SAM instrument.
Figure 3.
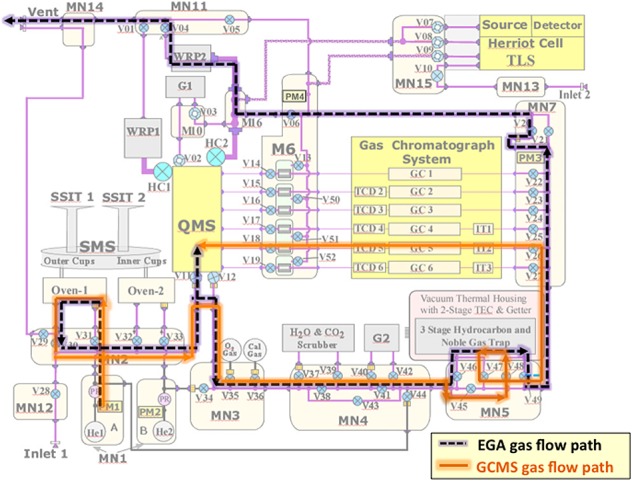
The SAM gas flow diagram showing the helium gas flow paths in both EGA (purple dashed line) and GCMS modes (orange line). Major components shown include the quadrupole mass spectrometer (QMS), the gas chromatograph system including six columns (GCx), three injection traps (ITx), and five thermal conductivity detectors (TCDx), the tunable laser spectrometer (TLS), the gas manifolds (MNx), the microvalves (Vx) and high-conductance valves (HCx), the hydrocarbon and noble gas trap, the sample manipulation system (SMS) with two solid sample inlet tubes (SSIT-1 and SSIT-2) and two pyrolysis ovens (Oven-1 and Oven-2), the helium gas reservoirs (He-1 and He-2), pressure sensors (PMx), and miniature wide-range pumps (WRP-1 and WRP-2). The manifold and pipe heaters and associated temperature sensors are not shown.
The separate solid samples collected at the Rocknest aeolian deposit, the Sheepbed mudstone and at Confidence Hills were sieved to < 150 µm particle size and individual aliquots of sample powder delivered to separate quartz-glass cups inside the SAM instrument from a portion tube with a volume of 76 mm3. The RN sample analyzed by SAM was scooped on sol 93 and the samples collected at JK, CB, and CH were drilled on sol 182, 279, and 759 respectively. Based on tests and models, a mass of 50 ± 8 mg (2σ standard deviation) per portion delivered to SAM was estimated for RN, and 45 ± 18 mg for JK, CB, and CH single portions. The analysis of gases released from these solid samples was conducted by heating the sample portions to ∼870°C in a pyrolysis oven at a rate of 35°C min−1, under a helium flow rate of ∼0.8 cm3 min−1 STP. Evolved gases were monitored directly and continuously with the QMS (EGA mode). Gases released from the sample over a specific temperature range (referred to as the GC temperature cut) were sent to a hydrocarbon trap and subsequently sent to one of the six gas chromatographic columns before detection by the thermal conductivity detector (TCD) and the QMS (GCMS mode) (Figure3). During the GC temperature cut, molecules in the He carrier gas flow are first concentrated onto the hydrocarbon trap, cooled to ∼5°C with thermoelectric coolers. This trap consists of three adsorbents in series, each bearing different adsorption properties: nonporous silica beads, Tenax TA (porous 2,6-diphenyl-p-phenylene oxide polymer resin adsorbent) and Carbosieve G (a closed-pore structure carbon molecular sieve). The desorption of volatiles from the hydrocarbon trap for GC analysis (GC-5: MXT-CLP, Siltek-treated stainless steel metal-chlorinated pesticides column—30 m length, 0.25 mm internal diameter, and 0.25 µm film thickness) was conducted as follows. From RN-Blank to RN-3, the hydrocarbon trap was flash heated to 330°C under He flow and the valves were opened for ∼6.3 min. For the RN-4 to CB-Blank-2 runs, the hydrocarbon trap was heated to 310°C ± 5°C and the hydrocarbon trap valves were open for ∼11.2 min. For the CH-Blank and CH-1 sample runs the hydrocarbon trap was heated to 310°C ± 5°C and the valves were open for 8.2 min. Heating the hydrocarbon trap under He flow in the opposite direction used for the trapping released the mixture of adsorbed volatiles to a smaller Tenax GR injection trap (IT) held at 20°C for collection at the front of the GC column. The IT was then flash heated up to ∼300°C for approximately 5 s to send the trapped compounds to the GC column, and this flash heating was used as the reference time (t = 0 s) from which volatile GC elution times were determined. For all the analyses presented here, only the MXT-CLP chromatographic column was used.
2.2 Background Subtraction and EGA correction
To account for the observed increase in the chlorobenzene GCMS background after CB-6 and a possible carryover of chlorobenzene or chlorobenzene precursors in the SAM gas processing system, the chlorobenzene data presented are background subtracted. In addition, to account for differences in GC temperature cuts used for the different GC analyses, the total GCMS abundances were EGA corrected for the fraction of each compound sent to the hydrocarbon trap during pyrolysis [Glavin et al., 2004]. For the RN-Blank to CB-3 runs, the chlorobenzene background was defined as the average value measured in the GCMS runs from RN-1 to CB-2. The RN-Blank run was not included in the background average since no chlorobenzene was detected in this run. For CB-5 and CB-6, the background subtracted was defined as the average of the GCMS abundances of chlorobenzene in the CB-6-residue, CB-7 and CB-Blank-2 runs. For the CH-Blank and CH-1 runs, the background subtracted was the average of the GCMS abundances of chlorobenzene in CH-Blank and CH-1. Therefore, the background-subtracted chlorobenzene GCMS abundances calculated for CB-5 and CB-6 represent a lower limit for the amount of indigenous chlorobenzene present in these samples. The EGA-corrected (using m/z 112) GCMS abundances of chlorobenzene were calculated from the background-subtracted abundances. Since the GC temperature cuts were different in the CB-5 to CB-6 runs (Table1), the EGA-corrected abundances are required to obtain more accurate chlorobenzene abundances released from the samples.
2.3 SAM Instrument Background
2.3.1 MTBSTFA
MTBSTFA was sealed inside each of the seven derivatization cups present in SAM. Although none of these stainless steel foil-capped cups have yet been punctured on Mars for the actual wet chemistry experiment, the presence of MTBSTFA products in the SAM background indicates that at least one of the cups released MTBSTFA into the Sample Manipulation System (SMS), possibly through a stressed cup weld or pinch-off tube [Glavin et al., 2013]. MTBSTFA vapors in the SMS adsorb on the quartz cups and solid samples delivered to the cups prior to pyrolysis. MTBSTFA vapor released inside the SMS rapidly reacts with residual water present in the SMS or sample to form the MTBSTFA hydrolysis products tert-butyldimethylsilanol, 1,3-bis(1,1-dimethylethyl)-1,1,3,3-tetramethyldisiloxane, 2,2,2,-trifluoro-N-methylacetamide (TFMA) [Glavin et al., 2013]. Apart from its hydrolysis products, MTBSTFA decomposition products include methylpropene and methane. MTBSTFA also reacts with all side groups of molecules bearing a labile hydrogen. In the presence of oxygen, MTBSTFA products can also be oxidized to CO2 at elevated temperatures and may contribute to the CO and NO compounds detected in some of the SAM analyses. The reaction of MTBSTFA with the GC column and/or glass bead component of the hydrocarbon trap may enhance the degradation of these components.
The abundance of MTBSTFA carbon has been quantified from the major MTBSTFA by-products detected by EGA and its initial contribution to the SAM background was estimated to be between ∼47 and ∼116 nmol of MTBSTFA in the blank runs carried out before RN, JK, and CB (estimations updated from Ming et al. [2014] with additional MTBSTFA by-product contributions from methylpropene and methane). MTBSTFA reduction strategies were successful in the CB-5, CB-6, CB-6-residue, CB-7, and CB-Blank-2 analyses and the initial contribution from MTBSTFA was reduced down to 35 nmol in CB-6 (Figure4). In the CB-6-residue run, the combustion of MTBSTFA and MTBSTFA by-products was greatly reduced due to the lack of O2 released from oxychlorine decomposition, which explains the higher abundance of MTBSTFA in the CB-6 residue run (Figure4).
Figure 4.
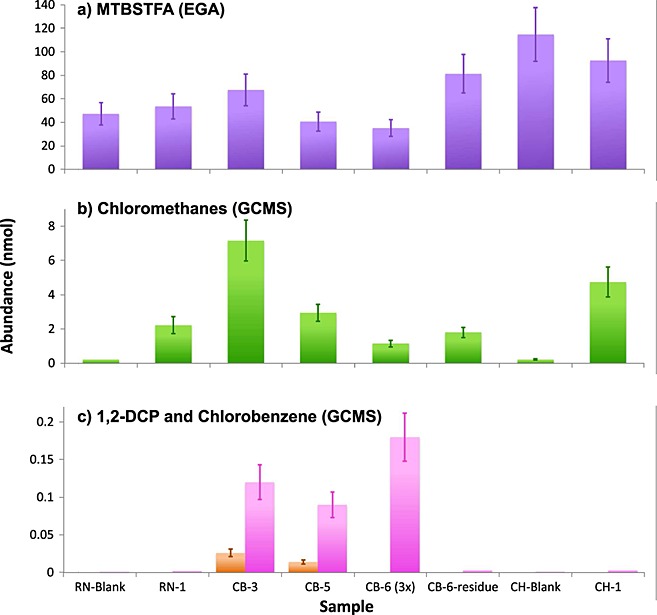
(a) MTBSTFA, (b) chloromethanes, and (c) 1,2-DCP and chlorobenzene throughout runs that include GC cuts within the expected chlorobenzene release temperature. MTBSTFA abundance (Figure4a) is inferred from its major by-products and is calculated from EGA. MTBSTFA reduction strategies are employed on CB-5, CB-6 triple portion, and CB-6-residue. The increase in the MTBSTFA abundances in CB-6-residue is explained by the lack of combustion in the absence of O2 released from the sample. Chloromethanes (Figure4b) reflect the sum of the abundances of chloromethanes (chloromethane, dichloromethane, trichloromethane, and carbon tetrachloride) observed in GCMS after EGA temperature cut correction. 1,2-DCP abundances (Figure4c, orange) observed in GCMS. Chlorobenzene abundances (Figure4c, pink) observed in GCMS are derived from an EGA temperature cut correction using m/z 112, from the GCMS background-subtracted data.
Two different experiments were carried out to try to significantly reduce the residual MTBSTFA contribution to the observed volatiles measured during pyrolysis of a solid sample and the empty cup blank runs. The first, used in the JK-Blank and JK-1 through JK-3 samples, was a boil-off of the cup/sample for ∼25 min to a temperature of ∼320°C prior to the EGA and GCMS analysis to release and vent low-temperature volatiles (including MTBSTFA by-products) to the Martian atmosphere. However, because background volatiles can come into direct contact with the sample, chemical reactions may occur during the boil-off between Martian components in the sample and the MTBSTFA by-products adsorbed to the cup and solid sample. In addition, some information on the low-temperature volatiles released from the sample at temperatures below ∼320°C is also lost during the boil-off procedure. This is why a second MTBSTFA reduction experiment was developed for the CB-5, CB-6, CB-6-residue, CB-7, and CB-Blank-2 experiments, consisting of (a) pumping out the SMS for ∼3 h with venting to the atmosphere via the wide-range pump prior to receiving sample while the SAM gas manifolds and transfer lines were heated to 135°C, (b) flushing the pyrolysis oven and SMS with helium to minimize adsorption of MTBSTFA products inside the oven, and (c) preheating the selected cup for ∼20 min to ∼200°C (CB-5) or ∼250°C (CB-6, CB-6-residue, CB-7, and CB-Blank-2) before moving the cup under the inlet tube to receive the solid sample portion. All of these approaches helped to limit the adsorption of volatile MTBSTFA vapor products present in the SMS onto the cup during sample delivery. The total time the cup was exposed to the residual MTBSTFA vapor sources inside the SMS during sample handoff was ∼13 min for CB-5, roughly 5 min shorter than the sample handoff cup exposure time for the previous single-portion sample analyses of RN, JK, and CB. CB-6, CB-6-residue, CB-7, and the CB-Blank-2 sample exposure times to the SMS background were 3 times this duration (∼40 min), because of the longer time required for the triple portion sample dropoff which was performed by three separate single-portion dropoffs in series. In contrast to CB-5, for the CB-6 triple portion sample run, the CB-6-residue reheat, the CB-7 triple portion and CB-Blank-2, a boil-off of the sample for ∼27 min to ∼250°C after the last sample portion dropoff, or exposure-simulation dropoff (for the CB-Blank-2), was also added. No MTBSTFA reduction was employed for the CH-Blank and CH-1 analyses.
2.3.2 Hydrocarbon Traps
The hydrocarbon trap(s) components are also part of the SAM internal background. Their Tenax TA and GR adsorbents, made of 2,6-diphenyl-p-phenylene oxide (Figure5), release aromatic compounds, and possibly aliphatic compounds, from thermal and chemical degradation. When heated to 300°C, the Tenax polymer can decompose into various smaller products that may be subsequently detected with the GCMS (Figure5). In addition to thermal degradation of the hydrocarbon traps components, reactive species from SAM sources or released from the Martian samples during pyrolysis can also enhance trap degradation. Due to repeated exposure of the Tenax polymers to O2 and HCl released from the decomposition of oxychlorine species from the samples analyzed at RN, JK, CB, and CH, the effects of these molecules on the trap components and resulting by-products have been thoroughly investigated. Laboratory experiments and data from SAM show that there are no strong correlations between the amount of MTBSTFA by-products, HCl, O2, SO2, or NO sent to the trap and the resulting degradation products detected by SAM GCMS (section 4.1.3).
Figure 5.
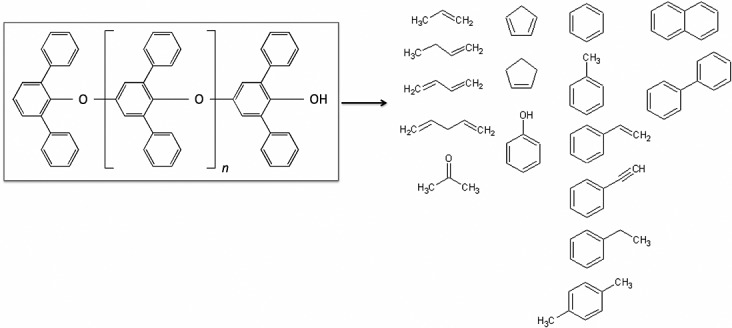
Tenax TA by-products. 2,6-diphenyl-p-phenylene oxide (Tenax TA) and the observed degradation products from the hydrocarbon traps present in SAM.
2.3.3 Other Sources of Instrument Background
Numerous preflight experiments were performed on SAM to assess the performance of the instrument. These include inorganic solid sample EGA calibration experiments, including calcite and melanterite. The presence of small amounts of SO2, CS2, and OCS in the first SAM GCMS blank run on Mars was attributed to cross contamination from the calibration experiments, since these molecules are known to stick to the hydrocarbon and GC injection traps. H2O, NO, N2/CO, and CO2 are also part of SAM background and their abundances have been well characterized. EGA quantities of these gases are generally far above these residual background levels [Archer et al., 2014; Glavin et al., 2013; Leshin et al., 2013; Ming et al., 2014]. Small levels of acetone were identified in the first SAM GCMS blank and were also detected in the SAM test bed experiments. The decrease in acetone abundance measured in SAM over time, as well as its presence in the SAM test bed, suggests that this compound might be a residual from the SAM hardware solvent cleaning procedure. Acetone was also previously detected in the Viking GCMS instrument background and was attributed to solvents used to clean the instrument hardware [Biemann et al., 1977]. Contributions of volatiles to the SAM background from the Curiosity rover’s sample handling chain was also considered, but terrestrial contamination from this source is unlikely because it was scrubbed multiple times with scooped material from Rocknest prior to the first drilled samples at JK and CB [Ming et al., 2014]. In addition, swabbed surfaces of Curiosity’s sample acquisition and processing system were found to be organically clean prior to launch [Anderson et al., 2012]. In summary, memory effects from SAM preflight experiments, SAM hardware cleaning and from Curiosity’s sample handling chain have all been considered as possible contributors to the SAM background, but these sources do not create interferences with the data analysis for the chlorobenzene and dichloroalkanes reported.
2.4 Supporting Laboratory Experiments
The pyrolysis-GCMS (pyr-GCMS) experiments conducted at NASA Goddard Space Flight Center were designed to understand the chemical interactions of MTBSTFA with the oxychlorine compounds believed to be present in the Martian samples. The experimental setup was used to analyze terrestrial analog samples under conditions that approximate the SAM analysis conditions on Mars [Glavin et al., 2013]. Magnesium-perchlorate and calcium-perchlorate were studied and produced similar chlorohydrocarbon products when heated in the presence of MTBSTFA [Glavin et al., 2013]. The reactions were investigated using samples that were composed of fused silica doped with 1 wt % Ca(ClO4)2 · nH2O (28 mg total) with or without addition of 0.4 μL MTBSTFA (∼1.7 µmol) + 0.1 μL dimethyl formamide (DMF ∼1.3 µmol). The estimated maximum MTBSTFA carbon background level in the SAM experiments of up to 2 µmol C (updated from Ming et al. [2014]) is much lower than the total amount of MTBSTFA carbon typically used in each laboratory pyrolysis GCMS experiment (∼19.2 µmol C). The capillary column (Restek MTX-Q-Bond, 30 m length × 0.25 mm internal diameter × 8 µm film thickness) and the instrument parameters used for the study allows a complete resolution of low molecular weight volatiles but > C8 molecules could not be separated and detected under the experimental conditions used [Glavin et al., 2013].
Analog experiments at the Massachusetts Institute of Technology (MIT) were also carried out to study the interactions between oxychlorine minerals and simple organic compounds that may be present within SAM or indigenous to the Martian solid samples. These experiments were conducted using an olivine sand substrate spiked with Ca(ClO4)2 · nH2O or Mg(ClO4)2 · nH2O corresponding to 1 wt % calcium or magnesium perchlorate and various concentrations of other pure compound analytes. The olivine sand was prepared by first rinsing it with 6 N HCl, followed by repeated rinses with H2O to remove plasticides. The sand was then powdered in a stainless steel mill, sieved to < 125 µm and heated at 550°C in air for 5 h. Approximately 5 mg of the sand was added to a Chemical Data Systems, Inc. (CDS) quartz sample tube packed with a quartz filler rod and a plug of quartz wool. Aqueous solution of Ca(ClO4)2 · nH2O or Mg(ClO4)2 · nH2O were individually added to each of the olivine containing sample tubes and allowed to dry in a fume hood overnight. Individual analytes (e.g., benzene, toluene, phthalic acid, and propanol) could then be added to the sample, typically in a solution of either water or methanol. Due to concern about loss of the analytes through evaporation, the compounds were added to the sand with a syringe approximately 5 s before pyrolysis GCMS analysis [Glavin et al., 2013; Miller et al., 2013].
Similar analog experiments were conducted with kerogen-like organic matter isolated from the Murchison meteorite [Deamer and Pashley, 1989]. Approximately 1 mg of the Murchison kerogen was subsequently added to CDS quartz sample tubes and spiked with 50–500 µg of Ca(ClO4)2 · nH2O. These samples were allowed to dry in a fume hood overnight prior to pyrolysis GCMS analysis.
In all experiments at MIT, the CDS analytical pyroprobe was programed to heat the sample from 50 to 750°C at a rate of 35°C min−1. The resulting volatiles were concentrated on a stainless steel ¼ inch hydrocarbon trap (Carbosieve G, Tenax TA, and silica beads) that was held at −10°C throughout the pyrolysis. The trapped volatiles were then desorbed at 300°C for 5 min. The GC, which was equipped with an RTX-CLPesticides column (30 m × 0.25 mm × 0.25 µm), was programed to hold at 35°C for 5 min before heating to 300°C at a rate of 10°C min−1 with a final hold time of 8.5 min. The MS was operated in electron impact mode at 70 eV and scanned from m/z 10 to m/z 535.
3 Results: SAM and Support Laboratory Experiments
3.1 Chlorobenzene
Chlorobenzene (C6H5Cl) was identified by both retention time and mass spectra by GCMS in the CB-3, CB-5, and CB-6 runs at levels of ∼90 to ∼180 pmol above background (∼150 to 300 ppbw) after trapping the volatiles released from tens of milligrams (Table1) of powdered CB materials at low temperatures (Figure6 and Table1). These chlorobenzene abundances were background-subtracted and EGA-corrected data to account, respectively, for the observed increase in the chlorobenzene GCMS background after CB-6 and for the difference in GC temperature cuts used for the GCMS analyses (section 2.2) and thus represent a lower limit of the initial chlorobenzene abundance present in the CB samples.
Figure 6.
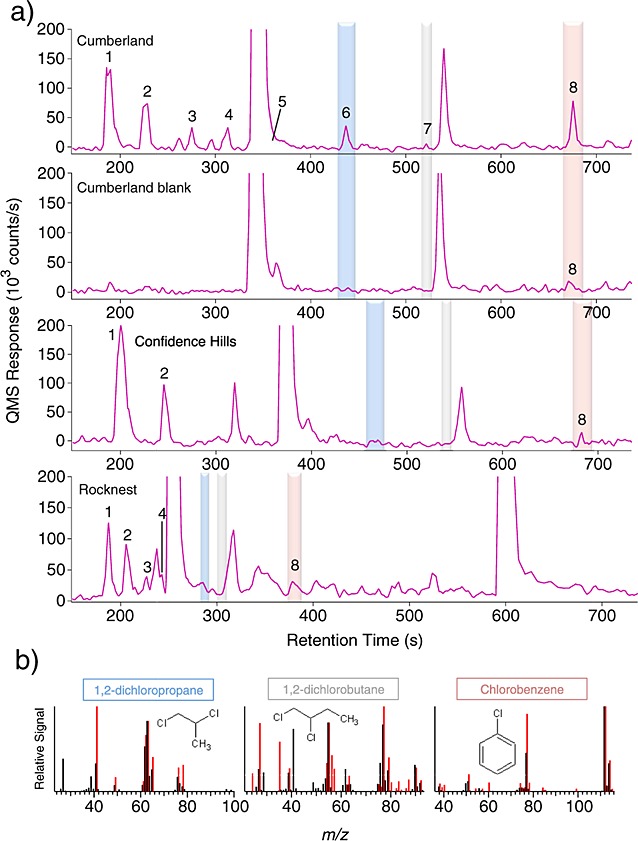
SAM GCMS identification of chlorohydrocarbons. (a) Chlorohydrocarbons observed in GCMS in the Cumberland sample CB-3, Cumberland blank CB-Blank-1, Confidence Hills sample CH-1, and Rocknest sample RN-1. Reconstructed ion chromatograms with the following multiplication factors: m/z 52 × 2 + m/z 84 + m/z 83 × 8 + m/z 117 × 35 + m/z 63 × 8 + m/z 90 × 10 + m/z 112 × 7. 1: chloromethane, 2: dichloromethane, 3: trichloromethane, 4: carbon tetrachloride, 5: 1,2-dichloroethane, 6: 1,2-dichloropropane, 7: 1,2-dichlorobutane, and 8: chlorobenzene. The peaks at 340 and 538 s in CB are, respectively, benzene and toluene from internal background. Note that the CH experiments used another oven to heat the sample and that the RN experiments used a different GC temperature program than CB, resulting in modified retention times. (b) Mass spectra generated for the GC peaks detected in CB are shown in red and compared to those of 1,2-DCP, 1,2-dichlorobutane, and chlorobenzene from NIST Mass Spectral Database (black). The GC retention time for these compounds has been validated with high fidelity laboratory breadboards of the SAM GCMS system.
To decouple the measured chlorobenzene from the two primary terrestrial carbon sources in SAM (MTBSTFA and Tenax), further analyses and laboratory experiments were conducted.
The decoupling of chlorobenzene from MTBSTFA is provided by laboratory experiments (Figure7), which demonstrates that pyrolysis of MTBSTFA with 1 wt % Ca-perchlorate in fused silica does not generate additional chlorobenzene above the levels produced after pyrolysis of a 1 wt % Ca-perchlorate in fused silica only, although trace amounts of chlorobenzene is detectable in both runs.
Figure 7.
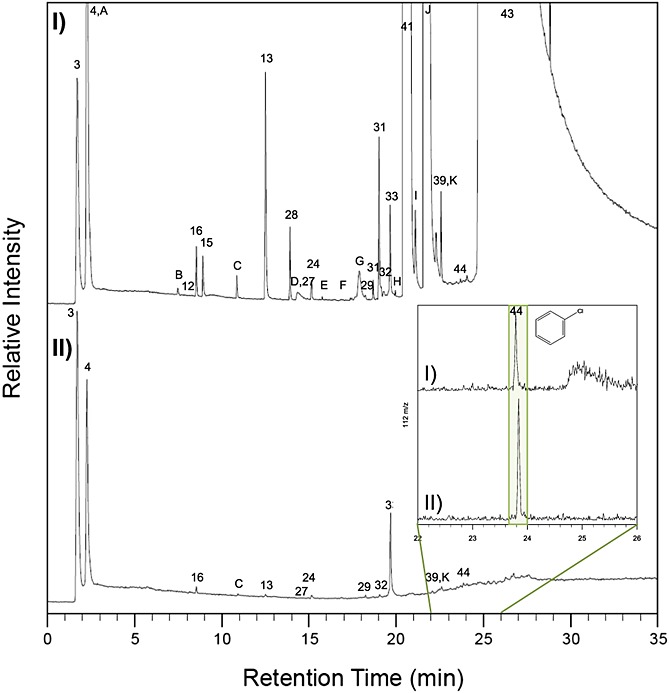
Laboratory study showing the effect of MTBSTFA on the formation of chlorobenzene. GCMS analysis of hydrocarbon trap products collected at 5°C under He flow (25 mL min−1) during pyrolysis from 45 to 850°C at 35°C min−1 of (I) 1 wt % Ca-perchlorate in fused silica with 0.4 μL MTBSTFA and 0.1 μL DMF compared to (II) 1 wt % Ca-perchlorate in fused silica with no MTBSTFA/DMF. Peaks were identified by comparison of the mass spectra to NIST. Molecules identified in the laboratory experiments and not in SAM are lettered. Numbers and letters are as follows: 3, air; 4, carbon dioxide; A, nitrous oxide; B, ethanedinitrile; 12, propene; 16, chloromethane; 15, hydrogen cyanide; C, acetaldehyde; 13, C4-alkene; 28, acetonitrile; D, methyl isocyanate; 27, acetone; 24, dichloromethane; E, nitromethane; F, C4-alkene aldehyde; G, 2-chloro-2-methylpropane; 29, trichloromethane; 31, 1- and 3-chloro-2-methyl-1-propene; 32, carbon tetrachloride; 33, benzene; H, C4-alkene nitrile; 41, N-methyl-2,2,2-trifluoroacetamide; I, N-methylformamide; J, N,N-dimethylformamide; 39, toluene; K, tetrachloroethene; 44, chlorobenzene; and 43, tert-butyldimethylsilanol. The Restek MXT-Q-Bond Porous Layer Open Tubular (PLOT) GC column (30 m length, 0.25 mm internal diameter, and 8 µm film thickness) used was held at 50°C for 4 min followed by a 10°C min−1 ramp to 250°C at a constant He flow of 1.5 mL min−1. Transfer line was set to 135°C. The quadrupole mass spectrometer operated in electron impact mode at 70 eV and scanned m/z 25–350. Inset: Selected Ion Monitoring (SIM) mode (m/z 112) on the elution zone of chlorobenzene (22–26 min).
Evidence for the decoupling of chlorobenzene from Tenax degradation is twofold: first, the observation of a stable level of the aromatic compounds released from the traps throughout the solid sample runs (benzene 19.2 ± 4.8 nmol and toluene 0.6 ± 0.3 nmol, JK runs not included), which does not support an additional chemical degradation of the Tenax in the runs where the highest levels of chlorobenzene were detected. Second, the RN, JK, CB and CH runs, blank and sample experiments, demonstrate that there are no strong correlations between the amount of HCl, O2, NO, or SO2 sent to the hydrocarbon trap and the abundances of chlorobenzene measured by GCMS (Figure8). The high abundances of HCl, O2, and NO sent to the hydrocarbon trap in the CB-3, CB-5, and CB-6 runs where chlorobenzene is detected above background level is intimately linked to the low temperature range sent to the trap (Figure9). The presence of chlorine (Cl2), which is a more reactive compound than HCl and a major decomposition product of Mg-perchlorate [Glavin et al., 2013], has also been investigated. However, EGA mode does not allow for the definitive identification of this compound due to possible mass interferences at m/z 70 and m/z 72. Moreover, Cl2 was not identified by GCMS in any of the SAM or laboratory experiments. It is believed that any Cl2 released from Mg-perchlorate or other oxychlorine species will readily react with the water background present in SAM and water released from the samples during pyrolysis. The average H2O abundance released from the CB samples was 47 µmol as determined by the SAM EGA measurements. The total abundance of chlorine measured by the Alpha Proton X-ray Spectrometer on Curiosity was 1.12 wt % in the CB dump pile. Assuming all of this chlorine was derived from Mg-perchlorate, it would represent a maximum of 7.2 µmol of Cl2 released from a 45 mg sample during SAM pyrolysis. Therefore, the maximum molar ratio of Cl2 to water released during CB sample pyrolysis would be ∼1:6.5. Given the known reactivity of Cl2 with water and the much higher abundance of water compared to Cl2 in the CB runs, it is reasonable to assume that any Cl2 released from Mg-perchlorate in the sample during pyrolysis will reach the hydrocarbon trap as HCl and not Cl2. Laboratory experiments with 5, 50, and 500 µg of Ca- and Mg-perchlorate, show that Cl2 was not observed in any of the experiments conducted under SAM-like conditions. The Cl2 formed during the decomposition of Mg-perchlorate under laboratory conditions likely reacts with an excess of water in the laboratory system to form HCl before reaching the hydrocarbon trap. Therefore, the only difference observed in Ca-perchlorate versus Mg-perchlorate experiments is the abundance of HCl and O2 released from the samples which is higher for Mg-perchlorate. However, because the SAM data shows that there is no significant correlation between the amount of HCl and O2 sent to the hydrocarbon trap and the chlorobenzene abundances measured by GCMS, the results for the laboratory experiments using Ca-perchlorate and Mg-perchlorate are both valid when interpreting the SAM chlorobenzene data.
Figure 8.
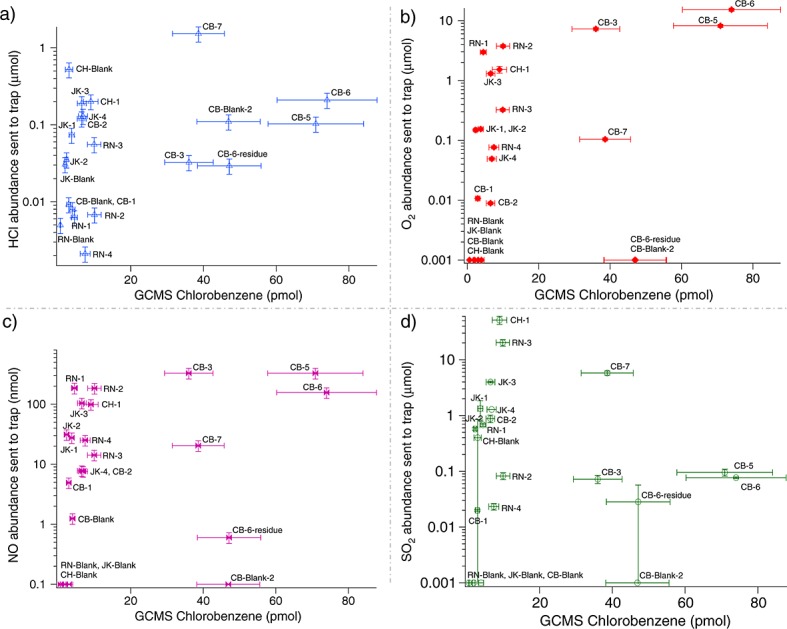
No significant correlation between the abundance of HCl, O2, NO, or SO2 sent to the HC trap (EGA-corrected abundances) and the abundance of chlorobenzene (nonbackground-subtracted abundances) measured by GCMS. Chlorobenzene abundance (pmol) detected in GCMS versus (a) abundance of HCl sent to the hydrocarbon trap (µmol), (b) abundance of O2 sent to hydrocarbon trap (µmol), (c) abundance of NO sent to the hydrocarbon trap (nmol), and (d) abundance of SO2 sent to the trap (µmol). For the calculated abundances of chlorobenzene (C6H5Cl) in the blanks and solid sample runs, measured by GCMS, the uncertainties (δx) are based on the standard deviation of the average value of five separate hexane calibration measurements (n) made during preflight calibration of SAM with a standard error, δx = σx · (n − 1)−1/2. O2, HCl, NO, and SO2 abundances sent to the hydrocarbon trap are determined, respectively, from m/z 32, m/z 36, m/z 30, and m/z 48 measured by EGA and corrected for the temperature cut. Errors reported for the molar abundances of O2, HCl, NO, and SO2 (2σ standard deviation of the mean) also include the uncertainty in differences in ionization efficiency between masses.
Figure 9.
Temperature releases of O2, HCl, NO, and SO2 and their relation with chlorobenzene and other aromatic-like m/z (showed in smoothed lines, shades of grey) in CB-5. The increase in chlorobenzene observed when a higher abundance of O2, HCl, and NO is sent to the HC trap (Figure8) is explained by the release of all these species in the same temperature range.
The possibility of a formation of chlorobenzene from aromatic species released from the hydrocarbon trap, benzene and toluene, was also investigated through multiple laboratory experiments with Ca-perchlorate. Benzene (0.65 nmol) and toluene (47 nmol), which are the most abundant compounds released from the thermal degradation of Tenax, were individually pyrolyzed in the presence of 50 µg of Ca-perchlorate. Even after addition of benzene and toluene to the Ca-perchlorate, the chlorobenzene abundance did not increase above background level in these experiments [Miller et al., 2013].
However, the pyrolysis of 7.5–750 pmol of functionalized aromatics such as phthalic acid with 50 µg of Ca-perchlorate and 50 µg of Mg-perchlorate resulted in a marked increase in the formation of chlorobenzene (Figure10). Similar results were observed when subnanomolar concentrations of benzoic acid and mellitic acid were pyrolyzed in the presence of Ca-perchlorate [Miller et al., 2013]. Furthermore, laboratory experiments in which approximately 1 mg of kerogen-like organic matter isolated from the Murchison meteorite was pyrolyzed in the presence of 500 µg Ca-perchlorate resulted in ∼30 times more chlorobenzene compared to the pyrolysis of 1 mg of Murchison without perchlorate (Figure 11).
Figure 10.
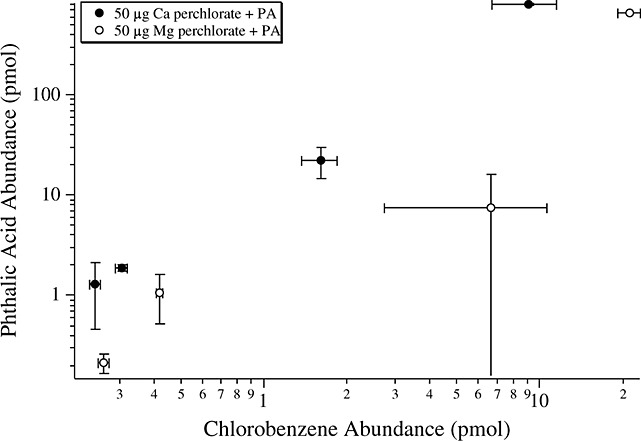
Laboratory study showing the abundance of chlorobenzene formation as a function of the initial abundance of phthalic acid (PA) pyrolyzed, in the presence of Ca-perchlorate (black circles) or Mg-perchlorate (white circles). The higher yield for chlorobenzene with Mg-perchlorate is explained by the higher abundance of HCl and O2 release from Mg-perchlorate compared to Ca-perchlorate. Reported errors are 1σ.
Figure 11.
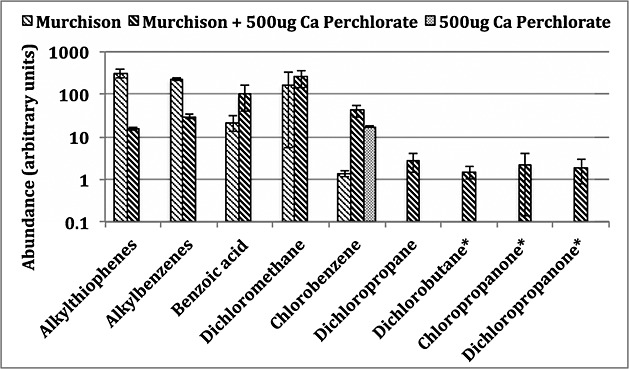
Laboratory study showing the comparison of some organic compounds detected from the GCMS analyses of ∼1 mg of kerogen-like organic matter isolated from the Murchison meteorite, pyrolyzed without or with 500 µg of Ca-perchlorate. Compound peak areas were measured from extracted mass chromatograms (alkylthiophenes = m/z 97, 112; alkylbenzenes and benzoic acid = m/z 105; dichloromethane = m/z 49; chlorobenzene = m/z 112; and dichloropropane, dichlorobutane*, chloropropanone*, and dichloropropanone* = m/z 63). Reported errors are 1σ. *Tentative identification.
SAM EGA data show the presence of a peak containing both m/z 112 and m/z 114 ions, attributed to chlorobenzene, that was observed during pyrolysis of the CB-1, CB-2, CB-3, CB-5, CB-6, and CB-7 samples but was not observed in the RN or in the CB-Blank-1 runs (Figure2). In addition, a decrease of both m/z 112 and m/z 114 ions back down to background level in the CB-6-residue run after a second heating of CB-6 was also observed (Figure 12). The blank following CB-7 (CB-Blank-2) and the CH-Blank run, also do not display m/z 112 nor m/z 114 ions in the EGA data (Figure 12). CB-1 and CB-2 would not be discussed further as the GC temperature cuts used in these runs were higher than the other analyses and did not include the m/z 112 and 114 ions of interest. A ∼3:1 to ∼5:1 ratio of the m/z 112 to m/z 114 peaks in all EGA CB samples, approaching the National Institute of Standards and Technology (NIST) library ratio of 3:1 for chlorobenzene, confirms that chlorobenzene was either present in the sample or was formed during pyrolysis. The EGA chlorobenzene abundances range from approximately 40 to 100 pmol, similar within error to the background-subtracted and EGA-corrected GCMS abundances for chlorobenzene reported in Table1. The CB-5 EGA data show peaks in the low temperature range (150–350°C) for m/z 78, 89, 102, 104, 105, 112, 113, 114, 119, 135, and 137 (Figure 13). These peaks are also present at a reduced level in CB-3 and other CB runs and may reflect heterogeneity between the different portions of the sample. Those peaks were not observed in any of the preceding or following blanks, reheated CB-6-residue sample or RN EGA analyses (Figure 13).
Figure 12.
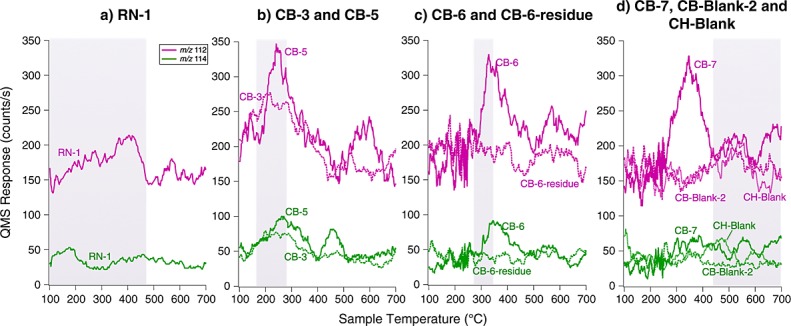
Smoothed EGA pyrograms showing the m/z 112 (violet, top) and m/z 114 (green, bottom) signals in (a) RN-1; (b) CB-3 (plain lines) and CB-5 (dashed lines): (c) CB-6 triple portion (plain lines) and subsequent CB-6-residue reheated (dashed lines); and (d) CB-7 (plain lines), CB-Blank-2 (dashed lines), and CH-Blank (dotted lines). The m/z 112 to m/z 114 ratio of ∼4 in CB-3, CB-5, and CB-6 is similar to the NIST chlorobenzene m/z 112 to m/z 114 ratio of ∼3. The reheated CB-6-residue EGA traces show a return to background level for chlorobenzene. CB-7 shows a peak at m/z 112 but the temperature cut send to the GCMS excludes this peak. CB-Blank-2 and CH-Blank show and a return to background when no sample is pyrolyzed, after CB samples. The temperature cut sent to the hydrocarbon trap for GCMS analyses is indicated in the plot by the shaded region. The temperature cut for CH-Blank in Figure2d is not represented.
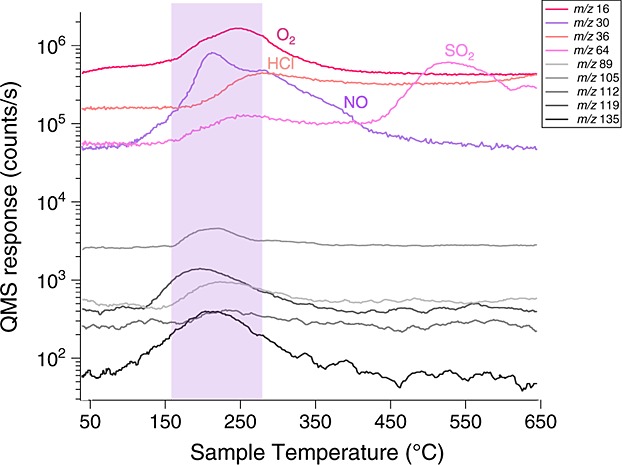
Figure 13.
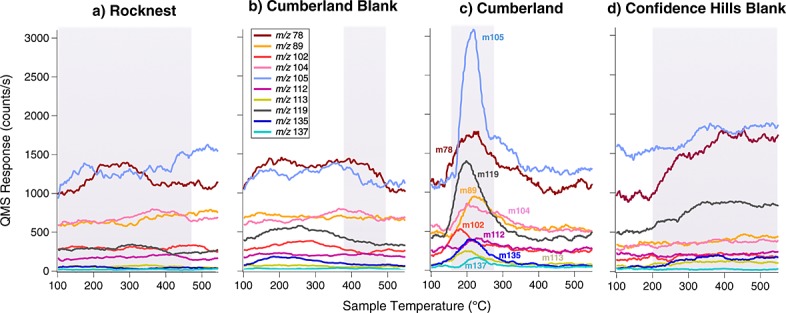
SAM EGA identification of hydrocarbons and chlorobenzene. SAM smoothed EGA data showing selected m/z values plotted in counts per second as a function of modeled sample temperature during pyrolysis over the range of 100–550°C. m/z 78 and m/z 105 were offset in the y axis to fit in the figure. The evolution of several m/z values consistent with the breakdown of aromatic hydrocarbons was observed in the 150–350°C temperature range in (c) Cumberland sample CB-5 but was not observed in precedent (a) Rocknest sample RN-1, (b) Cumberland blank CB-Blank-1, or (d) in subsequent Confidence Hills CH-blank. The temperature cuts sent to the hydrocarbon trap for GCMS analyses are indicated by the shaded zones.
The SAM EGA and GCMS analyses of the heated residual CB-6 triple portion that was run under the same experimental conditions as CB-6, and the CH-Blank run which included a wide hydrocarbon trap temperature cut including the low-temperature release were extremely important to help constrain the source of chlorobenzene and other chlorohydrocarbons detected in CB. The analysis of the CB-6-residue experiment shows that the GCMS abundance of chlorobenzene drops down by a factor of ∼36% (nonbackground subtracted, non-EGA-corrected) compared to the CB-6 experiment, run with the same GC temperature cut. The background level of chlorobenzene remained elevated in the following CB-7 triple portion run that utilized a high-temperature GC cut, as well as the following empty cup (CB-Blank-2). However, the chlorobenzene abundance in the CH-Blank and CH sample runs returned to the average background levels observed before the CB chlorobenzene rise (Table1), despite the fact that a significant amount of HCl and O2 were sent to the hydrocarbon trap in the CH sample run (Figure8). Moreover, the EGA data from the CB-6-residue, CB-Blank-2, and CH-Blank runs which is completely decoupled from the hydrocarbon trap and GCMS data do not show any evidence for chlorobenzene (m/z 112 and m/z 114) released during pyrolysis (Figure2), which eliminates the possibility of artifact detection in CB-5 and CB-6.
3.2 Dichlorinated Alkanes
Trace levels of 1,2-dichloropropane (1,2-DCP—C3H6Cl2, up to ∼26 pmol or ∼70 ppbw), 1,2-dichloroethane (C2H4Cl2) and 1,1- and 1,2-dichlorobutane (C4H8Cl2) (below quantification limit) were identified by GCMS in CB-3 and CB-5 (Figure6 and Table1), although GC coelution with other compounds complicates a definitive identification of 1,2-dichloroethane (Figure6). No 1,2-DCP was detected in any of the laboratory MTBSTFA-perchlorate pyrolysis experiments and no C3-alkanes have been detected as possible precursors in similar laboratory experiments. Moreover, there is no detection of dichloroalkanes in any of the blank runs, RN sample runs, the reheated CB-6-residue run or CH runs (Table1).
Laboratory experiments in which a C3-alcohol (n-propanol) was pyrolyzed under SAM-like conditions in the presence of 50 µg Ca-perchlorate produced chloropropanes, including 2-chloropropane, 1,2-DCP, and 1,2,3-trichloropropane. Of the chloropropanes formed through this reaction, 1,2-DCP was the most abundant. 2-Chloropropane coelutes with dichloromethane under the lab experiment conditions and therefore could not be accurately quantified; however, 1,2-DCP was approximately 5 times more abundant than 1,2,3-trichloropropane. Additionally, a laboratory experiment in which a 1% propane and 99% helium gas mixture was introduced to the hydrocarbon trap during the pyrolysis of 50 µg Ca-perchlorate resulted in the formation of 1,2-DCP (Figure 14). Pyrolysis of samples of kerogen-like organic matter isolated from the Murchison meteorite, in the presence of perchlorates, also yielded 1,2-DCP, (Figure 11), and dichlorobutane, chloropropanone, and dichloropropanone were tentatively identified. Alkylthiophenes and alkylbenzenes, which are the main organic compounds populating the Murchison kerogen, were reduced when pyrolyzed with Ca-perchlorate suggesting additional decomposition of the organic matter released from Murchison due to reactions with Ca-perchlorate.
Figure 14.
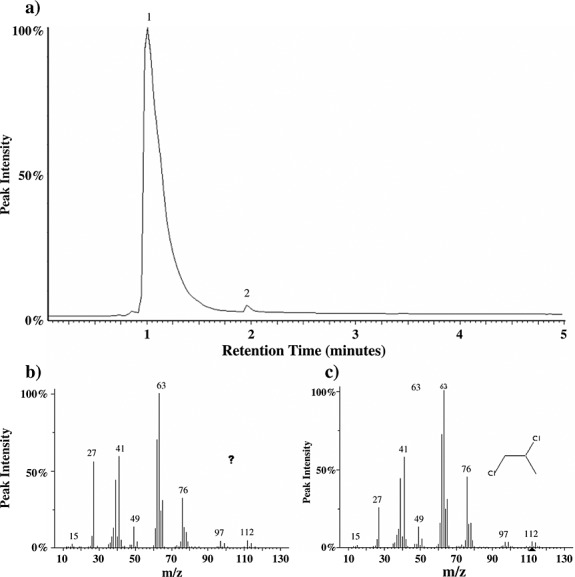
(a) Laboratory study showing the total ion chromatogram resulting from the pyrolysis of Ca-perchlorate in the presence of propane gas. The main compounds detected after the reaction of propane gas with Ca-perchlorate decomposition products are propane (peak 1) and 1,2-DCP (peak 2). 1,2-DCP is identified based on comparison of (b) the mass spectra for peak 2 with (c) the known mass spectra for 1,2-DCP based on a NIST library search.
4 Discussion
4.1 Chlorobenzene
4.1.1 Chlorobenzene Analyzed in GCMS
Chlorobenzene was identified at levels of ∼90 to ∼180 pmol (∼150 to 300 ppbw) in CB-3, CB-5, and CB-6. The absence of chlorobenzene above background in the first two GCMS CB-1 and CB-2 analyses is explained by the higher GC temperature cuts that were used, which excluded the release of several aromatic hydrocarbon fragments observed in EGA. However, chlorobenzene had already been identified by GCMS at RN, JK and in previous and subsequent blank runs at background levels ranging from 2 to 10 pmol (Table1) and was attributed to reactions between HCl, O2, and other oxidants, released from the samples during pyrolysis or present in the SAM gas lines, and the Tenax porous polymer (2,6-diphenyl-p-phenylene oxide) adsorbent used in the SAM hydrocarbon traps [Glavin et al., 2013] (Figure5). However, there appear to be no significant correlations between the total amounts of HCl, O2, NO or SO2 sent to the hydrocarbon trap in each run and the total (i.e., not background-subtracted) chlorobenzene abundances measured by GCMS at RN, JK, CB, and CH (Figures8 and 9). This observation confirmed that chemical reactions between these volatiles released from the samples and Tenax cannot solely explain the elevated chlorobenzene abundances observed in the CB-3 to CB-6 experiments.
The presence of chlorobenzene in post-CB-6 GCMS runs (Table1) may be explained by incomplete desorption of chlorobenzene from the hydrocarbon or injection trap(s) and/or gas processing system collected during the CB-3, CB-5, and CB-6 triple portion experiment. Based on the SAM GCMS data, it is clear that after the first introduction of chlorobenzene released from CB-3 to CB-6 samples to the SAM hydrocarbon trap, the GCMS background level of chlorobenzene increased. In addition, the simultaneous presence of a known HCl background and a hypothetical high molecular weight and low volatility parent aromatic compounds for chlorobenzene (such as benzenecarboxylates) indigenous to the sample, may also explain the residual detection of chlorobenzene in the GCMS CB-6-residue, CB-Blank-2 and higher temperature cut CB-7 experiments. Because empty cup blanks were not run between each solid sample analysis, the change in GCMS chlorobenzene background levels between the experiments CB-3 to CB-6 remains unclear. This change is thus taken into account in the background-subtracted data presented in Table1. When the chlorobenzene average abundances measured by GCMS in the CB-6-residue, CB-7 and CB-Blank-2 runs (∼44 pmol) are subtracted from the levels of chlorobenzene measured in the CB-5 and CB-6 analyses, a positive detection of chlorobenzene above background of ∼27 pmol in CB-5 and ∼30 pmol in CB-6 remains. The EGA-corrected chlorobenzene abundances calculated from the background-subtracted abundances show an almost twofold increase from the CB-5 single-portion to the CB-6 triple portion analyses. Due to possible additional combustion of organics during pyrolysis and possible incomplete transfers through the SAM gas processing system, the chlorobenzene abundances reported here represent a lower limit of the amount of chlorobenzene originally present in the sample prior to pyrolysis. The CH-Blank and subsequent CH-1 sample GCMS runs display a return to the average background level for chlorobenzene, which confirms that any chlorobenzene carry over from the CB runs in the SAM gas processing system had been completely removed. It is worth noting that between the last CB run (CB-Blank-2) and the CH-Blank, a SAM combustion experiment was conducted where O2 gas was introduced into the SAM gas lines at ∼135°C. This combustion experiment may have removed the residual chlorobenzene or chlorobenzene precursors from the SAM gas lines that were responsible for the chlorobenzene carryover observed in the CB-6-residue, CB-7, and CB-Blank-2 runs.
4.1.2 Chlorobenzene and MTBSTFA
The evidence for decoupling of chlorobenzene from terrestrial sources is provided by the observation that the chlorobenzene abundances did not decrease in the CB-5 and CB-6 runs in which the terrestrial MTBSTFA carbon sources within SAM were significantly reduced and did not increase in the CH-1 sample run where MTBSTFA reduction was not employed (Figure4). Indeed, chlorobenzene is present at nearly the same abundance (both background and nonbackground-subtracted, non-EGA-corrected m/z 112 abundance), and approximately twofold higher (background-subtracted, EGA-corrected m/z 112 abundance), in the CB-6 triple portion compared to CB-5 single-portion run (Table1). The chlorobenzene abundance then decreased back down to the original chlorobenzene background level in the CH-Blank and CH-1 runs. Since the chlorobenzene abundances do not follow the MTBSTFA abundance trend, as the chloromethanes do (Figure4), MTBSTFA cannot be a source of chlorobenzene in SAM.
In addition, laboratory pyrolysis GCMS experiments show that the chlorobenzene abundances do not vary when a sample is pyrolyzed in the presence or absence of MTBSTFA (Figure7). This experiment supports the conclusion that MTBSTFA cannot be a carbon source for chlorobenzene under the experimental conditions employed, since the amount of MTBSTFA used in the laboratory experiment (1.7 µmol) is about 1 order of magnitude higher than the highest estimation of MTBSTFA abundance in the SAM background before each experiment (∼116 nmol). The chlorobenzene background in this laboratory experiment is attributed to reactions of the chlorine in its reduced form (HCl) and O2 released during pyrolysis of perchlorate with aromatic molecules derived from the Tenax TA of the hydrocarbon trap.
4.1.3 Chlorobenzene and Tenax
When heated to 300°C during thermal desorption, Tenax produces trace amounts of various aromatic molecules: benzene, toluene, ethylbenzene, xylene, phenylethyne, styrene, naphthalene, biphenyl, and phenol (Figure5). Phenol is also observed at low abundance in the SAM GCMS data and laboratory GCMS experiments under its derivatized form, tert-butyldimethylsilylphenol (TBDMS-phenol). The phenol released from the trap is therefore the most likely precursor of the chlorobenzene observed in the laboratory experiments as well as in the SAM blank runs, since laboratory experiments have shown that functionalized aromatic molecules can readily react with perchlorate decomposition products to form chlorobenzene, while those chlorinated decomposition products do not substitute easily for H or methyl groups from benzene and toluene. In SAM, this reaction, along with EGA evidence of an increasing amount of HCl background in SAM after the first solid sample run at RN, indicates that HCl is building up along the SAM sample-processing pathway and may explain why chlorobenzene has also been observed at background level in the SAM blanks other than RN. Residual HCl within SAM is thus available to react with phenol released from the Tenax component of the hydrocarbon trap during heating.
Consideration was thus also given to the possibility of production of chlorobenzene by chemical reactions on the Tenax polymer trap. We first examined the possibility of an increasing chlorobenzene level reflecting a gradual or an acute degradation of the Tenax from the traps with time. If the increase in chlorobenzene abundance was attributed to an increasing degradation of the traps with time, one would expect to see a gradual increase in chlorobenzene abundances. However, a sudden and significant increase in chlorobenzene was observed from CB-2 (6 ± 1 pmol) to CB-3 (36 ± 7 pmol), CB-5 (71 ± 13 pmol), and CB-6 (74 ± 14 pmol) (nonbackground-subtracted abundances), followed by a decrease in the subsequent samples and a return to the background level in the CH runs (Table1). In case of an acute degradation event, the abundance of chlorobenzene would not decrease after the first significant increase in CB-3. The results from SAM as well as the laboratory results do not support this possibility.
The possibility that the increasing chlorobenzene level observed in the CB samples is the result of a chemical degradation of the Tenax from the HC traps due to the volatiles released from the sample was also examined. HCl, O2, NO, and SO2 abundances were examined as possible sources of trap degradation. SAM data show no correlation between the abundance of these species sent to the HC trap, and the chlorobenzene abundance detected by GCMS (Figure8). However, NO, HCl, and O2 all start to evolve at approximately the same temperature (low temperature, ∼150–200°C) as the release of m/z 112 and m/z 114 attributed to chlorobenzene, explaining a high abundance of the three molecules in the CB runs where chlorobenzene is detected. Cl2, a reactive species originating from the decomposition of Mg-perchlorate, was discarded as a possible contributor of trap degradation and is considered to react with water and readily form HCl. Indeed, its lower molar abundance than H2O in CB, as well as its nondetection in SAM GCMS, strongly suggests that it does not reach the HC trap as Cl2 molecule.
Taken together, the SAM and laboratory observations rule out the possibility that the elevated chlorobenzene abundances detected at CB are due to the degradation of the SAM hydrocarbon trap by perchlorate decomposition products or when exposed to increasing amounts of HCl, O2, NO, or SO2.
4.1.4 Detection of Chlorobenzene by EGA
Since the EGA mode samples the gas stream directly evolved from the sample during pyrolysis, prior to introduction of gas to the hydrocarbon traps, the m/z 112 and m/z 114 ions detected at CB cannot be derived from the Tenax polymers in the traps and provide additional evidence for a CB origin of chlorobenzene. It is also highly unlikely that all of these ions in the CB EGA are from complex reactions between MTBSTFA and oxychlorine phases, because they were not detected in the RN EGA analyses [Glavin et al., 2013] or subsequent CH analyses (Figure2). Moreover, the m/z 112 and m/z 114 signatures were not observed in any of the empty cup blank runs or reheated CB-6 triple portion sample, indicating a sample contribution to these masses for CB-1 to CB-6 and CB-7 runs. The 36Cl/38Cl isotopic ratio found on Mars from HCl measurements is very similar to the one on Earth (3.19 ± 0.03 [Farley et al., 2014] versus 3.08 from NIST). However, due to the collection and processing of the data, a deviation from the 3:1 ratio is expected. It is explained by both coelution with other compounds sharing the same masses and by the scanning rates intrinsic to the SAM MS which requires the peaks area to be fitted in posttreatment. A ∼3.8 ratio of the m/z 112 and m/z 114 ions was also observed in the EGA data during the boil-off segment of the JK-3 experiment, but because the GC temperature cut did not include volatiles released during the boil-off, the JK-3 EGA observation without GCMS confirmation is insufficient to support definitive identification of chlorobenzene at JK. This is nevertheless a secondary level observation that may suggest the presence of chlorobenzene (or precursors) in both JK and CB samples from the Sheepbed mudstone.
The high m/z ions observed in CB EGA and released at low temperature between ∼150 and ∼350°C, displayed on Figure3 for CB-5, are consistent with ions that can be produced from aromatic hydrocarbons released from the CB sample, although other molecular structures may also produce them [McLafferty, 1959]. For example, m/z 105 and m/z 107 both evolve from CB-5 at similar intensities in the EGA analysis at a peak sample temperature of ∼220°C and may be attributed to bromocyanogen (BrCN). However, the identification of this compound has not been confirmed by SAM GCMS and other molecules can contribute to those masses. The m/z 105 observed is thought to have contributions from at least two different ions.
The large increases in chlorobenzene abundance measured by GCMS in CB-3, CB-5, and CB-6 occurred when the hydrocarbon trap temperature cut was modified to collect evolved gases over a lower temperature range (∼157–320°C), which included a fraction of the m/z 112, m/z 114 and other high m/z peaks observed in EGA. Moreover, when the GCMS signals were EGA corrected to account for the fraction of the m/z 112 ion sent to the hydrocarbon trap, the CB-6 triple portion chlorobenzene abundances were about 1.5 to 2 times greater than the CB-3 and CB-5 single-portion levels (Table1). Thus, SAM EGA and GCMS results together make a compelling case for an indigenous aromatic hydrocarbon source of the chlorobenzene released from CB sample in the ∼150–350°C temperature range.
4.2 Dichlorinated Alkanes
1,2-DCP was quantified at abundances up to ∼26 pmol or ∼70 ppbw, and 1,2-dichloroethane and 1,1- and 1,2-dichlorobutane were identified below quantification limit in CB-3 and CB-5 samples (Table1 and Figure6). At the low levels observed in GCMS, 1,2-DCP is not detectable in EGA mode, given that it is below the EGA detection limit. In addition, the base peak of 1,2-DCP (m/z 63) interferes with the mass spectrum of cyanogen chloride, known to be present well above the EGA detection limit. Given these limitations, the identification of 1,2-DCP by EGA is not possible.
The fact that 1,2-DCP was not detected in any of the laboratory MTBSTFA-perchlorate pyrolysis experiments and that no C3-alkanes have been detected as possible precursors in similar experiments, coupled to the significant reduction of volatiles derived from instrument sources in the CB-5 run compared to CB-3 (Figure4) and to the lack of dichloroalkanes detected in any of the blank runs, RN sample runs, or the reheated CB-6-residue run (Table1), indicate that neither MTBSTFA nor Tenax are major carbon contributors to these dichloroalkanes detected in the CB low-temperature cut GCMS analyses. Moreover, the lack of 1,2-DCP in the triple portion CB-6 GCMS analysis (Table1), in which much higher abundances of HCl and O2 were sent to the hydrocarbon trap compared to the single-portion CB-3 and CB-5 runs (Figure8), indicates that 1,2-DCP is not formed from chemical reactions between Tenax breakdown products (e.g., propene) and these oxychlorine decomposition products.
RN and CH analyses included low-temperature GC cuts similar to the ones used in CB-3 and CB-5, establishing a baseline for these CB experiments. The lower abundance of 1,2-DCP in CB-5 (∼14 ± 3 pmol) compared to the CB-3 sample (∼26 ± 5 pmol) may reflect cup and sample pretreatment differences between the runs that could have favored vaporization of 1,2-DCP prior to the CB-5 pyrolysis experiment (Table1), or it may reflect heterogeneity in the different portions of the CB sample. The lack of dichloroalkanes detected in any of the JK runs or CB runs other than CB-3 and CB-5 (Table1 and Figure4) is explained by a higher temperature range of evolved volatiles sent to the hydrocarbon trap for GC analyses and/or by a partial loss of dichloroalkanes or their carbon precursor during the higher temperature sample boil-offs (JK-1-3, CB-6-7) (Table1). Thus, an indigenous carbon precursor in CB is favored as the source for the dichloroalkanes, and through their variety of chain lengths, these C2-, C3-, and C4-chlorinated alkanes support an organic source that includes some structural diversity.
4.3 Organic Precursors Indigenous to the Sheepbed Mudstone
4.3.1 Chlorobenzene Precursors
Since Tenax, MTBSTFA, and other instrument background sources can be ruled out as the primary source of the aromatic hydrocarbon fragments detected during EGA analyses of CB as well as most of the chlorobenzene identified in the GCMS and EGA analyses, one must conclude that these organics originate from the mudstone, either as Martian (hydrothermal, igneous, atmospheric, or biological) or exogenous carbon (meteoritic, cometary, or from interplanetary dust particles (IDPs)). Organic compounds such as polycyclic aromatic hydrocarbons and kerogen delivered to Mars by meteorites, comets, and IDPs infall may undergo successive oxidation reactions to eventually form metastable benzenecarboxylates, including phthalic and mellitic acids [Benner et al., 2000]. These aromatic carboxylic acids are rather stable and not prone to further oxidation, and as such may accumulate in the Martian regolith.
The laboratory experiments show that functionalized group of those aromatic ring structures make them prone to chlorination and formation of chlorobenzene, when pyrolyzed in the presence of Ca- or Mg-perchlorate (Figure10). The yield of chlorobenzene is higher in the experiments with Mg-perchlorate than in experiments with Ca-perchlorate. However, this is again a function of the total HCl formed during the pyrolysis of these two perchlorates; when there is more HCl present, more of the phthalic acid is converted to chlorobenzene.
These results demonstrate that under the experimental conditions, the HCl produced from perchlorate decomposition and subsequent reactions with H2O replaces more electronegative functional groups, like hydroxyl- or carboxylic acid groups, but does not easily substitute for H or methyl groups. Thus, benzene and toluene from the hydrocarbon traps, which are the most abundant compounds released from the thermal degradation of Tenax, are not good candidates for the formation of chlorobenzene. However, the presence of both benzene and iron-bearing phases in the sample, could result in formation of chlorobenzene from an iron-catalyzed reaction between benzene, H2O and HCl vapor. This combination of reactants is very similar to known methods of industrial synthesis of chlorobenzene. Although benzene released from the SAM hydrocarbon traps is not a likely precursor to the chlorobenzene observed in GCMS, benzene from the CB sample might be a possible precursor due to the known presence of metal catalysts in the CB samples, including magnetite, akaganeite, and hematite [Carey, 1993; Vaniman et al., 2014].
The results from the pyrolysis of organic matter isolated from Murchison meteorite in the presence of perchlorate (Figure1) demonstrate that meteoritic kerogen-like macromolecular organic material can be chlorinated from perchlorate-derived decomposition products to form the types of compounds detected by SAM in the Sheepbed mudstone. The Murchison meteorite is used as an analog sample but is not expected to harbor a similar organics composition as the ones present in CB, thus leading to a different set and ratio of chlorinated hydrocarbons. Since aromatic carboxylic acids are of high polarity and low volatility, those organic molecules released during pyrolysis are largely undetectable by GCMS under the SAM GC conditions used. For example, the pyrolysis of ppm levels of mellitic acid in fused silica in laboratory pyr-GCMS and EGA experiments carried out under SAM-like conditions leads to the formation of CO and CO2, and none of the mellitic acid or its expected hydrocarbon by-products were identified. Nevertheless, these metastable partially oxidized products could be good candidates as precursors of the chlorobenzene detected in the Sheepbed mudstone. It is also possible that chlorobenzene formed during pyrolysis from a reaction between benzene (base peak m/z 78), H2O, and HCl vapor released from the sample in the presence of iron-containing catalysts [Carey, 1993] such as magnetite, akaganeite, or hematite, all known to be present in CB [Vaniman et al., 2014].
4.3.2 Dichloroalkanes Precursors
Alkyl components in CB could act as precursors for the dichloroalkanes detected in the Sheepbed mudstone. The tentative identification of propane in the CB-5 GCMS analysis (data not shown), made difficult by its low retention time and weak mass spectrum, may indicate that aliphatic hydrocarbons are available to act as precursors for the 1,2-DCP detected in CB. This propane may be a fragment of a larger hydrocarbon in the CB sample and C3 hydrocarbons may participate in the formation of 1,2-DCP in the presence of reactive oxychlorine. C3 alcohol and alkane were tested against chlorination when pyrolyzed in the presence of Ca-perchlorate. Although the propane introduced in this experiment (Figure4) was not pyrolyzed directly in the presence of the perchlorate, as it might be in SAM, this experiment demonstrates that propane formed during pyrolysis can react with perchlorate decomposition products in the gas phase to form mostly 1,2-DCP. Although 1,2-DCP was identified with SAM, other C3 chlorinated hydrocarbons including 2-chloropropane and 1,2,3-dichloropropane have not been identified, as they were in laboratory runs. Traces of 1,2-DCP were also identified when Murchison organic matter was pyrolyzed in the presence of Ca-perchlorate (Figure1), suggesting a variety of precursors leading to 1,2-DCP. The identification of 1,2-DCP, 1,1- and 1,2-dichlorobutane, and possibly 1,2-dichloroethane by SAM, coupled with the elevated abundance of chloromethanes measured by EGA in JK and CB compared to RN [Ming et al., 2014], may indicate that the same chlorination reaction is occurring on C1 to C4 alkyl precursors present in the Martian mudstone samples.
Although it is thought that the chlorinated forms of the organic molecules detected by SAM are formed during pyrolysis, the presence of chlorobenzene and 1,2-DCP as such in the Sheepbed mudstone cannot be excluded. However, the boiling temperature range of chlorobenzene below 40°C at the pressures the sample is exposed to, before the pyrolysis ramp, is estimated to be lower than the sample handoff of ∼45°C, which make the presence of chlorobenzene as such in the low-temperature release part of the sample unlikely.
The low-temperature CO2 release that was observed in EGA in the JK and CB portions but was not observed in RN may be due to the combustion of Martian or exogenous organic matter in the mudstone [Ming et al., 2014]. The trace element inventory of the Sheepbed mudstone is consistent with a meteoritic component [McLennan et al., 2014], which could be a source of organic matter and may contribute to the carbon source responsible for the chlorobenzene and dichloroalkanes observed at CB.
4.4 Preservation of Organic Molecules on Mars
Organic compounds in ancient sedimentary rocks on Mars could include polycyclic aromatic hydrocarbons and refractory organic material, either formed on Mars from igneous, hydrothermal, atmospheric, or biological processes [Shock, 1990; Steele et al., 2012] or, alternatively, delivered directly to Mars via meteorites, comets, or interplanetary dust particles [Gibson, 1992; Sephton, 2012]. The ability to detect organic compounds in Martian sedimentary rocks with SAM is a function of their initial abundance and entrainment as the rock formed, the extent of subsequent degradation during diagenesis, exhumation, and exposure to the surface and near-surface, and the volatility/polarity and minimal combustion of products released during pyrolysis. Destruction or transformation of organic compounds may occur in the near-surface environment of Mars either by oxidants present in the regolith that can permeate the subsurface [Biemann et al., 1977; Kounaves et al., 2014] or by ultraviolet and ionizing radiation [Oro and Holzer, 1979; Pavlov et al., 2012]. It has been postulated that organic compounds in near-surface rocks may undergo successive oxidation reactions that eventually form metastable benzenecarboxylates, including phthalic and mellitic acids [Benner et al., 2000]. Energetic cosmic rays can further degrade organics in the top 2 m of the surface [Pavlov et al., 2012] and SAM measurements of the abundance of noble gas isotopes in the CB sample, produced by spallation and neutron capture, established that the mudstone analyzed was exposed to cosmic radiation for ∼78 Ma [Farley et al., 2014], which could have reduced the abundance of organic matter originally present in CB [Oro and Holzer, 1979]. The widespread presence of chlorine on Mars [Keller et al., 2006] and the detection of perchlorate and/or oxychlorine compounds at two very different locations (Phoenix: polar [Hecht et al., 2009] and Curiosity: equatorial [Glavin et al., 2013] landing sites) and the EETA79001 meteorite [Kounaves et al., 2014] support the hypothesis that oxychlorine compounds may be widely distributed in the regolith of Mars. These compounds may be ubiquitous on the Martian surface and may play a critical role in the organic preservation state, not only at Gale Crater but all over the planet. The detection of chlorohydrocarbons illustrates that as already suggested by laboratory studies [Navarro-Gonzalez et al., 2010; Steininger et al., 2012], the presence of an oxychlorine phase, thought to be perchlorate, does not fully inhibit the detection of organics in pyrolysis EGA and GCMS, despite being a strong oxidant when heated in the conditions of the experiment.
5 Conclusion
Organic molecules such as chlorobenzene (C6H5Cl—150 to 300 ppbw) and trace levels of 1,2-dichloropropane (1,2-DCP (C3H6Cl2) up to 70 ppbw), 1,2-dichloroethane (C2H4Cl2), and 1,1- and 1,2-dichlorobutane (C4H8Cl2) (below quantification limit) were identified by GCMS and EGA in multiple CB samples from the Sheepbed mudstone. The discussion above supports elimination of terrestrial carbon as a possible source of the elevated levels of chlorobenzene and the C2 to C4 dichloroalkanes identified in CB. Although the presence of those chlorohydrocarbons as such in the Sheepbed mudstone cannot be excluded, it is thought that they originate from reactions during pyrolysis between Martian oxychlorine and organic aromatic and aliphatic compounds indigenous to the sample.
The MSL search for hydrocarbons is designed to constrain the source, destruction, and transformation of organic compounds in the Mars’ near-surface rocks and soils. The discovery of the presence of chlorinated organic compounds near the surface means that reduced material with covalent bonds has survived despite the abundance of oxidants and significant high-energy radiation exposure through the thin Mars atmosphere. This work provides significant progress toward mapping out potential windows of preservation for chemically reduced organic compounds. This view into ancient Mars begins to provide a context for habitable environments and is a first step toward understanding the presence and diversity of possible prebiotic or biotic molecular signatures.
Acknowledgments
This work could not have been conducted without the continuous support of the SAM and MSL operations, engineering, and scientific teams. NASA provided support for the development and operation of SAM. SAM-GC was supported by funds from the French Space Agency (CNES). C.F. acknowledges the NPP program. C.F., D.P.G., K.E.M., J.L.E., R.E.S., J.P.D., and M.G.M. acknowledge support from the MSL Participating Scientist Program. Data from these SAM experiments are archived in the Planetary Data System (pds.nasa.gov).
References
- Anderson MS, Katz I, Petkov M, Blakkolb B, Mennella J, D’Agostino S, Crisp J, Evans J, Feldman J. Limonadi D. In situ cleaning of instruments for the sensitive detection of organics on Mars. Rev. Sci. Instrum. 2012;83(10) doi: 10.1063/1.4757861. doi: 10.1063/1061.4757861. [DOI] [PubMed] [Google Scholar]
- Archer PD, et al. Abundances and implications of volatile-bearing species from Evolved Gas Analysis of the Rocknest aeolian deposit, Gale Crater, Mars. J. Geophys. Res. Planets. 2014;119:237–254. doi: 10.1002/2013JE004493. [Google Scholar]
- Benner SA, Devine KG, Matveeva LN. Powell DH. The missing organic molecules on Mars. Proc. Natl. Acad. Sci. U.S.A. 2000;97(6):2425–2430. doi: 10.1073/pnas.040539497. [DOI] [PMC free article] [PubMed] [Google Scholar]
- Biemann K. Bada JL. Comment on “Reanalysis of the Viking results suggests perchlorate and organics at midlatitudes on Mars” by Rafael Navarro-Gonzalez et al. J. Geophys. Res. 2011;116 E12001, doi: 10.1029/2011JE003869. [Google Scholar]
- Biemann K, et al. Search for organic and volatile inorganic-compounds in 2 surface samples from Chryse-Planitia Region of Mars. Science. 1976;194(4260):72–76. doi: 10.1126/science.194.4260.72. [DOI] [PubMed] [Google Scholar]
- Biemann K, et al. The search for organic substances and inorganic volatile compounds in the surface of Mars. J. Geophys. Res. 1977;82(28):4641–4658. doi: 10.1029/JS082i028p04641. [Google Scholar]
- Bish DL, et al. X-ray diffraction results from Mars Science Laboratory: Mineralogy of Rocknest at Gale Crater. Science. 2013;341(6153) doi: 10.1126/science.1238932. doi: 10.1126/science.1238932. [DOI] [PubMed] [Google Scholar]
- Blake DF, et al. Curiosity at Gale Crater, Mars: Characterization and analysis of the Rocknest sand shadow. Science. 2013;341(6153) doi: 10.1126/science.1239505. doi: 10.1126/science.1239505. [DOI] [PubMed] [Google Scholar]
- Carey FA. Organic Chemistry. 5th ed. Boston, Mass: McGraw-Hill; 1993. [Google Scholar]
- Deamer DW. Pashley RM. Amphiphilic components of the Murchison carbonaceous chondrite: Surface properties and membrane formation. Origins Life Evol. Biosphere. 1989;19(1):21–38. doi: 10.1007/BF01808285. [DOI] [PubMed] [Google Scholar]
- Farley KA, et al. In-situ radiometric and exposure age dating of the Martian surface. Science. 2014;343(6169) doi: 10.1126/science.1247166. doi: 10.1126/science.1247166. [DOI] [PubMed] [Google Scholar]
- Farmer JD. Des Marais DJ. Exploring for a record of ancient Martian life. J. Geophys. Res. 1999;104(E11):26,977–26,995. doi: 10.1029/1998je000540. doi: 10.1029/1998JE000540. [DOI] [PubMed] [Google Scholar]
- Gibson EK. Volatiles in interplanetary dust particles—A review. J. Geophys. Res. 1992;97(E3):3865–3875. doi: 10.1029/92je00033. doi: 10.1029/92JE00033. [DOI] [PubMed] [Google Scholar]
- Glavin DP, Cleaves HJ, Schubert M, Aubrey A. Bada JL. New method for estimating bacterial cell abundances in natural samples by use of sublimation. Appl. Environ. Microbiol. 2004;70(10):5923–5928. doi: 10.1128/AEM.70.10.5923-5928.2004. [DOI] [PMC free article] [PubMed] [Google Scholar]
- Glavin DP, et al. Evidence for perchlorates and the origin of chlorinated hydrocarbons detected by SAM at the Rocknest aeolian deposit in Gale Crater. J. Geophys. Res. Planets. 2013;118:1955–1973. doi: 10.1002/jgre.20144. [Google Scholar]
- Grotzinger JP, et al. Mars Science Laboratory mission and science investigation. Space Sci. Rev. 2012;170(1–4):5–56. [Google Scholar]
- Grotzinger JP, et al. A habitable fluvio-lacustrine environment at Yellowknife Bay, Gale Crater, Mars. Science. 2014;343(6169) doi: 10.1126/science.1242777. doi: 10.1126/science.1242777. [DOI] [PubMed] [Google Scholar]
- Hecht MH, et al. Detection of perchlorate and the soluble chemistry of Martian soil at the Phoenix Lander Site. Science. 2009;325(5936):64–67. doi: 10.1126/science.1172466. [DOI] [PubMed] [Google Scholar]
- Keller JM, et al. Equatorial and midlatitude distribution of chlorine measured by Mars Odyssey GRS. J. Geophys. Res. 2006;111 E03S08, doi: 10.1029/2006JE002679. [Google Scholar]
- Kounaves SP, Carrier BL, O’Neil GD, Stroble ST. Claire MW. Evidence of Martian perchlorate, chlorate, and nitrate in Mars meteorite EETA79001: Implications for oxidants and organics. Icarus. 2014;229:206–213. [Google Scholar]
- Leshin LA, et al. Volatile, isotope, and organic analysis of Martian fines with the Mars Curiosity rover. Science. 2013;341(6153) doi: 10.1126/science.1238937. doi: 10.1126/science.1238937. [DOI] [PubMed] [Google Scholar]
- Mahaffy PR, et al. The sample analysis at Mars investigation and instrument suite. Space Sci. Rev. 2012;170(1–4):401–478. [Google Scholar]
- McLafferty FW. Mass spectrometric analysis—Molecular rearrangements. Anal. Chem. 1959;31(1):82–87. [Google Scholar]
- McLennan SM, et al. Elemental geochemistry of sedimentary rocks in Yellowknife Bay, Gale Crater, Mars. Science. 2014;343(6169) doi: 10.1126/science.1244734. doi: 10.1126/science.1244734. [DOI] [PubMed] [Google Scholar]
- Miller KE, Summons RE, Eigenbrode JL, Freissinet C, Glavin DP. Martin MG. 2013. Analogue experiments identify possible precursor compounds for chlorohydrocarbons detected in SAM, Abstract P23B-1785 presented at 2013 Fall Meeting, AGU, San Francisco, Calif.
- Ming DW, et al. Volatile and organic compositions of sedimentary rocks in Yellowknife Bay, Gale Crater, Mars. Science. 2014;343(6169) doi: 10.1126/science.1245267. doi: 10.1126/science.1245267. [DOI] [PubMed] [Google Scholar]
- Navarro-Gonzalez R, Vargas E, de la Rosa J, Raga AC. McKay CP. Reanalysis of the Viking results suggests perchlorate and organics at midlatitudes on Mars. J. Geophys. Res. 2010;115 E12010, doi: 10.1029/2010JE003599. [Google Scholar]
- Oro J. Holzer G. Photolytic degradation and oxidation of organic-compounds under simulated Martian conditions. J. Mol. Evol. 1979;14(1–3):153–160. doi: 10.1007/BF01732374. [DOI] [PubMed] [Google Scholar]
- Pavlov AA, Vasilyev G, Ostryakov VM, Pavlov AK. Mahaffy P. Degradation of the organic molecules in the shallow subsurface of Mars due to irradiation by cosmic rays. Geophys. Res. Lett. 2012;39 L13202, doi: 10.1029/2012GL052166. [Google Scholar]
- Sephton MA. Pyrolysis and mass spectrometry studies of meteoritic organic matter. Mass Spectrom. Rev. 2012;31(5):560–569. doi: 10.1002/mas.20354. [DOI] [PubMed] [Google Scholar]
- Shock EL. Geochemical constraints on the origin of organic-compounds in hydrothermal systems. Origins Life Evol. Biosphere. 1990;20(3–4):331–367. [Google Scholar]
- Steele A, et al. A reduced organic carbon component in Martian basalts. Science. 2012;337(6091):212–215. doi: 10.1126/science.1220715. [DOI] [PubMed] [Google Scholar]
- Steininger H, Goesmann F. Goetz W. Influence of magnesium perchlorate on the pyrolysis of organic compounds in Mars analogue soils. Planet. Space Sci. 2012;71(1):9–17. [Google Scholar]
- Summons RE, Amend JP, Bish D, Buick R, Cody GD, Des Marais DJ, Dromart G, Eigenbrode JL, Knoll AH. Sumner DY. Preservation of Martian organic and environmental records: Final report of the Mars biosignature working group. Astrobiology. 2011;11(2):157–181. doi: 10.1089/ast.2010.0506. [DOI] [PubMed] [Google Scholar]
- Vaniman DT, et al. Mineralogy of a mudstone at Yellowknife Bay, Gale Crater, Mars. Science. 2014;343(6169) doi: 10.1126/science.1243480. doi: 10.1126/science.1243480. [DOI] [PubMed] [Google Scholar]