Abstract
A mitochondria-targeted ratiometric two-photon fluorescent probe (Mito-MPVQ) for biological zinc ions detection was developed based on quinolone platform. Mito-MPVQ showed large red shifts (68nm) and selective ratiometric signal upon Zn2+ binding. The ratio of emission intensity (I488 nm/I420 nm) increases dramatically from 0.45 to 3.79 (ca. 8-fold). NMR titration and theoretical calculation confirmed the binding of Mito-MPVQ and Zn2+. Mito-MPVQ also exhibited large two-photon absorption cross sections (150GM) at nearly 720 nm and insensitivity to pH within the biologically relevant pH range. Cell imaging indicated that Mito-MPVQ could efficiently located in mitochondria and monitor mitochondrial Zn2+ under two-photon excitation with low cytotoxicity.
Keywords: Mitochondria-targeted, Ratiometric, Two-photon, Fluorescent probe, Zinc ions
1. Introduction
Zinc ion has been known as the second most abundant transition metal ion in the human body, which plays critical role in neurotransmission, enzymatic regulation and cell apoptosis (Xie and Smart, 1991; Berg and Shi, 1996; Vallee and Falchuk, 1993; Bush, 2000; Li et al., 2009). Recent studies revealed that the over-taken of Zn2+ in mitochondria will lead to the accumulation of reactive oxygen species (especially H2O2) and the dysfunction of mitochondria (Sensi et al., 2000; Sensi et al., 2003; Sensi et al., 2009; Chyan et al., 2014). Fluorescent probe has been evaluated as the most powerful tool to monitor biologically relevant species for their high sensitivity and spatial resolution (Egawa et al., 2013; Chen et al., 2013; Radford et al., 2013; Huang et al., 2013; Bae et al., 2013; Jung et al., 2014; Zhang et al., 2014; Hettiarachchi et al., 2014; Zhou et al., 2014). During last years, lots of fluorescent probes for Zn2+ have been developed to detect the cytosolic Zn2+ to understand its role in living system (Zhang et al., 2014; Hettiarachchi et al., 2014; Zhou et al., 2014; Qian et al., 2009; Du et al., 2010; Meng et al., 2012; Guo et al., 2012; Lin et al., 2013; Divya et al., 2014; Hagimori et al., 2015; Lee et al., 2015). Unfortunately, most of the reported Zn2+ fluorescent probes failed to target the mitochondria.
Most of reported fluorescent probes are designed based on single-photon fluorescence technology, which requires excitation with short-wavelength light (ca. 350–550 nm) that limits their application in subcellular organelles and deep-tissue, owing to the shallow penetration depth (less than 80 μm) as well as to photo-bleaching, photo-damage, and cellular auto fluorescence (Sensi et al., 2003; Que et al., 2008; Tomat et al., 2010; McRae et al., 2009; Meng et al., 2006; Zhou et al., 2010). Recently, Two-photon fluorescence (TPF) probes, which can be excited by two-photon absorption in the NIR wavelength, provided an opportunity to overcome the problems originated from the single-photon fluorescence technology (Denk et al., 1990; Yao and Belfield, 2012; Sarkar et al., 2013; Kim et al., 2014; Kim and Cho, 2015; Meng et al., 2012; Park et al., 2012; Sarkar et al., 2014; Jing et al., 2012; Zhang et al., 2014; Wang et al., 2014; Masanta et al., 2011; Zhang et al., 2013; Zhou et al., 2014; Yin et al., 2015). However, most of the reported two-photon fluorescent probes Zn2+ are “turn-on” ones, using enhancement of the fluorescence intensity at only one wavelength as the detection signal. This design may cause difficulty for quantitative determination and quantitative bio-imaging due to the background interference (Baek et al., 2012; Rathore et al., 2014). By comparison, ratiometric probes are better choices that can overcome this particular limitation, because they allow quantitative detection of the analyte by measuring the ratio of emissions at two different wavelengths (Meng et al., 2012; Dunn et al., 1994; Dittmer et al., 2009; Xue et al., 2012; Qin et al., 2011). Therefore, mitochondria-targetable ratiometric fluorescent probes for Zn2+ are still highly needed.
Herein, we design a new two-photon ratiometric probe (Mito-MPVQ) for mitochondrial Zn2+ based on 6-substituted quinoline group, an efficient two photon fluorophore we reported before (Meng et al., 2012) (Scheme 1). Triphenylphosphonium(TPP) group, which was widely used as the mitochondria targeting group (Masanta et al., 2011; Xue et al., 2012; Komatsu et al., 2005; Murphy and Smith, 2007; Dickinson and Chang, 2008; Ross et al., 2008; Dickinson et al., 2010; Dodani et al., 2011), was linked to the fluorescent group to deliver the probe selectively to mitochondria. In order to eliminate the influence of the TPP group to the detection of the Zn2+, a long aliphatic linker was used to separate TPP group from the fluorescent group. We speculate that the new probe will selectively located into mitochondria and give good ratiometric two-photon detection signal to mitochodrial Zn2+. Mito-MPVQ was synthesized from simple starting material (4-Iodoaniline) via 6-steps procedure with overall yield of 15.0% (Scheme S1).
Scheme 1.
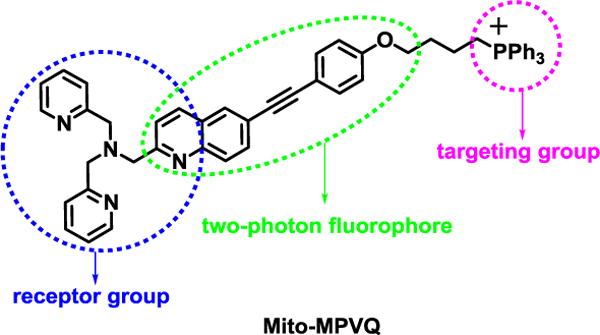
The design of Mito-MPVQ.
2. Experimental section
2.1 General procedures
All reagents and solvents were commercially purchased. All reactions were magnetically stirred and monitored by thin layer chromatography (TLC). Flash chromatography (FC) was performed using silica gel 60 (200–300 mesh). 1H NMR spectra were recorded on Bruker-400 MHz spectrometers and 13C NMR spectra were recorded on 100 MHz spectrometers. Fluorescence spectra were obtained using a HITACHIF-2500 spectrometer. UV-vis absorption spectra were recorded on a Tech-comp UV 1000 spectrophotometer. MS spectra were conducted by Bruker autoflex III MALDI TOF mass spectrometer. A stock solution of Mito-MPVQ (1 mM) was prepared in MeOH. The test solution of Mito-MPVQ (10 μM) in pH 7.4 PBS was prepared. The solutions of various testing species were prepared by dilution of the stock solution with PBS buffer solution. Various ions including Zn2+, Cd2+, Ni2+, Fe2+, Cu2+, Cu+, Ca2+, Co2+, Mg2+, Mn2+, K+, Na+ were prepared. The resulting solutions were shaken well and incubated for 30 min at room temperature before recording the spectra. The two-photon cross section was tested in methanol with 1mM Mito-MPVQ.
2.2 Measurement of two-photon absorption cross-section (δ)
Two-photon excitation fluorescence (TPEF) spectra were measured using femtosecond laser pulse and Ti: sapphire system (680~1080 nm, 80 MHz, 140 fs, Chameleon II) as the light source. All measurements were carried out in air at room temperature. Two-photon absorption cross-sections were measured using two-photon-induced fluorescence measurement technique. The input power from the laser was varied using a variable neutral density filter. The fluorescence was collected perpendicular to the incident beam. A focal-length plano-convex lens was used to direct the fluorescence into a monochromator whose output was coupled to a photomultiplier tube. A counting unit was used to convert the photons into counts (Doan et al, 2015). The TPA cross sections (δ) are determined by comparing their TPEF to that of fluorescein (fluorescein dissolved in water (pH ~11) was used as a standard ((φδ)780 nm = 38 GM).) in different solvents, according to the following equation:
Here, the subscripts ref stands for the reference molecule. δ is the TPA cross-section value, c is the concentration of solution, n is the refractive index of the solution, F is the TPEF integral intensities of the solution emitted at the exciting wavelength, and Φ is the fluorescence quantum yield. The δref value of reference was taken from the literature (Xu and Weeb, 1996).
2.3 Cytotoxicity assays
MTT (5-dimethylthiazol-2-yl-2,5-diphenyltetrazolium bromide) assay was performed as previously reported to test the cytotoxic effect of the probe in cells (Lin et al., 2007). CHO cells were passed and plated to ca. 70% confluence in 96-well plates 24 h before treatment. Prior to Mito-MPVQ treatment, DMEM (Dulbecco’s Modified Eagle Medium) with 10% FCS (Fetal Calf Serum) was removed and replaced with fresh DMEM, and aliquots of Mito-MPVQ stock solutions (1 mM MeOH) were added to obtain final concentrations of 10 and 30 mM respectively. The treated cells were incubated for 24 h at 37 °C under 5% CO2. Subsequently, cells were treated with 5 mg/mL MTT (40 mL/well) and incubated for an additional 4 h (37 °C, 5% CO2). Then the cells were dissolved in DMSO (150 mL/well), and the absorbance at 570 nm was recorded. The cell viability (%) was calculated according to the following equation:
where OD570(sample) represents the optical density of the wells treated with various concentration of Mito-MPVQ and OD570(control) represents that of the wells treated with DMEM containing 10% FCS. The percent of cell survivlvalues is relative to untreated control cells.
2.4 Cell culture and two-photon fluorescence microscopy imaging
CHO cells were cultured in Dulbecco’s Modified Eagle Medium (DMEM) supplemented with 10% FCS, penicillin (100 μg/mL), and streptomycin (100 μg/mL) at 37 °C in a humidified atmosphere with 5% CO2 and 95% air. The cells were incubated with 10 μM Mito-MPVQ at 37 °C under 5% CO2 for 30 min, washed once and bathed in DMEM containing no FCS prior to imaging and/or zinc(II) addition. Zinc(II) was introduced to the cultured cells as the pyrithione salt using a zinc(II)/pyrithione ratio of 1:1. Stock solutions of zinc(II)/pyrithione in MeOH were combined and diluted with DMEM prior to addition. Cells were imaged on a confocal microscope (Zeiss LSM 510 Meta NLO). Two-photon fluorescence microscopy images of labeled cells were obtained by exciting the probes with a mode-locked titanium-sapphire laser source set at wavelength 720 nm.
2.5 Synthesis of Mito-MPVQ
2.5.1 Compound 2
A mixture of 4-iodobenzenamine (22.0 g, 100.0 mmol) and HCl (6 N, 100.0 ml) was heated to 100 °C, then crotonaldehyde (8.4 g, 120.0 mmol) was added slowly, the result mixture was refluxed until TLC shows no raw material exist (about 1 h). After cooling to room temperature, 200 ml H2O was added, the mixture was extracted with acetic ether (100 ml×2) to remove the un-reacted crotonaldehyde. The aqueous phase was neutralized with ammonia water and then extracted with acetic ether (50 ml×2). The organic phase were dried over Na2SO4 and evaporated to give crude residue. The residue was recrystallized in acetic ether / petroleum to give 20.2 g (71.3%) of 2.
1H NMR (400 MHz, CDCl3, ppm): δ 8.13 (s, 1H), 7.90 (d, J = 8.8 Hz, 2H), 7.73 (d, J = 8.9 Hz, 1H), 7.27 (d, J = 8.4 Hz, 1H), 2.72 (s, 3H). 13C NMR (100 MHz, CDCl3, ppm): δ 159.70, 146.77, 138.08, 136.20, 134.93, 130.39, 128.23, 122.69, 90.87, 25.44.
2.5.2 Compound 3
A solution of compound 2 (10.0 g, 37.2 mmol) in 1,4-dioxane (100 ml) was heated to 60 °C. SeO2 (4.9 g, 44.6 mmol) was added to this solution. Then the reaction temperature was increased to 80 °C. After 4 h, the mixture was cooled to room temperature. Precipitates were filtered off and concerntrated to give the crude product. The crude material was purified by column chromatography (acetic ether/petroleum = 10: 1 as the eluent) to give 6.7 g (64.0%) of 3.
1H NMR (400 MHz, CDCl3, ppm): δ 10.20 (s, 1H), 8.32 (s, 1H), 8.20 (d, J = 8.5 Hz, 1H), 8.05 (t, J = 9.1 Hz, 2H), 7.96 (d, J = 8.9 Hz, 1H). 13C NMR (100 MHz, CDCl3, ppm):δ 193.36, 152.86, 146.82, 139.40, 136.72, 136.15, 131.84, 131.39, 118.14, 95.77. HRMS (MALDI-TOF) m/z: [M + H]+ C10H6INO calcd, 283.9567; found, 283.9565.
2.5.3 Compound 4
A mixture of compound 3 (5.7 g, 20.0 mmol), 4-ethynylphenol (2.8 g, 24.0 mmol), Pd2(PPh3)2Cl2 (0.14 g, 0.2 mmol), CuI (0.2 g, 0.5 mmol) and Et3N (30 ml) was stirred at 30 °C for 12 h under the anhydrous and anaerobic conditions. After cooling to room temperature, the mixture was filtered to remove salts, and then 100ml H2O was added. The result mixture was extracted by dichloromethane (50ml×3). The organic phase were combined and dried over Na2SO4 and evaporated to give crude product, which was purified through column chromatography (dichloromethane as the eluent) to give 4.8 g (87.4%) of 4.
1H NMR (400 MHz, CDCl3, ppm): δ 10.12 (s, 1H), 10.07 (s, 1H), 8.58 (d, J = 8.5 Hz, 1H), 8.29 (s, 1H), 8.21 (d, J = 8.7 Hz, 1H), 8.02 (d, J = 8.4 Hz, 1H), 7.94 (d, J = 8.8 Hz, 1H), 7.47 (d, J = 8.0 Hz, 2H), 6.86 (d, J = 8.2 Hz, 2H). 13C NMR (100 MHz, DMSO, ppm): δ 193.50, 158.55, 152.50, 146.31, 137.60, 133.34, 132.84, 130.63, 130.15, 129.58, 123.65, 117.86, 115.86, 111.81, 92.86, 87.03.
2.5.4 Compound 5
A mixture of 4 (4.1 g, 15.0 mmol), KHCO3 (2.3 g, 2.3 mmol) and ACN (30 ml) was heated to 80 °C under the condition of nitrogen. After 1 h, 1,4-Dibromobutane (6.5 g, 30.0 mmol) was added, the result mixture was refluxed until TLC shows no raw material exist (about 8 h). After being cooled to room temperature, the mixture was filtered and the filtrate was evaporated to give crude product. The crude product was purified by column chromatography (DCM: PE=2: 1 as the eluent) to give 4.2 g (68.5%) of 5.
1H NMR (400 MHz, DMSO, ppm): δ 10.13 (s, 1H), 8.61 (d, J = 8.5 Hz, 1H), 8.34 (s, 1H), 8.23 (d, J = 8.8 Hz, 1H), 8.04 (d, J = 8.5 Hz, 1H), 7.97 (d, J = 8.7 Hz, 1H), 7.57 (d, J = 8.4 Hz, 2H), 7.02 (d, J = 8.5 Hz, 2H), 4.04 (t, J = 6.5 Hz, 3H), 3.46 (t, J = 6.4 Hz, 3H), 1.82–1.72 (m, 2H), 1.57 (dt, J = 13.1, 6.4 Hz, 2H). 13C NMR (100 MHz, CDCl3, ppm): δ 193.49, 159.44, 152.64, 147.13, 136.89, 133.37, 133.18, 130.45, 130.41, 129.91, 124.81, 118.01, 114.65, 92.68, 87.64, 66.98, 33.38, 29.41, 27.81.
2.5.5 Compound 6
A mixture of 5 (4.1 g, 10.0 mmol), KHCO3 (1.5 g, 15.0 mmol) and ACN (20 ml) was heated to 80 °C under the condition of nitrogen. After 1 h, PPh3 (5.2 g, 20.0 mmol) was added, the result mixture was refluxed until TLC shows no raw material exist (about 12 h). After being cooled to room temperature, the mixture was filtered and the filtrate was evaporated to give crude product. The crude product was purified through column chromatography (ACN: DCM=2: 1 as the eluent) to give 4.0 g (59.6%) of 6.
1H NMR (400 MHz, CDCl3, ppm): δ 10.22 (s, 1H), 8.27 (d, J = 8.5 Hz, 1H), 8.19 (d, J = 8.8 Hz, 1H), 8.04 (d, J = 8.0 Hz, 2H), 7.87 (dd, J = 12.0, 8.0 Hz, 7H), 7.79 (t, J = 7.5 Hz, 3H), 7.69 (d, J = 7.7 Hz, 6H), 7.50 (d, J = 8.0 Hz, 2H), 6.86 (d, J = 8.1 Hz, 2H), 4.17 (t, J = 5.4 Hz, 2H), 4.03 (t, J = 14.3 Hz, 2H), 2.34–2.20 (m, 2H), 1.89 (d, J = 7.7 Hz, 2H). 13C NMR (100 MHz, CDCl3, ppm): δ 193.51, 159.31, 152.59, 147.11, 136.94, 135.03, 135.00, 133.77, 133.67, 133.38, 133.18, 130.54, 130.46, 130.41, 130.38, 129.92, 124.80, 118.73, 118.01, 117.88, 114.71, 114.58, 92.70, 87.63, 66.59, 29.26, 29.10, 22.25, 21.74, 19.28.
2.5.6 Mito-MPVQ
A mixture of 6 (3.4 g, 5.0 mmol), Di-(2-picolyl)aMine (1.0 g, 5.0 mmol), sodium triacetoxy (1.3 g, 6.0 mmol) and DCM (10 ml) was stirred at 30 °C for 12 h. After cooling to room temperature, the mixture was filtered, and then 20ml H2O was added. The result mixture was extracted by DCM (50ml×3). The organic phase were combined and dried over Na2SO4 and evaporated to give crude product. The crude product was purified through column chromatography (DCM:MeOH:NH3.H2O=10:2:0.5 as the eluent) to give 3.9 g (92.0%) of Mito-MPVQ.
1H NMR (400 MHz, CDCl3, ppm): δ 8.50 (d, J = 4.6 Hz, 2H), 8.35 (d, J = 8.7 Hz, 1H), 8.15 (s, 1H), 7.97 (d, J = 8.7 Hz, 1H), 7.91 (t, J = 7.1 Hz, 3H), 7.79 (dq, J = 10.8, 7.9 Hz, 16H), 7.62 (d, J = 7.7 Hz, 2H), 7.54 (d, J = 7.9 Hz, 2H), 7.30–7.21 (m, 2H), 6.96 (d, J = 8.4 Hz, 2H), 4.10 (t, J = 5.8 Hz, 2H), 3.97 (s, 2H), 3.83 (s, 4H), 3.68 (t, J = 14.8 Hz, 2H), 1.93 (dd, J = 12.4, 6.0 Hz, 2H), 1.72 (dd, J = 10.8, 4.2 Hz, 2H). 13C NMR (100 MHz, DMSO, ppm): δ 173.81, 160.98, 158.86, 158.74, 148.86, 136.58, 136.24, 134.92, 133.63, 133.52, 133.02, 130.71, 130.29, 130.16, 122.70, 122.21, 118.88, 118.03, 114.93, 90.41, 87.76, 77.77, 66.09, 66.03, 59.47, 36.18, 25.50, 24.25, 18.35. m/z: [M - Br]+ C52H46BrN4OP calcd, 773.3404; found, 773.0130.
3. Results and discussion
3.1 UV/vis and fluorescence spectra responses
All spectroscopic measurements are carried out in the methanol-water solutions (1:1, v/v, 50mM PBS buffer, pH=7.4). As shown in Fig. 1, the emission spectra of Mito-MPVQ exhibited a large red-shift of 68 nm (from 420 nm to 488 nm) with an iso-emissive point at 434 nm. The ratio of emission intensity (I488 nm/I420 nm) increases dramatically from 0.45 to 3.79 (ca. 8-fold). There is a linear relationship between the ratio of emission intensity (I488 nm/I420 nm) of Mito-MPVQ and the concentration of the Zn2+. A 8.6-folds enhancement (from 0.028 to 0.242) of the quantum yield was observed after 1 equiv. Zn2+ addition. The apparent dissociation constants (Kd) of Mito-MPVQ with Zn2+ are determined to be 0.85 nM. These results suggested that Mito-MPVQ could be served as an efficient ratiometric fluorescent probe for Zn2+. As shown in Fig. S1, the UV-vis spectrum of Mito-MPVQ also exhibited red-shift with the addition of Zn2+ (0 to 1.2 equiv.), The red-shift of both fluorescence and UV-vis spectra was caused by the enhanced intramolecular charge transfer (ICT) process from donor (oxygen atom) to acceptor (quinoline), which was resulted from the coordination of the nitrogen atom of the quinoline platform with Zn2+. Job’s plot analysis (Fig. S2) confirmed the formation of the complex of Mito-MPVQ with a molar ratio of 1:1 (Mito-MPVQ/Zn2+).
Fig. 1.
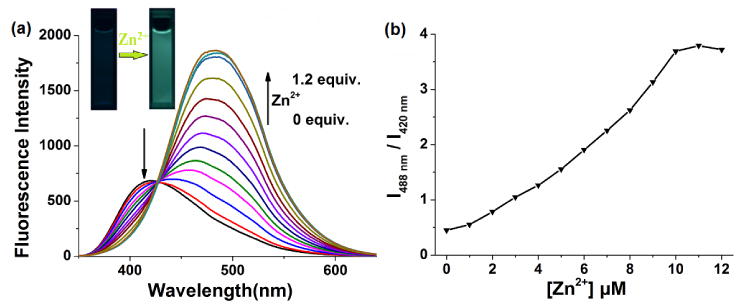
(a) Emission spectra of Mito-MPVQ (10 μM) with the excitation at 330 nm upon titration with Zn2+ (0, 0.1, 0.2, 0.3, 0.4, 0.5, 0.6, 0.7, 0.8, 0.9, 1.0 and 1.2 equiv.) in the methanol-water solutions (1:1, v/v, 50mM PBS buffer, pH=7.4); (b) ratiometric calibration curve between 420 and 488 nm (I488 nm/I420 nm) as a function of Zn2+ concentration.
3.2 Two-photon absorption studies
The two-photon absorption cross section of Mito-MPVQ was further determined using the two-photon induced fluorescence measurement technique. As shown in Fig. 2, the maximum two-photon absorption cross section (δmax) value of Mito-MPVQ is 37 GM at 720 nm. Upon addition of 1.2 equiv. Zn2+, the δmax value increases greatly to 144 GM at 720 nm. The obvious enhancement of two-photon excitation fluorescence makes Mito-MPVQ a potential two-photon probe for monitoring Zn2+ flux in living systems.
Fig. 2.
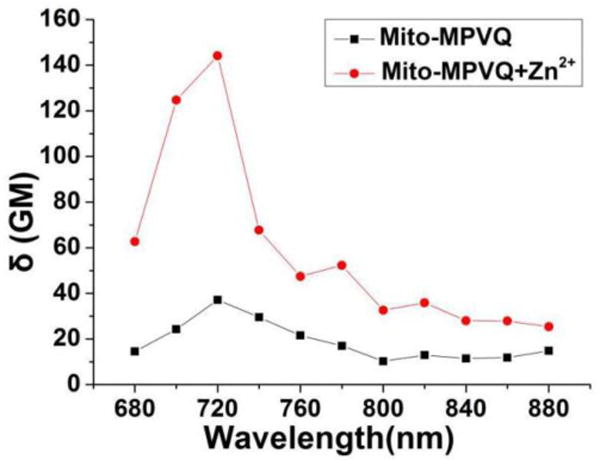
Two-photon absorption cross-section values of Mito-MPVQ with and without Zn2+.
3.3 Ions selectivity and pH stability
The selectivity of the probe was studied in buffered solution. As shown in Fig. 3 and Fig. S3, The common biological ions such as Na+, K+, and Ca2+ show negligible effects on the fluorescence of Mito-MPVQ even at high concentrations (1 mM). Moreover, other metal ions including Co2+, Cu2+, Fe2+, Mg2+, Mn2+, and Ni2+ do not interfere with the probe. Nonetheless, Cd2+ exhibit some enhancement of the fluorescence, which is normal phenomenon observed for many previously developed Zn2+ probes (Meng et al., 2012; Masanta et al., 2011; Rathore et al., 2014; Xue et al., 2012). Fortunately, the interference of Cd2+ is negligible in living cells. As a result, we believe that the present probe should have good selectivity for Zn2+ in the biological studies.
Fig. 3.
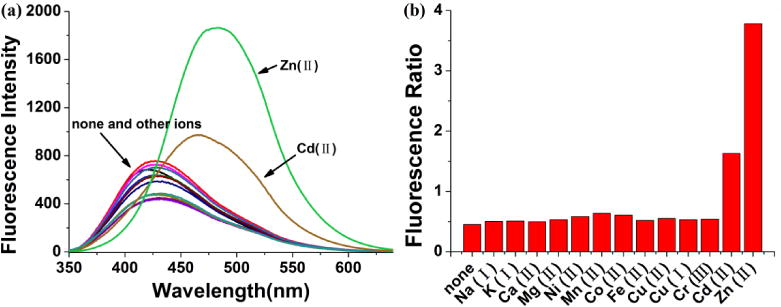
(a) Emission spectra of Mito-MPVQ (10 μM) in the presence of various ions in the methanol-water solutions (1:1, v/v, 50mM PBS buffer, pH=7.4). (b) Fluorescence ratio (I488 nm/I420 nm) of Mito-MPVQ upon addition of various metal ions. Experimental conditions: 10 μM Mito-MPVQ, 1 mM Na+, K+ and Ca2+, 10 μM Mg2+, Cr3+, Ni2+, Co2+, Cu+, Cu2+, Fe2+, Mn2+, Cd2+, Zn2+, for λex = 330 nm.
Furthermore, the pH-dependence of Mito-MPVQ is examined (Fig. S4). In the biological relevant pH range (e.g. 5 – 9), the ratios of fluorescence intensities at 488 nm and 420 nm (I488 nm/I420 nm) of Mito-MPVQ was found to be almost pH insensitive. Therefore, application of Mito-MPVQ in physiological Zn2+ detection is possible.
3.4 1H NMR titration analysis
The binding of Mito-MPVQ with Zn2+ is monitored by the partial 1H NMR spectra. As shown in Fig. S5 and Table S1, upon the addition of Zn2+ to solution (in DMSO-d6) of Mito-MPVQ, the methylene protons of Mito-MPVQ was shifted to downfield regions (Hn 3.83 ppm to4.36 ppm, Hm 3.97 ppm to 4.58 ppm), meanwhile, the pyridine proton of Mito-MPVQ was also shifted to downfield region (Hr 8.50 ppm to 8.95 ppm). The spectral changes suggested that the nitrogen atoms of the receptor group in Mito-MPVQ were binded with Zn2+. However, the proton (Hb 1.95 ppm) near TPP group remained unshifted. These results indicated that the TPP group which was separated by long aliphatic linker didn’t affect the binding proces.
3.5 Theoretical calculation
To further understand the change of the photophysical properties of Mito-MPVQ upon Zn2+ binding, density functional theory (DFT) calculations (with B3LYP/6-31g(d,p) method) (Becke et al., 1993; Lee et al., 1988) of the energy gaps between HOMO (the highest occupied molecular orbitals) and LUMO (the lowest unoccupied molecular orbitals) of Mito-MPVQ and Mito-MPVQ + Zn2+ have been carried out. As shown in Fig. S6, the energy gapes between HOMO and LUMO of Mito-MPVQ and Mito-MPVQ + Zn2+ were calculated to be 3.4 eV and 2.2 eV, respectively. The relatively lower energy gap of Mito-MPVQ + Zn2+ compared with Mito-MPVQ lead to the red shift of the UV-vis and fluorescent spectrum. Meanwhile, the enhanced fluorescent signals in Mito-MPVQ + Zn2+ is also expected, because the orbital matching between HOMO and LUMO in Mito-MPVQ + Zn2+ is significantly higher than that in Mito-MPVQ.
3.5 Cell cytotoxicity and fluorescence colocalization microscopy imaging
Cytotoxicity is a potential side effect of many organic probes when used in living cells or tissues. To ascertain the cytotoxic effect of Mito-MPVQ, the MTT (5-dimethylthi-azol-2-yl-2,5-diphenyltetrazolium bromide) (Lin et al., 2007) assay was performed according to the reported method. CHO cells were treated with 0, 10, and 30 μM Mito-MPVQ for 24 h. The results were illustrated in Fig. S7. The cell viability remained 90% under the treatment of 10 μM Mito-MPVQ, which indicated that the new probe is low cytotoxic to cells and suitable for cell imaging.
To determine the sub-cellular location of Mito-MPVQ in the cells, co-localization study of Mito-MPVQ with MitoTracker® Red CM-H2XRos and LysoTracker® Green DND-26 was conducted in CHO cells. As shown in Fig. 4, the fluorescent images of Mito-MPVQ and MitoTracker® Red CM-H2XRos overlapped very well with each other. The Pearson’s colocalization coefficient (calculated using Autoquant X2 software) of Mito-MPVQ with MitoTracker® Red CM-H2XRos was 0.87. The changes in the intensity profile of linear regions of interest (ROIs) of Mito-MPVQ and MitoTracker® Red CM-H2XRos were almost synchronous. However, Mito-MPVQ shows poor overlap with LysoTracker® Green DND-26 was observed. The Pearson’s colocalization coefficient is calculated to be 0.46 and changes the ROIs between them were un-synchronous (Fig. S8). These results indicated that Mito-MPVQ was specifically driven to mitochondria in living cells.
Fig. 4.
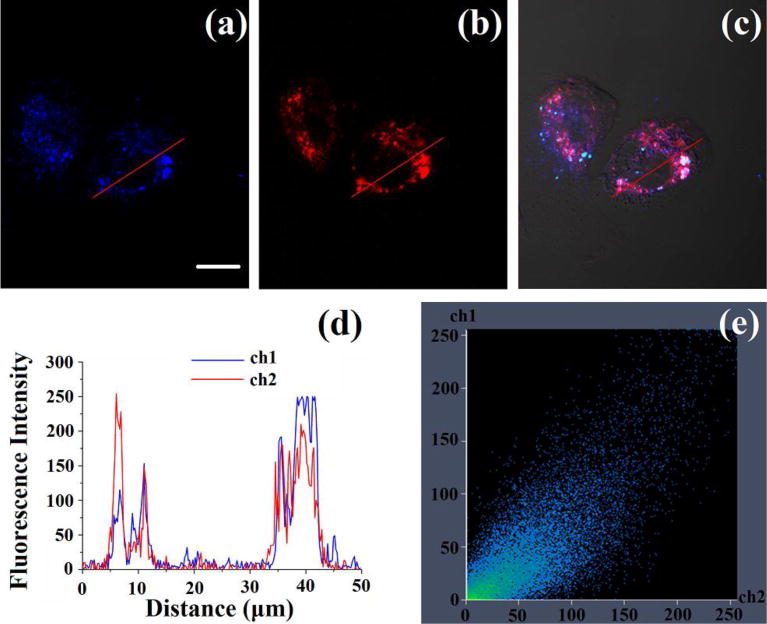
(a–c) Confocal fluorescence images of CHO cells. The cells were incubated with Mito-MPVQ (10 μM) and Mito Tracker Red (0.5μM) for 30 min. (a) Two-photon image of CHO cells, emission from the blue channel, λex = 720 nm, λem = 400–450 nm; (b) one-photon image of CHO cells, emission from the red channel, λex = 579 nm, λem = 590 nm; (c) merged image of (a), (b) and bright-field image. (d) Intensity profile of ROIs across CHO cells. Red lines represent the intensity of Mito Tracker Red and green lines represent the intensity of Mito-MPVQ. (e) Correlation plot of Mito Tracker Red and Mito-MPVQ (0.87). Magnification: 40; scale bar: 20 μm.
With above data in hand, we next applied Mito-MPVQ as a two-photon fluorescent probe for detection of mitochondrial Zn2+ in living cells. According to the fluorescent properties of the probe, the optical windows at 400–450 and 490–540 nm are chosen for confocal imaging of Mito-MPVQ. As shown in Fig. 5, on addition of Zn2+, fluorescence of the optical windows at 400–450nm (blue channel) turned off while the fluorescence of the optical windows at 490–540nm (green channel) turned on. The ratiometric fluorescent images generated from the above windows suggested that Mito-MPVQ can reveal the variation of mitochondrial Zn2+ in living cells under two-photon excitation.
Fig. 5.
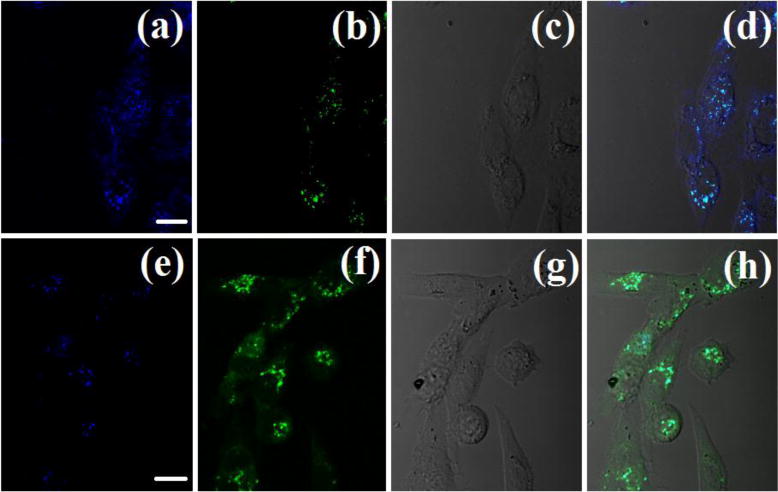
(a) Two-photon image of CHO cells incubated with 15 mM Mito-MPVQ after 30 min of incubation, washed with PBS buffer. λex = 720 nm (emission wavelength from 400 to 450 nm). (b) Emission wavelength from 490 to 540 nm. (c) Bright-field image of CHO cells. (d) The overlay of (a), (b) and (c). (e) Two-photon image following a 30 min treatment with Zn2+ (10 μM). Emission wavelength from 400 to 450 nm. (f) Emission wavelength from 490 to 540 nm. (g) Bright-field image of CHO cells. (h) The overlay of (e), (f) and (g). Magnification: 40; scale bar: 40 μm.
4. Conclusion
In summary, we have developed a mitochondria-targeted ratiometric two-photon fluorescent probe (Mito-MPVQ) for biological Zn2+ detection. Mito-MPVQ shows large red shifts from 420 nm to 488 nm and excellent ratiometric detection signal to Zn2+. The interaction of Mito-MPVQ with Zn2+ was verified by NMR titration and theoretical calculation. Mito-MPVQ exhibits large two-photon absorption cross sections at nearly 720 nm and steady fluorescence within the biologically relevant pH range. Morever, cell culture results demonstrated that Mito-MPVQ could be targeted into mitochondria for monitoring mitochondrial Zn2+ flux with low cytotoxicity under two-photon excitation.
Supplementary Material
Highlights.
Mito-MPVQ could be efficiently located in mitochondria.
Mito-MPVQ showed large red shifts and selective ratiometric detection signal for Zn2+.
Mito-MPVQ exhibited large two-photon absorption cross sections at 720 nm.
Mito-MPVQ can monitor mitochondrial Zn2+ flux under two-photon excitation with low cytotoxicity in living cells.
Acknowledgments
This work was supported by National Natural Science Foundation of China (21102002, 21272223, 21372005), NIH R01 GM101279, the Education Department of Anhui Province and 211 Project of Anhui University.
Footnotes
Publisher's Disclaimer: This is a PDF file of an unedited manuscript that has been accepted for publication. As a service to our customers we are providing this early version of the manuscript. The manuscript will undergo copyediting, typesetting, and review of the resulting proof before it is published in its final citable form. Please note that during the production process errors may be discovered which could affect the content, and all legal disclaimers that apply to the journal pertain.
References
- Baek NY, Heo CH, Lim CS, Masanta G, Cho BR, Kim HM. Chem Commun. 2012;48:4546–4548. doi: 10.1039/c2cc31077e. [DOI] [PubMed] [Google Scholar]
- Bae SK, Heo CH, Choi DJ, Sen D, Joe EH, Cho BR, Kim HM. J Am Chem Soc. 2013;135:9915–9923. doi: 10.1021/ja404004v. [DOI] [PubMed] [Google Scholar]
- Becke AD. J Chem Phys. 1993;98:5648–5652. [Google Scholar]
- Berg JM, Shi Y. Science. 1996;271:1081. doi: 10.1126/science.271.5252.1081. [DOI] [PubMed] [Google Scholar]
- Bush AI. Curr Opin Chem Biol. 2000;4:184–191. doi: 10.1016/s1367-5931(99)00073-3. [DOI] [PubMed] [Google Scholar]
- Chen YC, Zhu CC, Yang ZH, Chen JJ, He YF, Jiao Y, He WJ, Qiu L, Cen JJ, Guo ZJ. Angew Chem. 2013;125:1732–1735. [Google Scholar]
- Chyan W, Zhang DY, Lippard SJ, Radford RJ. Proc Natl Acad Sci U S A. 2014;111:143–148. doi: 10.1073/pnas.1310583110. [DOI] [PMC free article] [PubMed] [Google Scholar]
- Denk W, Strickler JH, Webb WW. Sci. 1990;248:73–76. doi: 10.1126/science.2321027. [DOI] [PubMed] [Google Scholar]
- Dickinson BC, Chang CJ. J Am Chem Soc. 2008;130:9638–9639. doi: 10.1021/ja802355u. [DOI] [PMC free article] [PubMed] [Google Scholar]
- Dickinson BC, Srikun D, Chang CJ. Curr Opin Chem Biol. 2010;14:50–56. doi: 10.1016/j.cbpa.2009.10.014. [DOI] [PMC free article] [PubMed] [Google Scholar]
- Dittmer PJ, Miranda JG, Gorski JA, Palmer AE. J Biol Chem. 2009;284:16289–16297. doi: 10.1074/jbc.M900501200. [DOI] [PMC free article] [PubMed] [Google Scholar]
- Divya KP, Savithri S, Ajayaghosh A. Chem Commun. 2014;50:6020–6022. doi: 10.1039/c4cc00379a. [DOI] [PubMed] [Google Scholar]
- Doan PH, Pitter DRG, Kocher A, Wilson JN, Goodson T. J Am Chem Soc. 2015;137:9198–9201. doi: 10.1021/jacs.5b02674. [DOI] [PubMed] [Google Scholar]
- Dodani SC, Leary SC, Cobine PA, Winge DR, Chang CJ. J Am Chem Soc. 2011;133:8606–8616. doi: 10.1021/ja2004158. [DOI] [PMC free article] [PubMed] [Google Scholar]
- Du JJ, Fan JL, Peng XJ, Li HL, Sun SG. Sens Actuators, B. 2010;144:337–341. [Google Scholar]
- Dunn KW, Mayor S, Myers JN, Maxfield FR. FASEB J. 1994;8:573–582. doi: 10.1096/fasebj.8.9.8005385. [DOI] [PubMed] [Google Scholar]
- Egawa T, Hirabayashi K, Koide Y, Kobayashi C, Takahashi N, Mineno T, Terai T, Ueno T, Komatsu T, Ikegaya I, Matsuki N, Nagano T, Hanaoka K. Angew Chem. 2013;125:3966–3969. doi: 10.1002/anie.201210279. [DOI] [PubMed] [Google Scholar]
- Guo Z, Kim GH, Shin I, Yoon J. Biomaterials. 2012;33:7818–7827. doi: 10.1016/j.biomaterials.2012.07.014. [DOI] [PubMed] [Google Scholar]
- Hagimori M, Temma T, Mizuyama N, Uto T, Yamaguchi Y, Tominaga Y, Mukai T, Saji H. Sens Actuators, B. 2015;213:45–52. [Google Scholar]
- Hettiarachchi SU, Prasai B, McCarley RL. J Am Chem Soc. 2014;136:7575–7578. doi: 10.1021/ja5030707. [DOI] [PMC free article] [PubMed] [Google Scholar]
- Huang CS, Yin Q, Meng JJ, Zhu WP, Yang Y, Qian XH, Xu YF. Chem-Eur J. 2013;19:7739–7747. doi: 10.1002/chem.201300567. [DOI] [PubMed] [Google Scholar]
- Jing J, Chen JJ, Hai Y, Zhan J, Xu P, Zhang JL. Chem Sci. 2012;3:3315–3320. [Google Scholar]
- Jung D, Maiti S, Lee JH, Lee JH, Kim JS. Chem Commun. 2014;50:3044–3047. doi: 10.1039/c3cc49790a. [DOI] [PubMed] [Google Scholar]
- Kim D, Ryu HG, Ahn KH. Org Biomol Chem. 2014;12:4550–4566. doi: 10.1039/c4ob00431k. [DOI] [PubMed] [Google Scholar]
- Kim HM, Cho BR. Chem Rev. 2015;115:5014–5055. doi: 10.1021/cr5004425. [DOI] [PubMed] [Google Scholar]
- Komatsu K, Kikuchi K, Kojima H, Urano Y, Nagano T. J Am Chem Soc. 2005;127:10197–10204. doi: 10.1021/ja050301e. [DOI] [PubMed] [Google Scholar]
- Lee C, Yang WT, Parr RG. Phys Rev B. 1988;37:785. doi: 10.1103/physrevb.37.785. [DOI] [PubMed] [Google Scholar]
- Lee JH, Lee JH, Jung SH, Hyun TK, Feng M, Kim JY, Lee JH, Lee H, Kim JS, Kang C, Kwon KY, Jung JH. Chem Commun. 2015;51:7463–7465. doi: 10.1039/c5cc01364j. [DOI] [PubMed] [Google Scholar]
- Li YM, Shi J, Wu X, Luo ZF, Wang FL, Guo QX. Cell Biochem Funct. 2009;27:417–423. doi: 10.1002/cbf.1598. [DOI] [PubMed] [Google Scholar]
- Lin W, Buccella D, Lippard SJ. J Am Chem Soc. 2013;135:13512–13520. doi: 10.1021/ja4059487. [DOI] [PMC free article] [PubMed] [Google Scholar]
- Lin W, Mohandas B, Fontaine CP, Colvin RA. BioMetals. 2007;20:891–901. doi: 10.1007/s10534-007-9082-y. [DOI] [PubMed] [Google Scholar]
- Masanta G, Lim CS, Kim HJ, Han JH, Kim HM, Cho BR. J Am Chem Soc. 2011;133:5698–5700. doi: 10.1021/ja200444t. [DOI] [PubMed] [Google Scholar]
- McRae R, Bagchi P, Sumalekshmy S, Fahrni CJ. Chem Rev. 2009;109:4780–4827. doi: 10.1021/cr900223a. [DOI] [PMC free article] [PubMed] [Google Scholar]
- Meng XM, Wang SX, Li YM, Zhu MZ, Guo QX. Chem Commun. 2012;48:4196–4198. doi: 10.1039/c2cc30471f. [DOI] [PubMed] [Google Scholar]
- Meng XM, Zhu MZ, Liu L, Guo QX. Tetrahedron Lett. 2006;47:1559–1562. [Google Scholar]
- Murphy MP, Smith RA. Annu Rev Pharmacol Toxicol. 2007;47:629–656. doi: 10.1146/annurev.pharmtox.47.120505.105110. [DOI] [PubMed] [Google Scholar]
- Park HJ, Lim CS, Kim ES, Han JH, Lee TH, Chun HJ, Cho BR. Angew Chem, Int Ed. 2012;51:2673–2676. doi: 10.1002/anie.201109052. [DOI] [PubMed] [Google Scholar]
- Qian F, Zhang CL, Zhang YM, He WJ, Gao X, Hu P, Guo ZJ. J Am Chem Soc. 2009;131:1460–1468. doi: 10.1021/ja806489y. [DOI] [PubMed] [Google Scholar]
- Qin Y, Dittmer PJ, Park JG, Jansen KB, Palmer AE. Proc Natl Acad Sci U S A. 2011;108:7351–7356. doi: 10.1073/pnas.1015686108. [DOI] [PMC free article] [PubMed] [Google Scholar]
- Que EL, Domaille DW, Chang CJ. Chem Rev. 2008;108:1517–1549. doi: 10.1021/cr078203u. [DOI] [PubMed] [Google Scholar]
- Radford RJ, Chyan W, Lippard SJ. Chem Sci. 2013;4:3080–3084. doi: 10.1039/C3SC50974E. [DOI] [PMC free article] [PubMed] [Google Scholar]
- Rathore K, Lim CS, Lee Y, Cho BR. Org Biomol Chem. 2014;12:3406–3412. doi: 10.1039/c4ob00101j. [DOI] [PubMed] [Google Scholar]
- Ross M, Prime T, Abakumova I, James A, Porteous C, Smith R, Murphy M. Biochem J. 2008;411:633–645. doi: 10.1042/BJ20080063. [DOI] [PubMed] [Google Scholar]
- Sarkar AR, Heo CH, Park MY, Lee HW, Kim HM. Chem Commun. 2014;50:1309–1312. doi: 10.1039/c3cc48342h. [DOI] [PubMed] [Google Scholar]
- Sarkar AR, Kang DE, Kim HM, Cho BR. Inorg Chem. 2013;53:1794–1803. doi: 10.1021/ic402475f. [DOI] [PubMed] [Google Scholar]
- Sensi SL, Yin HZ, Weiss JH. Eur J Neurosci. 2000;12:3813–3818. doi: 10.1046/j.1460-9568.2000.00277.x. [DOI] [PubMed] [Google Scholar]
- Sensi SL, Ton-That D, Weiss JH, Rothe A, Gee KR. Cell calcium. 2003;34:281–284. doi: 10.1016/s0143-4160(03)00122-2. [DOI] [PubMed] [Google Scholar]
- Sensi SL, Ton-That D, Sullivan PG, Jonas EA, Gee KR. Proc Natl Acad Sci U S A. 2003;100:6157–6162. doi: 10.1073/pnas.1031598100. [DOI] [PMC free article] [PubMed] [Google Scholar]
- Sensi SL, Paoletti P, Bush AI, Sekler I. Nat Rev Neurosci. 2009;10:780–791. doi: 10.1038/nrn2734. [DOI] [PubMed] [Google Scholar]
- Tomat E, Lippard SJ. Curr Opin Chem Biol. 2010;14:225–230. doi: 10.1016/j.cbpa.2009.12.010. [DOI] [PMC free article] [PubMed] [Google Scholar]
- Vallee BL, Falchuk KH. Physiol Rev. 1993;73:79–118. doi: 10.1152/physrev.1993.73.1.79. [DOI] [PubMed] [Google Scholar]
- Wang JJ, Sun YM, Zhang WJ, Liu Y, Yu XQ, Zhao N. Talanta. 2014;129:241–248. doi: 10.1016/j.talanta.2014.05.039. [DOI] [PubMed] [Google Scholar]
- Xie X, Smart TG. Nature. 1991;349:521–524. doi: 10.1038/349521a0. [DOI] [PubMed] [Google Scholar]
- Xu C, Webb WW. J Opt Soc Am B. 1996;13:481–491. [Google Scholar]
- Xue L, Li GP, Yu CL, Jiang H. Chem-Eur J. 2012;18:1050–1054. doi: 10.1002/chem.201103007. [DOI] [PubMed] [Google Scholar]
- Yao S, Belfield KD. Eur J Org Chem. 2012;17:3199–3217. [Google Scholar]
- Yin HJ, Zhang BC, Yu HZ, Zhu L, Feng Y, Zhu MZ, Guo QX, Meng XM. J Org Chem. 2015;80:4306–4312. doi: 10.1021/jo502775t. [DOI] [PubMed] [Google Scholar]
- Zhang H, Fan JL, Wang K, Li J, Wang CX, Nie YM, Jiang T, Mu HY, Peng XJ, Jiang K. Anal Chem. 2014;86:9131–9138. doi: 10.1021/ac501944y. [DOI] [PubMed] [Google Scholar]
- Zhang SL, Fan JL, Zhang SZ, Wang JY, Wang XW, Du JJ, Peng XJ. Chem Commun. 2014;50:14021–14024. doi: 10.1039/c4cc05094k. [DOI] [PubMed] [Google Scholar]
- Zhang XF, Xiao Y, Qi J, Qu JL, Kim B, Yue XL, Belfield KD. J Org Chem. 2013;78:9153–9160. doi: 10.1021/jo401379g. [DOI] [PubMed] [Google Scholar]
- Zhou LY, Zhang XB, Wang QQ, Lv YF, Mao GJ, Luo AL, Wu YX, Wu Y, Zhang J, Tan WH. J Am Chem Soc. 2014;136:9838–9841. doi: 10.1021/ja504015t. [DOI] [PubMed] [Google Scholar]
- Zhou XY, Yu BR, Guo YL, Tang XL, Zhang HH, Liu WS. Inorg Chem. 2010;49:4002–4007. doi: 10.1021/ic901354x. [DOI] [PubMed] [Google Scholar]
- Zhou Y, Zhang JF, Yoon J. Chem Rev. 2014;114:5511–5571. doi: 10.1021/cr400352m. [DOI] [PubMed] [Google Scholar]
Associated Data
This section collects any data citations, data availability statements, or supplementary materials included in this article.


