

Transient assembly of polarity sites explains how cell polarity is stably maintained during highly active directional growth.
Keywords: polarity maintenance, microtubule, exocytosis, super-resolution microscopy, PALM, filamentous fungi, Aspergillus, Computational Modeling
Abstract
Polar (directional) cell growth, a key cellular mechanism shared among a wide range of species, relies on targeted insertion of new material at specific locations of the plasma membrane. How these cell polarity sites are stably maintained during massive membrane insertion has remained elusive. Conventional live-cell optical microscopy fails to visualize polarity site formation in the crowded cell membrane environment because of its limited resolution. We have used advanced live-cell imaging techniques to directly observe the localization, assembly, and disassembly processes of cell polarity sites with high spatiotemporal resolution in a rapidly growing filamentous fungus, Aspergillus nidulans. We show that the membrane-associated polarity site marker TeaR is transported on microtubules along with secretory vesicles and forms a protein cluster at that point of the apical membrane where the plus end of the microtubule touches. There, a small patch of membrane is added through exocytosis, and the TeaR cluster gets quickly dispersed over the membrane. There is an incessant disassembly and reassembly of polarity sites at the growth zone, and each new polarity site locus is slightly offset from preceding ones. On the basis of our imaging results and computational modeling, we propose a transient polarity model that explains how cell polarity is stably maintained during highly active directional growth.
INTRODUCTION
Polarity maintenance is an essential mechanism observed in a wide range of cellular contexts, including epithelial cells with apical-basal polarity, neuronal differentiation from dendrites to axons, and migrating cells (1, 2). Plasma membrane polarity marker proteins play key roles in this process. For example, the Rho-family GTPase Cdc42 is a highly conserved regulator of cytoskeleton organization and cell polarity (3). In the budding yeast Saccharomyces cerevisiae, cell polarization is driven by a positive feedback loop between Cdc42-stimulated actin assembly and actomyosin-based vesicular trafficking of Cdc42 (4), which results in accumulation of Cdc42 in small patches at the plasma membrane, where cell surface growth occurs (5).
A crucial, unresolved issue in cell polarity maintenance is how the membrane-associated polarity marker complex persists during cell growth while it is continuously dispersed by new material arriving at the growth site in the form of vesicles (6). Active endocytic recycling to counter membrane diffusion of Cdc42 and recruiting effector complexes of Cdc42 from the cytoplasm contribute to polarity maintenance in the budding yeast (7, 8). Recent mathematical models of Cdc42 trafficking predict that high membrane insertion activity through exocytosis in S. cerevisiae (8 to 32 times faster) can practically eradicate Cdc42 polarity complexes (9). Therefore, for very fast polarized growth, additional mechanisms may be required to avoid dispersion of clusters of polarity markers by exocytosis.
Filamentous fungi are among the most polarized organisms on earth, exhibiting prolific growth at their hyphal tips. In Aspergillus nidulans, elongation is 10 to 30 times faster than bud formation in budding yeast and, thus, at a level at which the polarity complex is predicted to become disturbed by incoming vesicles (6, 7, 10). Still, filamentous fungi are able to maintain cell polarity in the presence of thousands of exocytosis events at the cell tip (apex) every minute (Fig. 1A, left).
Fig. 1. Dynamic localization of TeaR clusters.
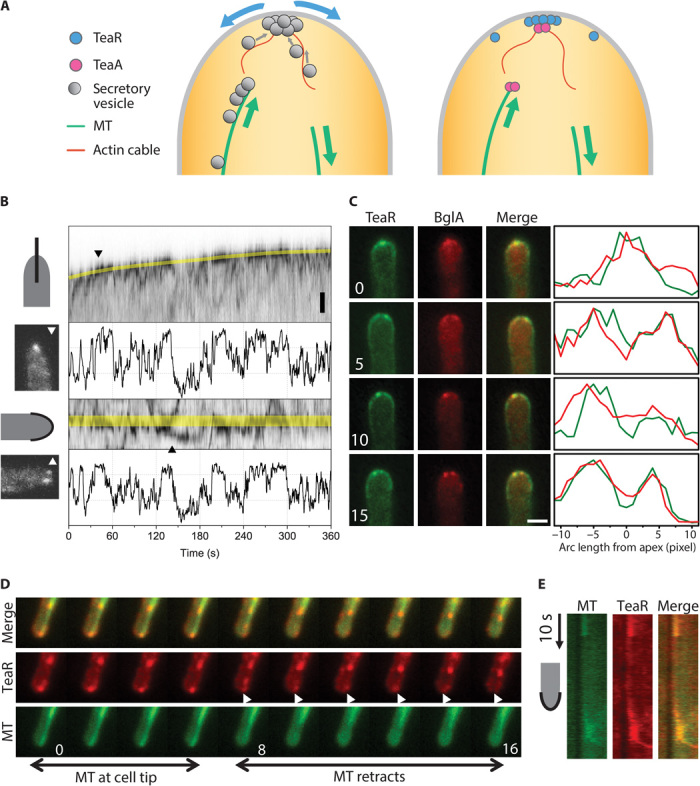
(A) Existing model of cell polarity establishment. Left, from the membrane transport point of view; right, from the protein point of view. (B) Wide-field images of the movement of the mEosFPthermo-TeaR signal along the growth axis (top) and along the apical membrane (bottom) of growing hyphae. Representative images from two time points marked by triangles are shown (t = 46 and 146 s). Scale bar, 1 μm. The fluorescence intensity changes at the apex (marked by yellow lines in the kymographs) are plotted below each kymograph. The intensity scale of the kymographs has been inverted for clarity. (C) Colocalization of mCherry-BglA and GFP-TeaR along the plasma membrane near the apex of a growing hypha; the elapsed time is given in minutes. Scale bar, 2 μm. (D) Comparison of TeaR (red) and MT (green) localization (0 to 16 s from movie S1); elapsed time in seconds. (E) Kymograph measured from movie S1 along the apical plasma membrane. Vertical arrow, 10 s.
Although a Cdc42 homolog also exists in A. nidulans, the polar organization of its actin cytoskeleton is mainly mediated by microtubule (MT)–dependent positioning of proteins known as cell-end markers, initially discovered in fission yeast (11–14). Vesicles are trafficked along MTs and actin cables toward the apex of the hypha for exocytosis (15–19). One of the cell-end markers, TeaA, is delivered specifically to the apex by growing MTs and is anchored to the membrane by direct interaction with another cell-end marker at the plasma membrane, TeaR (Fig. 1A, right) (20). The interaction of TeaA and TeaR at the apical membrane initiates the recruitment of additional downstream components including the formin SepA, which polymerizes actin cables for targeted cargo delivery (21). Mutations of cell-end marker proteins result in highly curved or zigzagged, instead of straight, hyphae (20). Within the growth region of the cell, the position of the polarity site may shift to change the direction of growth, but the polarity site has hitherto been viewed as a persistent feature at the growth region of the cell (22).
Currently, there is no clear answer to the question as to how cell polarity is maintained during incessant vesicle exocytosis, especially for rapidly growing systems such as filamentous fungi. The problem is extremely challenging to investigate because conventional live-cell imaging methods lack the resolution to capture the complex process. Here, we have performed epifluorescence and superresolution fluorescence imaging to study the localization and stability of cell-end marker protein complexes in filamentous fungal cells during cell extension. To this end, we have explored in unprecedented detail the spatiotemporal relationships between the membrane-binding cell-end marker protein TeaR and other components of the polarity maintaining machinery, such as the cytoskeleton and markers of secretory vesicles and the exocytosis site. We present clear evidence that polarity sites, identified by the presence of TeaR clusters, are highly dynamic and go through repeated disassembly-reassembly cycles during cell growth. We have directly observed that TeaR is delivered to and subsequently dispersed at the site of cell growth. Additionally, nanometer-resolved time-lapse images show continual variations of polarity site loci. On the basis of previous knowledge of the system and our current data, we present a refined model of hyphal growth as an example of directional cell growth, which solves the conundrum of how cell polarity is maintained during fast growth.
RESULTS
Dynamics of the polarity site location
The pattern of TeaR polarity sites may vary, ranging from a single patch to a few spots at and/or near the apex of the cell (20). The origin of TeaR patches, as well as the stability of the observed patterns, has remained elusive. To address these questions, we imaged hyphae expressing a fusion protein of mEosFPthermo and TeaR using wide-field fluorescence microscopy (23). mEosFPthermo, a thermostable, monomeric variant of the green-to-red photoconverting fluorescent protein EosFP (24, 25), is widely used for conventional fluorescence imaging, pulse-chase experiments, and, most famously, superresolution photoactivation localization microscopy (PALM) (26, 27). The expression of mEosFPthermo-TeaR under the inducible alcA promoter instead of native TeaR did not show any abnormal phenotype. For image acquisition, mEosFPthermo was preconverted to its red form by 405-nm irradiation. The entire range of localization patterns was observed within a given cell over time in actively growing hyphae (Fig. 1B). Kymographs of TeaR signals show bright TeaR clusters moving continuously toward and away from the apex through the cytosol as well as along the plasma membrane. The number of TeaR clusters near the apex varied between zero and four. The fluctuations are especially obvious when plotting the fluorescence intensity along the marked yellow lines of the kymographs. These data clearly show that TeaR polarity sites are only transiently present at varying locations near the cell tip.
TeaR is anchored to the plasma membrane via a C-terminal prenyl group. TeaR at the membrane recruits a formin-containing complex to the hyphal tip (21). Thus, we may expect that TeaR marks the sites of cell growth through exocytosis. To test this hypothesis, we coexpressed fluorescent TeaR and secretory vesicle marker proteins. Using β-glucosidase (bglA, AN4102) as a secretory vesicle marker, we observed colocalization of the fluorescence from BglA-containing vesicles and TeaR clusters (Fig. 1C). We also found colocalization between mEosFPthermo-TeaR and the exocyst complex marker green fluorescent protein (GFP)–SecC (see below for more information). SecC is a protein involved in the tethering and spatial targeting of secretory vesicles to the plasma membrane before vesicle fusion (28).
To investigate the relationship between spatial fluctuations of TeaR clusters at the apical membrane and the dynamics of MTs, we imaged mEosFPthermo-TeaR in a GFP-MT strain using wide-field microscopy (Fig. 1D and movie S1). In this experiment, a large fraction of mEosFPthermo proteins was preconverted to the red fluorescent state (see the Supplementary Materials). MTs grew toward the hyphal tip, paused in close contact with the apical membrane, and then underwent a catastrophe event resulting in retraction. A kymograph along the hyphal tip shows the appearance of the TeaR signal whenever a MT plus end touches the tip membrane (Fig. 1E). The TeaR fluorescence decreased immediately after MTs started to retract. In general, the more MTs were in contact with the plasma membrane, the more TeaR clusters were found at the tip.
Superresolution imaging of TeaR clusters
To precisely localize TeaR clusters during cell growth, we applied PALM superresolution microscopy (23). Figure 2 shows the resolution enhancement of a PALM image (B) of a hypha expressing mEosFPthermo-TeaR over the corresponding conventional wide-field image (A). The average localization precision of molecules identified in this image is 33 ± 15 nm, yielding a roughly 10-fold improvement in spatial resolution over conventional microscopy. The PALM image reveals a significantly finer structure of the TeaR cluster at the apex than the wide-field image [full width at half maximum (FWHM): PALM, 82 nm; wide-field, 442 nm] (Fig. 2C). Moreover, the reconstructed image has a superior signal-to-noise ratio; it is essentially background-free.
Fig. 2. Fluorescence imaging of mEosFPthermo-TeaR clusters.
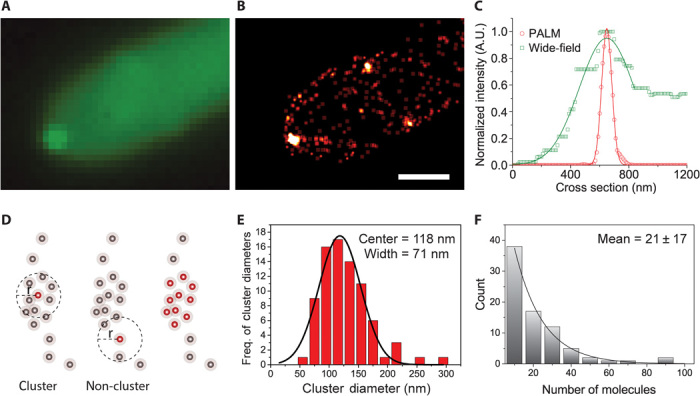
(A and B) Images of mEosFPthermo-TeaR clusters acquired by (A) wide-field microscopy (sum of raw images for PALM) and (B) PALM (500 frames). Scale bar, 1 μm. (C) Comparison of the FWHM values from the wide-field (A) and PALM (B) images, shown by plotting the intensity profiles along the dotted line in fig. S1A. (D) TeaR clusters were quantified by cluster analysis (similar to Ripley’s K) applied to PALM images (500 frames each). To define a cluster, the number of surrounding molecules within a specified radius, r = 50 nm, was quantified and filtered by setting a threshold on the minimum number of molecules, n = 10. (E) Distribution of diameters from cluster analysis (ncluster = 80). The line represents a Gaussian fit; center position and FWHM are quoted in the graph. (F) An exponential fit of the distribution of estimated numbers of molecules; the error was given by the fit.
We performed cluster analysis on molecules identified from short segments of image stacks (500 camera frames obtained within 25 s, ncluster = 80) to characterize TeaR clusters (Fig. 2, D to F, and fig. S1A). The cluster diameter distribution showed a single peak at 118 nm, with an FWHM of 71 nm and a slight shoulder toward larger diameters (Fig. 2D). The TeaR cluster sizes correspond to complexes containing 4 to 28 secretory vesicles, assuming that a secretory vesicle has a typical diameter of 40 nm (29). A similar accumulation of vesicles near the membrane has previously been observed by cryoelectron microscopy in another filamentous fungus, Ashbya gossypii (30). TeaR clusters located at the apex and farther away from the center (side) had identical diameters within the error (fig. S1B). Cluster analysis revealed 21 ± 17 TeaR proteins per cluster on average (Fig. 2F). We note that PALM images reconstructed from longer observation intervals resulted in artificially enlarged clusters because of cluster movement and new clusters appearing at the site (fig. S1C).
Regulation of TeaR cluster sites by TeaA and MT
We further performed simultaneous epifluorescence (GFP-MT) and PALM (mEosFPthermo-TeaR) imaging to take advantage of the enhanced image resolution of PALM and, more importantly, to gain single-molecule sensitivity for detecting TeaR localization. TeaR was predominantly found at the MT plus end and along the plasma membrane. Some of the TeaR molecules also resided in the cytoplasm, as in the previous images. The overlays of the TeaR and MT images show that a fraction of TeaR molecules within the cytoplasm sparsely decorate MT filaments—even several micrometers away from the tip (Fig. 3A and fig. S2B). TeaR molecules are presumably attached to MT-associated secretory vesicles because TeaR is not known to directly interact with MTs. In conventional wide-field imaging, signal contrast was insufficient to clearly detect TeaR along the MT. The same experimental approach was used simultaneously with mEosFPthermo-TeaR to image GFP-SecC (15), a component of the exocyst complex. The two proteins also showed colocalization, but only at the hyphal tip, as expected (fig. S2C).
Fig. 3. TeaR clusters are regulated by TeaA and MT.
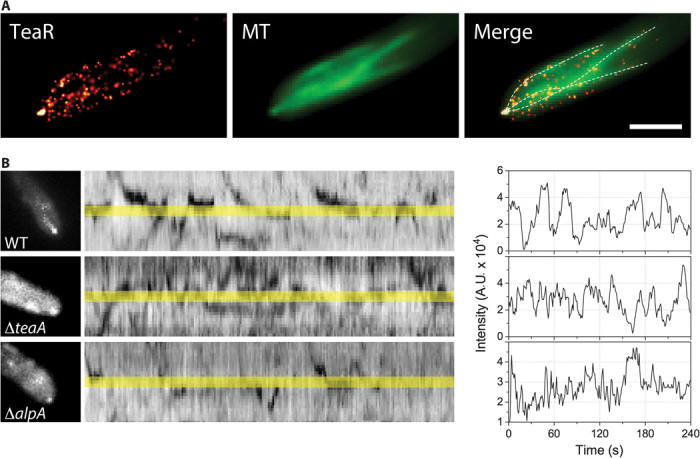
(A) Fluorescence images of TeaR (left; PALM image, 200 frames) and MTs (middle; wide-field microscopy image, sum of raw images from the GFP channel) and the merged image (right). MTs were manually traced from the wide-field image (middle) and are shown as dashed lines over the TeaR image (left) to guide the eye. The signal in the green channel predominantly originates from GFP-MTs because of their overwhelmingly higher concentration (in diffusing dimers and filament forms) and not from the green fluorescent species of mEosFPthermo (see fig. S2A). Scale bar, 2 μm. (B) TeaR clusters were observed by wide-field epifluorescence microscopy in wild type (WT; top), ΔteaA (middle), or ΔalpA (bottom). Kymograph of the movement of the mEosFPthermo-TeaR signal along the apical membrane. (C) Fluorescence intensity along the apex of the growing hypha in (B).
We applied an anti-MT drug (benomyl, 2.5 μg/ml) to assess the role of MTs in the transport of TeaR. Upon addition of benomyl, TeaR signals at the hyphal tips gradually disappeared, indicating that vesicles containing TeaR are transported by MTs (data not shown). Another cell-end marker, TeaA, also localizes at the MT plus ends and is transported to the hyphal tips by growing MTs (20). In the teaA-deletion strain, TeaR accumulation at the hyphal tips is impaired because of the abolished interaction between TeaA at the MT plus end and plasma membrane–associated TeaR. As a consequence, we observed TeaR clusters within a broader range near the apex, and they were stable only for a short period (Fig. 3, B and C). AlpA, a MT polymerase of the XMAP215 family, is required for proper elongation of MTs (13, 31). In the alpA-deletion strain, the frequency of TeaR cluster formation at the apex was obviously decreased (Fig. 3, B and C). Gene deletion analyses further support that the transient assembly of TeaR polarity sites is regulated by the interaction with TeaA at the MT plus ends and by MT-driven transport.
Direct observation of localized cell extension at TeaR polarity sites
Colocalization of TeaR proteins with secretory vesicle markers as well as exocyst markers showed that exocytosis events take place within the diffraction-limited spot representing the polarity site. To investigate the relationship between cell extension and polarity sites, we recorded the localization of TeaR clusters at 5-min intervals at the growing hyphal tip using PALM (Fig. 4A). The image sequence shows that a new cluster site coincides with the site of cell extension (Fig. 4A, bottom row). On close inspection, there are two clusters visible at time points 5 and 10 min. The overlays of cell outlines, from either 0 + 5 min or 5 + 10 min, reveal that the cluster farther away from the apex is behind the outline from the previous time point, whereas the other cluster is located just behind the outline from the later time point (Fig. 4A, arrows). In both cases, the cluster farther away from the apex was recorded at an earlier time within the recorded 25-s imaging time, indicating that the TeaR cluster is instrumental in directing growth.
Fig. 4. TeaR clusters define the growth zone.
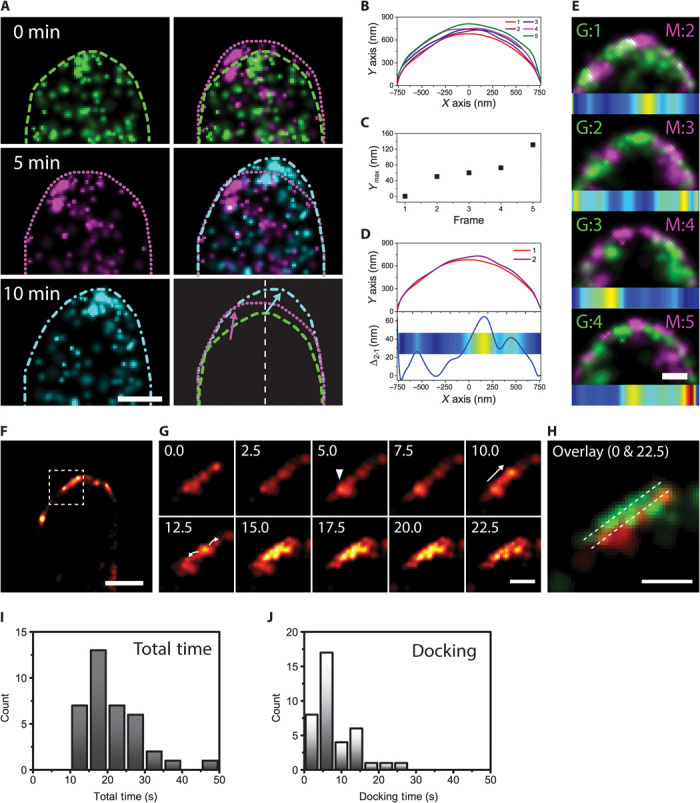
(A) Left column: Series of PALM images of a mEosFPthermo-TeaR–expressing hypha (5-min time interval, 500 frames each). Cell profiles are shown in different line styles. Right column: Overlays of PALM images from two time points (top, 0 + 5 min; middle, 5 + 10 min) and overlay of outlines reveal growth regions coinciding with TeaR cluster locations. (B) Overlay of cell profiles from a series of five PALM images of a mEosFPthermo-TeaR–expressing hypha (75-s time interval, 1500 frames each; see also fig. S3). (C) A plot of the maximum Y value from cell profiles shown in (B) shows overall cell extension. (D) Top: Comparison of cell profiles of the first and the second image in the time series. Bottom: The difference of the profiles represented in a line plot and a color map shows the subregion where the growth has taken place. Hot (red, yellow) and cold (blue, green) colors indicate regions of large and small cell extension, respectively. (E) Overlay of two successive PALM images (color and frame number indicated at the top corner). Colocalized regions will appear in white with this combination of colors. The difference of the cell profiles is shown as a color map below each set of overlaid images. (F) Reconstructed PALM image of a mEosFPthermo-TeaR–expressing hypha (1500 frames). (G) Sequence of close-ups of the region marked by a square in (F), reconstructed by moving-window binning (250 frames each with a shift increment of 50 frames or 2.5 s). They show the appearance of a new cluster (white triangle, t = 5.0 s), a translational movement (t = 10.0 s), and a spreading of the signal along with a slight shift of the pattern. (H) Overlay of the first (red) and the last (green) frame shown in (G) shows a small membrane growth. (I and J) The total lifetimes of the TeaR cluster (I) and the docking time (J) were quantified from the images. Scale bars, 1 μm (A and F); 300 nm (E, G, and H).
To investigate correlations between TeaR cluster locations and cell extension sites with better temporal resolution, we collected a long sequence of camera frames, from which a sequence of PALM images (75-s time interval) was reconstructed. To better quantify cell growth, cell outlines were drawn (Fig. 4B), maximum cell extension along the direction of growth was quantified (Fig. 4C), and the difference of the successive outlines was represented in a color bar to show the sites of growth (Fig. 4D). As in Fig. 4A (right panels), two successive PALM images were overlaid (colored in green for the preceding frame and in magenta for the following frame), with a corresponding color bar under each overlaid image (Fig. 4E). Over the image series, regions of rapid cell extension roughly correspond to locations of TeaR clusters. New TeaR clusters in an image were located at slightly offset locations from the prior image, and there was only a small fraction of colocalized regions between successive images (Fig. 4E and fig. S3A). The two PALM image sequences taken at 5-min and 75-s intervals both indicate that TeaR cluster sites coincide with sites of growth. Growth does not occur homogeneously across the entire apex, but rather within small patches where TeaR polarity sites have been assembled. The low level of colocalization suggests that new polarity sites are established in regions slightly offset from an earlier location. Only after some time delay, a particular region becomes accessible again for an incoming MT to deliver new cargo.
To study the fate of TeaR clusters at higher time resolution, we applied a “moving-window binning” technique to generate sequences of PALM images at 2.5-s intervals (see the Supplementary Materials, Fig. 4, F to H, and movie S2). These data reveal many abrupt appearances and disappearances of clusters near the plasma membrane. In some instances, a cluster moved along the plasma membrane, mostly toward the apex, and then disappeared. In many other instances, however, the appearance of a TeaR cluster was followed by dissolution of the cluster in the direction of the membrane (Fig. 4G). Notably, the spreading of the fluorescence signal occurred at a slightly offset membrane plane (by ~60 nm) in the direction of growth (Fig. 4H). We also quantified the total time and the docking time of events by measuring the initial appearance of the cluster up to the spreading of the fluorescence signal (docking) and until the signal disappeared (total) (Fig. 4, I and J). The total time distribution had a log-normal shape and a characteristic time of 19 s, which is in agreement with data from an in vitro membrane fusion study (32). These observations further support our claim that polarized growth takes place locally at TeaR cluster sites.
To test the timing of actin filament formation in relation to MT arrival at the cell tip, we labeled actin filaments by using tropomyosin (GFP-TpmA) and imaged these simultaneously with MTs (mCherry-TubA) (Fig. 5A). Tropomyosin preferentially decorates F-actin at the hyphal tips (15). Both MT and actin signals showed semiregular intensity fluctuations over time, but the peaks were offset from one another (correlation coefficient = −0.36). Actin signals started to increase after the MT plus ends localized at the tip membrane (Fig. 5A, lower panel, second and third arrows from the left). We suggest that the pattern most likely arises from the semiregular arrivals of MTs at the tip. Whereas the TeaR clusters dispersed immediately upon cell extension, the actin filaments assembled and disassembled much more gradually, indicating that the downstream polarity complex has a longer lifetime than the TeaR cluster.
Fig. 5. Recruitment of a downstream polarity complex triggered by the MT arrival.
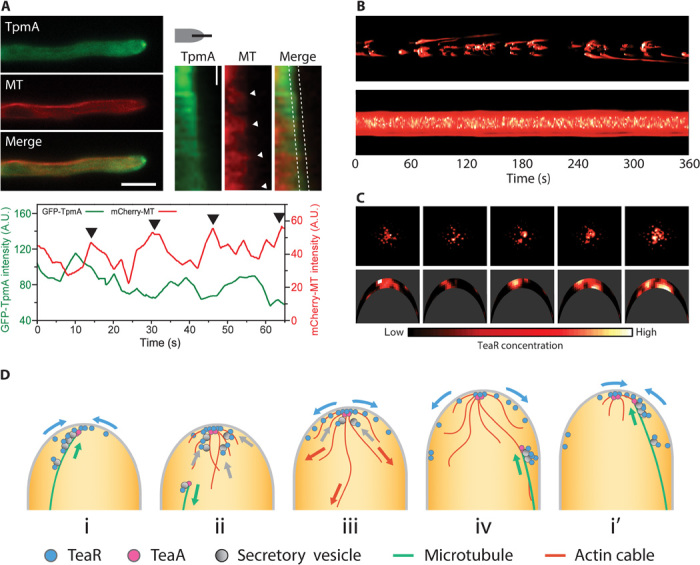
(A) Top left: Wide-field fluorescence images of actin cables (green) and MTs (red). Scale bar, 5 μm. Top right: Kymograph along the apex of the growing hypha. Scale bar, 10 s. Bottom: Fluorescence intensity of actin cables (green) and MTs (red) along the apex of the growing hypha between dotted lines in (top right). (B) Kymograph of TeaR concentration at the hyphal tip generated by a simulation with part (top) or all (bottom) of the secretory vesicle population containing TeaR. (C) Five-second snapshots of the results in (B) viewed from above (top) and from the side of a hyphal tip (bottom; compare with Fig. 4). (D) Cartoon representation of the transient polarity model.
Modeling TeaR dynamics
Our current experimental results with TeaR demonstrate that filamentous fungal cells use multiple transient polarity sites during growth. To test whether this process can maintain directional growth in the midst of fast exocytosis, we combined parameters from our current results with other known parameters of filamentous fungi to build a computational model that simulates a growing hyphal tip. Growth is realized by insertion of the membrane at the tip through exocytosis. Within the simulation, MTs extend to the tip and traffic TeaR on vesicles. These vesicles insert at a basal rate in the absence of actin. Once TeaR is at the tip, the formin-containing complex can form, and actin cables grow down from the tip. The rate of exocytosis increases proportionally to actin abundance at the tip. Robust TeaR cluster formation required the introduction of intermolecular forces into the model, arising from the TeaA-TeaR interaction and the physical confinement of TeaR-loaded secretory vesicles at the MT plus end. In the model, these forces were approximated by the addition of TeaR self-attraction (fig. S4). Without this force, TeaR puncta quickly dissolved through diffusion, similar to the TeaR concentration profiles in ΔteaA (20). The time courses of MT number and total actin intensity at the hyphal tip were simulated on the basis of published and current data (fig. S5). For a detailed description of the model, see the Supplementary Materials, Modeling section, and figs. S4 to S6.
The results of the simulation showed sustained tip growth with TeaR patterns resembling those of the experimental observations (Fig. 5B). TeaR-loaded secretory vesicles were successively transported via the MT plus ends. As a result, TeaR clusters appeared and disappeared at various locations near the cell tip, triggering downstream events that ultimately led to cell extension [Fig. 5, B (top) and C]. Each new nanometer-scale polarity site was established by binding the TeaRs on the plasma membrane that were exocytosed previously. The model reproduced the negative correlation between MT arrival and actin cable formation (fig. S5).
There are several key insights that can be gained from the calculations. First, we predict that there is a fine-tuning of TeaR concentration by the cell to sustain proper polarity site establishment and disassembly. Simulating the growing tip with a model in which every secretory vesicle contains TeaR results in a broad distribution and the persistent presence of a high concentration of TeaR near the tip of the cell (Fig. 5B, bottom). In healthy growing cells, it is possible that TeaR is not present in every secretory vesicle or that some fraction of TeaRs in the vesicle fails to interact with TeaA on the plasma membrane because of an unfavorable orientation. In both cases, this results in a smaller portion of secretory vesicles at the MT plus end being transferred onto the plasma membrane. The remaining vesicles will either be released to the cytosol or transported back with retracting MTs. Our dual-color wide-field imaging of TeaR and MT supports the latter scenario (Fig. 1, D and E). Increasing the proportion of vesicles without TeaR leads to transient appearance of TeaR clusters and cluster movements similar to those experimentally observed [Fig. 1B (bottom) and fig. S6].
DISCUSSION
Although different sizes and patterns have been reported for cell-end marker proteins, the established model of cell polarization maintenance views the polarity site as a permanent feature once the hypha starts to extend from the spore (12, 13, 20, 22). Continuous delivery of vesicles containing cell-end marker proteins to the same site ensures a stable supply of proteins necessary to sustain growth. Computational modeling based on this model predicts that highly frequent exocytosis events, as seen in filamentous fungi, will give rise to loss of cell polarity (9). This indicates that salient pieces are missing in the model. In S. cerevisiae, a recent study reported exocytosis microdomains enriched in phosphatidylserine and Cdc42, surrounded by endocytic zones at the growth region of the cell. The stable, nonuniform segregation of membrane microdomains has been proposed to play a key role in preventing the dispersion of polarity markers (33). However, this model presumably does not apply to more polarized organisms such as A. nidulans, in which exocytosis and endocytosis occur at significantly different sites. Exocytosis sites are near the tip, whereas endocytosis sites are in the subapical region, so that the two are separated by a few hundred nanometers up to a few micrometers (34, 35).
Our current results provide evidence pointing to a refined, “transient polarity model” (Fig. 5D). In contrast to the static picture, the polarity site is transiently established by MTs transporting cell-end marker proteins to the apical membrane (Fig. 5D-i). The polarity sites are localized near the hyphal apex because the MT plus ends reach the physical boundaries and are further stabilized by interactions with proteins such as TeaR and fusion proteins at the plasma membrane (13). When the MT plus ends arrive at the apex (Fig. 1, D and E), downstream processes such as actin polymerization (Fig. 5A) and exocytosis are locally activated (Figs. 4 and 5D-ii). This results in localized cell membrane extension and resupply of TeaR at the plasma membrane (Figs. 4, F to H, and 5D-iii). Overlays of PALM images show that polarity sites from successive images do not overlap (Fig. 4E and fig. S3). This indicates that, once the polarity site is assembled, it persists for some time, during which it prevents an incoming MT from anchoring. The slow decay of the actin signal, contrary to the abrupt decrease of the TeaR signal, indicates that the downstream polarity complex likely remains (Fig. 5A). The persistence of the previous polarity complex allows the subsequent MT to use existing actin as a guide to deliver the next batch of cell-end marker proteins to a nearby region (Fig. 5D-iv, i′). The observed displacement of the new polarity site may also arise from local depletion of interacting proteins (for example, membrane fusion proteins) at the plasma membrane or a low concentration of TeaR upon exocytosis of vesicles lacking TeaR. In any case, a simple offsetting of the polarity site allows the use of previous polarity complex material to recruit more vesicles to the target site without affecting the composition of the region where the polarity site is located. It is possible that the polarity site is further stabilized by membrane microdomains or by polymerization of polarity marker proteins (33, 36). This mechanism is consistent with the previous model and, at the same time, avoids the problem of dispersing the polarity complex by a flood of exocytosis events. It also allows efficient delivery of material evenly around the entire cell tip. Because the polarity site is only transient, new material can be delivered to the membrane after disassembly of the old site. In line with this model, recent work on another filamentous fungus, Neurospora crassa, reports “bursts of exocytosis” at different positions within the apical membrane rather than a persistent exocytosis site. This dynamic mechanism also ensures a swift response because polarized cells often need to readjust their growth direction to respond to environmental signals such as chemotropism or to avoid obstacles (37).
The transient nature of polarity site assembly is also likely to be interrelated with coordinated cycles of cell growth shared among various organisms, including filamentous fungi (38), mammalian cells (39), fission yeast (40), root hairs (41), and pollen tubes (42) in plants. The intracellular Ca2+ level regulates actin assembly and vesicle fusion and is thus closely linked to growth rate (39, 43, 44). Oscillations of the Ca2+ level have also been observed at the hyphal tips in filamentous fungi (45), and Ca2+ is likely to play an important role in regulating actin polymerization and triggering the synchronized fusion of accumulated vesicles within a local region in our system as well.
In conclusion, we have directly visualized the machinery of cell polarity maintenance in a rapidly growing filamentous fungus using advanced fluorescence microscopy techniques. Fungal hyphae do not extend in a continuous fashion, but rather exhibit pulses of growth within small “hot spots” at the hyphal tip. The entire apex advances through successive establishment and rapid turnover of temporary growth zones. New zones are established in regions slightly offset from an earlier location, allowing efficient directional growth while preventing loss of cell polarity. This work clearly demonstrates the great potential of superresolution optical imaging to literally illuminate the details of intricate subcellular processes.
MATERIALS AND METHODS
Sample preparation
A list of A. nidulans strains used in this study is given in table S1. To replace GFP in pNT7 [alcA(p)::gfp::teaR plasmid with N. crassa pyr-4 marker] (20) with mEosFPthermo, mEosFPthermo was amplified with primers Eos_KpnI_fwd (5′-TGGTACCATGAGTGCGATTAAGCCAGAC-3′) and mEos_AscI_rev (5′-TGGCGCGCCCCGTCTGGCATTGTCAGGC-3′), digested by Kpn I and Asc I, and subcloned into Kpn I–Asc I–digested pNT7, yielding pNT65. To create an N-terminal GFP fusion construct of TpmA, full-length tpmA was amplified from genomic DNA, with primers tpmA_fwd (5′-GGCGCGCCCATGGACAGAATCAAGGAG-3′) and tpmA_rev (5′-TTAATTAAACACTGTTCAACGAG-3′), digested by Asc I and Pac I, and subcloned into Asc I–Pac I–digested pCMB17apx [alcA(p)::gfp, for N-terminal fusion of GFP to proteins of interest, with pyr-4 marker], yielding pYH27. The pNT65 and pYH27 plasmids were transformed into the uracil-auxotrophic A. nidulans strain TNO2A3 (ΔnkuA). The integration events were confirmed by polymerase chain reaction and Southern blotting (data not shown). Whenever a certain protein was expressed under the regulatable alcA promoter, cells were cultured in supplemented minimal medium with 2% glycerol (alcA derepressive condition). The expression of mEosFPthermo-TeaR under the inducible alcA promoter instead of native TeaR did not show any abnormal phenotype. The expression of GFP-TeaR under the inducible alcA promoter instead of native TeaR showed the same localization pattern as the GFP-TeaR expressed under the native promoter (20). The supplemented minimal medium for A. nidulans and the standard strain construction procedures are previously described by Takeshita et al. (13). In all other cases, cells were cultured in minimal medium supplemented with 2% glucose. Cells were incubated at 28°C overnight on sterilized coverslips or in a chambered cover glass (Thermo Scientific). An additional coverslip was gently placed on top for imaging.
Live-cell imaging
All GFP/mCherry fluorescence images were captured using an upright microscope (Axiophot, Zeiss) equipped with an oil immersion objective lens [Plan-Apochromat, 63×, numerical aperture (NA) 1.4, Zeiss], a charge-coupled device (CCD) camera (AxioCam MRm, Zeiss), and a mercury arc lamp (HXP 120, Zeiss). Images were processed and analyzed using Zen software (Zeiss). All other conventional fluorescence and superresolution cell images were obtained by an inverted microscope (Axiovert 200, Zeiss) equipped with a high-NA water immersion objective (C-Apochromat, 63×, NA 1.2, Zeiss), multiple excitation laser lines (405, 473, and 561 nm), an image splitter (Optosplit, Cairn Research Ltd.), and an electron-multiplying CCD camera (Ixon Ultra 897, Andor). Recorded image stacks were analyzed using Fiji (46) for conventional fluorescence data and custom-written Matlab software, a-livePALM (47). For details, see the Supplementary Materials, PALM Imaging section.
Modeling
A computational model of a growing hyphal tip was generated to look into the mechanisms controlling TeaR dynamics. The model was built using new and prepublished data. Modeling parameters were either set (i) by using measured data or (ii) by fitting to resemble TeaR profiles (qualitative data) and/or (iii) to reproduce the negative correlation between TeaR abundance at the tip and growth rate (quantitative data). The parameters are compiled in table S2. Typical TeaR concentration profiles were constructed from computer simulation results. For details, see the Supplementary Materials, Modeling section.
Acknowledgments
We thank B. Oakley (The University of Kansas) for the SecC-GFP strain. We acknowledge support by Deutsche Forschungsgemeinschaft and Open Access Publishing Fund of Karlsruhe Institute of Technology. Funding: The work was supported by the DFG (German Research Foundation) (TA819/2-1, NI291/9-1, FOR1334, and CFN) and the Baden-Württemberg Stiftung. G.U.N. acknowledges funding by the KIT in the context of the Helmholtz program Science and Technology of Nanosystems (STN). N.S. was funded by a Wellcome Trust ISSF Non-Clinical Fellowship. Author contributions: Y.I., R.F., G.U.N., and N.T. designed the research project. Y.I., D.K., and N.T. performed microscopy experiments and analyzed the data. N.T. and A.B. prepared sample strains. Y.L. developed the analysis software. N.S. and R.D. conducted computational modeling. Y.I., N.S., R.F., G.U.N., and N.T. wrote the paper with inputs from other coauthors. Competing interests: The authors declare that they have no competing interests. Data and materials availability: All data needed to evaluate the conclusions in the paper are present in the paper and/or the Supplementary Materials. Additional data related to this paper may be requested from the authors.
SUPPLEMENTARY MATERIALS
Supplementary material for this article is available at http://advances.sciencemag.org/cgi/content/full/1/10/e1500947/DC1
Materials and Methods
Fig. S1. The size quantifications and three-dimensional PALM imaging of TeaR clusters.
Fig. S2. Simultaneous epifluorescence and PALM imaging.
Fig. S3. Distribution of TeaR cluster at different time scales.
Fig. S4. Modeling of TeaR movement on the plasma membrane.
Fig. S5. Modeling of the actin and MT dynamics.
Fig. S6. Systematic evaluations of modeling parameters.
Table S1. A. nidulans strains used in this study.
Table S2. Parameters used in the hyphal tip simulations.
Movie S1. Dual-color wide-field fluorescence movie of mEosFPthermo-TeaR and GFP-MT in a growing filamentous fungus (Fig. 1D).
Movie S2. PALM movie of mEosFPthermo-TeaR prepared from the moving-window binning images shown in Fig. 4, F to H.
REFERENCES AND NOTES
- 1.Wu C.-F., Lew D. J., Beyond symmetry-breaking: Competition and negative feedback in GTPase regulation. Trends Cell Biol. 23, 476–483 (2013). [DOI] [PMC free article] [PubMed] [Google Scholar]
- 2.Goehring N. W., Grill S. W., Cell polarity: Mechanochemical patterning. Trends Cell Biol. 23, 72–80 (2013). [DOI] [PubMed] [Google Scholar]
- 3.Etienne-Manneville S., Cdc42—The centre of polarity. J. Cell Sci. 117, 1291–1300 (2004). [DOI] [PubMed] [Google Scholar]
- 4.Wedlich-Soldner R., Altschuler S., Wu L., Li R., Spontaneous cell polarization through actomyosin-based delivery of the Cdc42 GTPase. Science 299, 1231–1235 (2003). [DOI] [PubMed] [Google Scholar]
- 5.Park H.-O., Bi E., Central roles of small GTPases in the development of cell polarity in yeast and beyond. Microbiol. Mol. Biol. Rev. 71, 48–96 (2007). [DOI] [PMC free article] [PubMed] [Google Scholar]
- 6.Layton A. T., Savage N. S., Howell A. S., Carroll S. Y., Drubin D. G., Lew D. J., Modeling vesicle traffic reveals unexpected consequences for Cdc42p-mediated polarity establishment. Curr. Biol. 21, 184–194 (2011). [DOI] [PMC free article] [PubMed] [Google Scholar]
- 7.Marco E., Wedlich-Soldner R., Li R., Altschuler S. J., Wu L. F., Endocytosis optimizes the dynamic localization of membrane proteins that regulate cortical polarity. Cell 129, 411–422 (2007). [DOI] [PMC free article] [PubMed] [Google Scholar]
- 8.Johnson J. M., Jin M., Lew D. J., Symmetry breaking and the establishment of cell polarity in budding yeast. Curr. Opin. Genet. Dev. 21, 740–746 (2011). [DOI] [PMC free article] [PubMed] [Google Scholar]
- 9.Savage N. S., Layton A. T., Lew D. J., Mechanistic mathematical model of polarity in yeast. Mol. Biol. Cell 23, 1998–2013 (2012). [DOI] [PMC free article] [PubMed] [Google Scholar]
- 10.Horio T., Oakley B. R., The role of microtubules in rapid hyphal tip growth of Aspergillus nidulans. Mol. Biol. Cell 16, 918–926 (2005). [DOI] [PMC free article] [PubMed] [Google Scholar]
- 11.Chang F., Peter M., Yeasts make their mark. Nat. Cell Biol. 5, 294–299 (2003). [DOI] [PubMed] [Google Scholar]
- 12.Fischer R., Zekert N., Takeshita N., Polarized growth in fungi—Interplay between the cytoskeleton, positional markers and membrane domains. Mol. Microbiol. 68, 813–826 (2008). [DOI] [PubMed] [Google Scholar]
- 13.Takeshita N., Mania D., Herrero S., Ishitsuka Y., Nienhaus G. U., Podolski M., Howard J., Fischer R., The cell-end marker TeaA and the microtubule polymerase AlpA contribute to microtubule guidance at the hyphal tip cortex of Aspergillus nidulans for polarity maintenance. J. Cell Sci. 126, 5400–5411 (2013). [DOI] [PubMed] [Google Scholar]
- 14.Takeshita N., Fischer R., On the role of microtubules, cell end markers, and septal microtubule organizing centres on site selection for polar growth in Aspergillus nidulans. Fungal Biol. 115, 506–517 (2011). [DOI] [PubMed] [Google Scholar]
- 15.Taheri-Talesh N., Horio T., Araujo-Bazán L., Dou X., Espeso E. A., Peñalva M. A., Osmani S. A., Oakley B. R., The tip growth apparatus of Aspergillus nidulans. Mol. Biol. Cell 19, 1439–1449 (2008). [DOI] [PMC free article] [PubMed] [Google Scholar]
- 16.Taheri-Talesh N., Xiong Y., Oakley B. R., The functions of myosin II and myosin V homologs in tip growth and septation in Aspergillus nidulans. PLOS One 7, e31218 (2012). [DOI] [PMC free article] [PubMed] [Google Scholar]
- 17.Berepiki A., Lichius A., Read N. D., Actin organization and dynamics in filamentous fungi. Nat. Rev. Microbiol. 9, 876–887 (2011). [DOI] [PubMed] [Google Scholar]
- 18.Egan M. J., McClintock M. A., Reck-Peterson S. L., Microtubule-based transport in filamentous fungi. Curr. Opin. Microbiol. 15, 637–645 (2012). [DOI] [PMC free article] [PubMed] [Google Scholar]
- 19.Pantazopoulou A., Pinar M., Xiang X., Penalva M. A., Maturation of late Golgi cisternae into RabERAB11 exocytic post-Golgi carriers visualized in vivo. Mol. Biol. Cell 25, 2428–2443 (2014). [DOI] [PMC free article] [PubMed] [Google Scholar]
- 20.Takeshita N., Higashitsuji Y., Konzack S., Fischer R., Apical sterol-rich membranes are essential for localizing cell end markers that determine growth directionality in the filamentous fungus Aspergillus nidulans. Mol. Biol. Cell 19, 339–351 (2008). [DOI] [PMC free article] [PubMed] [Google Scholar]
- 21.Higashitsuji Y., Herrero S., Takeshita N., Fischer R., The cell end marker protein TeaC is involved in growth directionality and septation in Aspergillus nidulans. Eukaryot. Cell 8, 957–967 (2009). [DOI] [PMC free article] [PubMed] [Google Scholar]
- 22.Takeshita N., Manck R., Grün N., de Vega S. H., Fischer R., Interdependence of the actin and the microtubule cytoskeleton during fungal growth. Curr. Opin. Microbiol. 20, 34–41 (2014). [DOI] [PubMed] [Google Scholar]
- 23.Wiedenmann J., Gayda S., Adam V., Oswald F., Nienhaus K., Bourgeois D., Nienhaus G. U., From EosFP to mIrisFP: Structure-based development of advanced photoactivatable marker proteins of the GFP-family. J. Biophotonics 4, 377–390 (2011). [DOI] [PubMed] [Google Scholar]
- 24.Wiedenmann J., Nienhaus G. U., Live-cell imaging with EosFP and other photoactivatable marker proteins of the GFP family. Expert Rev. Proteomics 3, 361–374 (2006). [DOI] [PubMed] [Google Scholar]
- 25.Nienhaus K., Nienhaus G. U., Wiedenmann J., Nar H., Structural basis for photo-induced protein cleavage and green-to-red conversion of fluorescent protein EosFP. Proc. Natl. Acad. Sci. U.S.A. 102, 9156–9159 (2005). [DOI] [PMC free article] [PubMed] [Google Scholar]
- 26.Betzig E., Patterson G. H., Sougrat R., Lindwasser O. W., Olenych S., Bonifacino J. S., Davidson M. W., Lippincott-Schwartz J., Hess H. F., Imaging intracellular fluorescent proteins at nanometer resolution. Science 313, 1642–1645 (2006). [DOI] [PubMed] [Google Scholar]
- 27.Hess S. T., Girirajan T. P. K., Mason M. D., Ultra-high resolution imaging by fluorescence photoactivation localization microscopy. Biophys. J. 91, 4258–4272 (2006). [DOI] [PMC free article] [PubMed] [Google Scholar]
- 28.Orlando K., Guo W., Membrane organization and dynamics in cell polarity. Cold Spring Harb. Perspect. Biol. 1, a001321 (2009). [DOI] [PMC free article] [PubMed] [Google Scholar]
- 29.Takamori S., Holt M., Stenius K., Lemke E. A., Grønborg M., Riedel D., Urlaub H., Schenck S., Brügger B., Ringler P., Müller S. A., Rammner B., Gräter F., Hub J. S., De Groot B. L., Mieskes G., Moriyama Y., Klingauf J., Grubmüller H., Heuser J., Wieland F., Jahn R., Molecular anatomy of a trafficking organelle. Cell 127, 831–846 (2006). [DOI] [PubMed] [Google Scholar]
- 30.Gibeaux R., Hoepfner D., Schlatter I., Antony C., Philippsen P., Organization of organelles within hyphae of Ashbya gossypii revealed by electron tomography. Eukaryot. Cell 12, 1423–1432 (2013). [DOI] [PMC free article] [PubMed] [Google Scholar]
- 31.Enke C., Zekert N., Veith D., Schaaf C., Konzack S., Fischer R., Aspergillus nidulans Dis1/XMAP215 protein AlpA localizes to spindle pole bodies and microtubule plus ends and contributes to growth directionality. Eukaryot. Cell 6, 555–562 (2007). [DOI] [PMC free article] [PubMed] [Google Scholar]
- 32.Floyd D. L., Ragains J. R., Skehel J. J., Harrison S. C., van Oijen A. M., Single-particle kinetics of influenza virus membrane fusion. Proc. Natl. Acad. Sci. U.S.A. 105, 15382–15387 (2008). [DOI] [PMC free article] [PubMed] [Google Scholar]
- 33.Slaughter B. D., Unruh J. R., Das A., Smith S. E., Rubinstein B., Li R., Non-uniform membrane diffusion enables steady-state cell polarization via vesicular trafficking. Nat. Commun. 4, 1380 (2013). [DOI] [PMC free article] [PubMed] [Google Scholar]
- 34.Araujo-Bazán L., Peñalva M. A., Espeso E. A., Preferential localization of the endocytic internalization machinery to hyphal tips underlies polarization of the actin cytoskeleton in Aspergillus nidulans. Mol. Microbiol. 67, 891–905 (2008). [DOI] [PubMed] [Google Scholar]
- 35.Peñalva M. Á., Endocytosis in filamentous fungi: Cinderella gets her reward. Curr. Opin. Microbiol. 13, 684–692 (2010). [DOI] [PubMed] [Google Scholar]
- 36.Bicho C. C., Kelly D. A., Snaith H. A., Goryachev A. B., Sawin K. E., A catalytic role for Mod5 in the formation of the Tea1 cell polarity landmark. Curr. Biol. 20, 1752–1757 (2010). [DOI] [PMC free article] [PubMed] [Google Scholar]
- 37.Riquelme M., Bredeweg E. L., Callejas-Negrete O., Roberson R. W., Ludwig S., Beltrán-Aguilar A., Seiler S., Novick P., Freitag M., The Neurospora crassa exocyst complex tethers Spitzenkörper vesicles to the apical plasma membrane during polarized growth. Mol. Biol. Cell 25, 1312–1326 (2014). [DOI] [PMC free article] [PubMed] [Google Scholar]
- 38.López-Franco R., Bartnicki-Garcia S., Bracker C. E., Pulsed growth of fungal hyphal tips. Proc. Natl. Acad. Sci. U.S.A. 91, 12228–12232 (1994). [DOI] [PMC free article] [PubMed] [Google Scholar]
- 39.Wollman R., Meyer T., Coordinated oscillations in cortical actin and Ca2+ correlate with cycles of vesicle secretion. Nat. Cell Biol. 14, 1261–1269 (2012). [DOI] [PMC free article] [PubMed] [Google Scholar]
- 40.Das M., Drake T., Wiley D. J., Buchwald P., Vavylonis D., Verde F., Oscillatory dynamics of Cdc42 GTPase in the control of polarized growth. Science 337, 239–243 (2012). [DOI] [PMC free article] [PubMed] [Google Scholar]
- 41.Monshausen G. B., Messerli M. A., Gilroy S., Imaging of the Yellow Cameleon 3.6 indicator reveals that elevations in cytosolic Ca2+ follow oscillating increases in growth in root hairs of Arabidopsis. Plant Physiol. 147, 1690–1698 (2008). [DOI] [PMC free article] [PubMed] [Google Scholar]
- 42.Holdaway-Clarke T. L., Feijo J. A., Hackett G. R., Kunkel J. G., Hepler P. K., Pollen tube growth and the intracellular cytosolic calcium gradient oscillate in phase while extracellular calcium influx is delayed. Plant Cell 9, 1999–2010 (1997). [DOI] [PMC free article] [PubMed] [Google Scholar]
- 43.Janmey P. A., Phosphoinositides and calcium as regulators of cellular actin assembly and disassembly. Annu. Rev. Physiol. 56, 169–191 (1994). [DOI] [PubMed] [Google Scholar]
- 44.Schneggenburger R., Neher E., Presynaptic calcium and control of vesicle fusion. Curr. Opin. Neurobiol. 15, 266–274 (2005). [DOI] [PubMed] [Google Scholar]
- 45.Kim H.-S., Czymmek K. J., Patel A., Modla S., Nohe A., Duncan R., Gilroy S., Kang S., Expression of the Cameleon calcium biosensor in fungi reveals distinct Ca2+ signatures associated with polarized growth, development, and pathogenesis. Fungal Genet. Biol. 49, 589–601 (2012). [DOI] [PubMed] [Google Scholar]
- 46.Schindelin J., Arganda-Carreras I., Frise E., Kaynig V., Longair M., Pietzsch T., Preibisch S., Rueden C., Saalfeld S., Schmid B., Tinevez J.-Y., White D. J., Hartenstein V., Eliceiri K., Tomancak P., Cardona A., Fiji: An open-source platform for biological-image analysis. Nat. Methods 9, 676–682 (2012). [DOI] [PMC free article] [PubMed] [Google Scholar]
- 47.Li Y., Ishitsuka Y., Hedde P. N., Nienhaus G. U., Fast and efficient molecule detection in localization-based super-resolution microscopy by parallel adaptive histogram equalization. ACS Nano 7, 5207–5214 (2013). [DOI] [PubMed] [Google Scholar]
- 48.Konzack S., Rischitor P. E., Enke C., Fischer R., The role of the kinesin motor KipA in microtubule organization and polarized growth of Aspergillus nidulans. Mol. Biol. Cell 16, 497–506 (2005). [DOI] [PMC free article] [PubMed] [Google Scholar]
- 49.Pöhlmann J., Risse C., Seidel C., Pohlmann T., Jakopec V., Walla E., Ramrath P., Takeshita N., Baumann S., Feldbrügge M., Fischer R., Fleig U., The Vip1 inositol polyphosphate kinase family regulates polarized growth and modulates the microtubule cytoskeleton in fungi. PLOS Genet. 10, e1004586 (2014). [DOI] [PMC free article] [PubMed] [Google Scholar]
- 50.Martin I., Dozin B., Quarto R., Cancedda R., Beltrame F., Computer-based technique for cell aggregation analysis and cell aggregation in in vitro chondrogenesis. Cytometry 28, 141–146 (1997). [DOI] [PubMed] [Google Scholar]
- 51.Nayak T., Szewczyk E., Oakley C. E., Osmani A., Ukil L., Murray S. L., Hynes M. J., Osmani S. A., Oakley B. R., A versatile and efficient gene-targeting system for Aspergillus nidulans. Genetics 172, 1557–1566 (2006). [DOI] [PMC free article] [PubMed] [Google Scholar]
Associated Data
This section collects any data citations, data availability statements, or supplementary materials included in this article.
Supplementary Materials
Supplementary material for this article is available at http://advances.sciencemag.org/cgi/content/full/1/10/e1500947/DC1
Materials and Methods
Fig. S1. The size quantifications and three-dimensional PALM imaging of TeaR clusters.
Fig. S2. Simultaneous epifluorescence and PALM imaging.
Fig. S3. Distribution of TeaR cluster at different time scales.
Fig. S4. Modeling of TeaR movement on the plasma membrane.
Fig. S5. Modeling of the actin and MT dynamics.
Fig. S6. Systematic evaluations of modeling parameters.
Table S1. A. nidulans strains used in this study.
Table S2. Parameters used in the hyphal tip simulations.
Movie S1. Dual-color wide-field fluorescence movie of mEosFPthermo-TeaR and GFP-MT in a growing filamentous fungus (Fig. 1D).
Movie S2. PALM movie of mEosFPthermo-TeaR prepared from the moving-window binning images shown in Fig. 4, F to H.