Abstract
Background/Aim
The definition of muscle atrophy (pre-sarcopenia) and its diagnostic criteria have not been well reported. To elucidate the frequency of pre-sarcopenia in chronic liver disease (CLD), we examined clinical features of Japanese CLD patients using abdominal computed tomography (CT) findings.
Methods
We enrolled 988 CLD (736 with naïve hepatocellular carcinoma) and 372 normal control subjects (NCs). The psoas muscle area index [PI, psoas muscle area at the mid-L3 level in CT (cm2)/height (m)2] was calculated using personal computer software. The cut-off level for pre-sarcopenia was defined as less than two standard deviations (SDs) below the mean PI value in the NCs under 55 years old [males, 45.6 ± 5.7 years (n = 61), 4.24 cm2/m2; females, 47.0 ± 6.1 years (n = 49), 2.50 cm2/m2]. Elderly was defined as 65 years or older. Clinical features were retrospectively evaluated.
Results
In the CLD group (HCV:HBV:HBV and HCV:alcohol:non-HBV and HCV = 652:88:7:82:159), pre-sarcopenia was observed in 15.3 % of patients with chronic hepatitis (CH), 24.4 % of those with liver cirrhosis (LC) Child-Pugh A, 37.7 % of those with LC Child-Pugh B, and 37.1 % of those with LC Child-Pugh C. A comparison between NC and CH by age (<55, 55–64, 65–74, ≥75 years) showed that the frequency of pre-sarcopenia was higher in CH regardless of age (1.8 vs. 3.6 %, 3.2 vs. 15.9 %, 4.9 vs. 13.4 %, 14.3 vs. 20.2 %, respectively). PI values showed correlations with BMI (r = 0.361), age (r = −0.167), albumin (r = 0.115), and branched-chain amino acids (r = 0.199) (P < 0.01).
Conclusion
Retrospective evaluate for pre-sarcopenia was easy to perform with CT findings. Nutrition and exercise instruction should be considered for early stage and even non-elderly CLD as well as LC.
Keywords: Chronic liver disease, Liver cirrhosis, Chronic hepatitis, Muscle atrophy, Sarcopenia
Introduction
Sarcopenia, initially introduced by Rosenberg [1], has been proposed to be an age-related muscle atrophy (pre-sarcopenia) that appears in combination with low muscle strength and/or physical performance condition in the criteria of the European Working Group on Sarcopenia in Older People (EWGSOP) [2]. In general, sarcopenia including muscle atrophy is frequently observed with aging, while it has also been shown to be associated with chronic diseases [e.g., heart failure, obstructive pulmonary disease, diabetes mellitus, kidney disease, connective tissue disease, tuberculosis infection, other wasting conditions] [3]. Pre-sarcopenia is the first step of the condition and a mandatory item for diagnosis of “sarcopenia” [2]. Although it is thought to have clinical importance for the clinical course of chronic liver disease (CLD) patients [4, 5] and in therapy results for hepatocellular carcinoma (HCC) in liver cirrhosis (LC) [6–8], the clinical features of pre-sarcopenia in CLD patients [chronic hepatitis (CH), LC] have not been well elucidated. Moreover, a preferred imaging modality for diagnosing pre-sarcopenia and concrete cut-off levels have not been established. Computed tomography (CT) examinations are commonly performed as part of health checkup programs as well as in Japanese patients with CLD for screening of HCC. However, diagnostic criteria based on CT findings have not been established for pre-sarcopenia. In the present study, we determined the psoas muscle area to establish concrete cut-off levels for muscle atrophy in males and females using CT, and also elucidate clinical features of pre-sarcopenia in CLD patients.
Methods
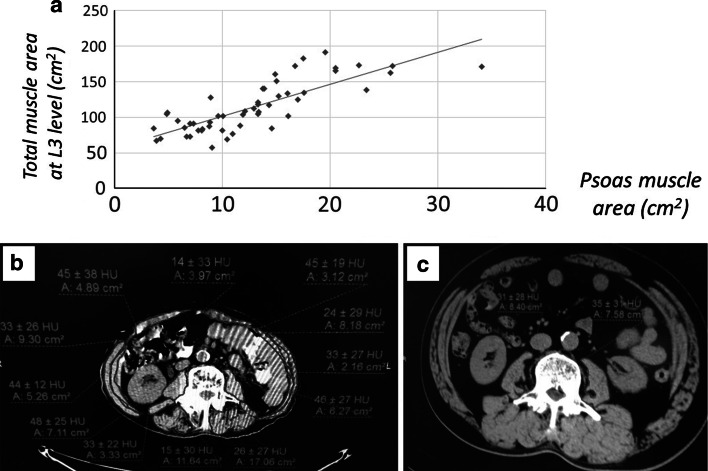
We enrolled 988 patients with CLD who were treated at Ehime Prefectural Central Hospital from January 2005 to December 2014, as well as 372 normal controls subjects (NCs) who underwent a PET/CT examination as part of a medical check-up procedure in 2013 at the same hospital. Of the 988 CLD patients [age range 22–93 years, mean 68.4 ± 4.5 years; male:female = 684:304; hepatitis C virus (HCV):hepatitis B virus (HBV):HBV and HCV:alcohol:non-HBV and HCV (negative for both hepatitis B surface antigen and anti-HCV) = 652:88:7:82:159], 736 had a naïve HCC. The psoas muscle area index (PI) [psoas muscle area at the middle of the third lumbar vertebra (L3) (cm2)/height (m)2] was manually calculated from CT findings using personal computer software (Centricity Web DX ver.3.7.3.6417: GE Healthcare) (Fig. 1). Elderly was defined as 65 years old or older.
Fig. 1.
Correlation between total muscle area and psoas muscle area at the level of the middle of the third lumbar vertebra level calculated from computed tomography findings. a There was a correlation between total muscle area and psoas muscle area at the middle level of the third lumbar vertebra (L3) level (r = 0.802, P < 0.001). b Total muscle area was manually calculated at the middle level of L3 (cm2) using personal computer software. c Psoas muscle area was manually calculated at the middle level of L3 (cm2) using personal computer software
After confirmation that psoas muscle area has a close relationship with total muscle area at the L3 level (r = 0.802, P < 0.001), it was calculated for all patients and the NC. The cut-off PI value for pre-sarcopenia was defined as less than two standard deviations (SDs) below the mean PI for males and females in the NC group who were under 54 years old. PI values for all NC subjects (male:female = 205:167) were also calculated for evaluation by generation (≤54, 55–64, 65–74, ≥75 years). Chronic hepatitis (CH) and liver cirrhosis (LC) were diagnosed based on histological examination findings, the FIB-4 index [9, 10], or existence of gastroesophageal varices. Clinical features were retrospectively evaluated.
Branched-chain amino acid (BCAA) was measured using the commercially available DIACOLOUR-BTR® kit (TOYOBO CO., LTD. Osaka, Japan).
Statistical analysis
Data are expressed as the mean ± SD. Statistical analyses were performed using an χ square test and Fischer’s exact test, as appropriate. All statistical analyses were performed with SPSS 21 J (SPSS Japan Inc., Tokyo, Japan). A P value <0.05 was considered to represent statistical significance.
Results
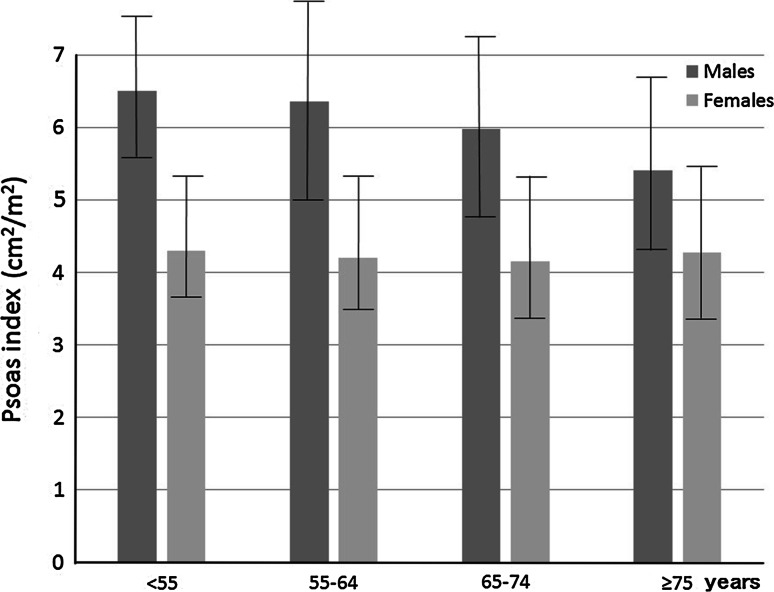
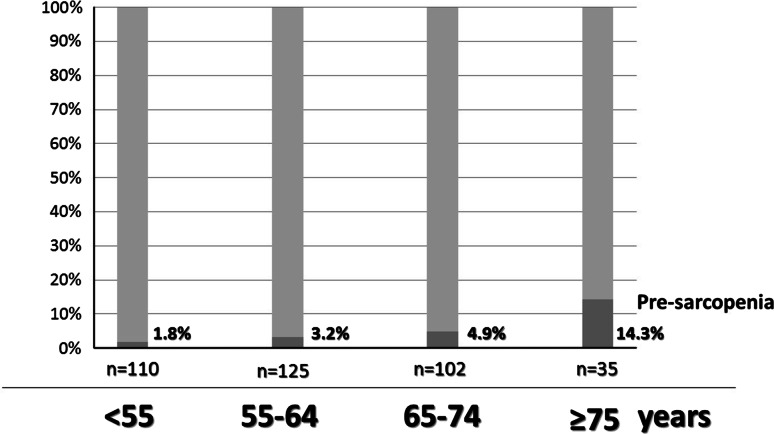
First, we measured the total muscle area at the L3 level by CT in 52 serial patients selected at random to confirm the relationship between total muscle area and psoas muscle area (male:female = 25:27, CLD:NC = 19:33) (Fig. 1). The average PI values for males in the NC group aged <55, 55–64, 65–74, and ≥75 years were 6.50 ± 1.13, 6.35 ± 1.45, 5.98 ± 1.24, and 5.40 ± 1.23 cm2/m2, respectively, while those for females were 4.30 ± 0.90, 4.20 ± 0.94, 4.15 ± 1.02, and 4.27 ± 1.12 cm2/m2, respectively (Table 1) (Fig. 2). In males, the average PI decreased with age. The cut-off values for pre-sarcopenia were 4.24 cm2/m2 in males and 2.50 cm2/m2 in females, which were determined based on the mean PI of younger NC group males (<55 years, average age: 45.6 ± 5.7 years, n = 61, 6.50 ± 1.13 cm2/m2) and females (<55 years, average age: 47.0 ± 6.1 years, n = 49, 4.30 ± 0.90 cm2/m2). The frequency of pre-sarcopenia in the NC group (n = 372, 29–89 years, average age 60.2 ± 11.3 years) for all ages was 4.3 % (n = 16/372), and that for those <65 and ≥65 years old was 2.6 % (n = 6/235) and 7.3 % (n = 10/137), respectively (P = 0.030). The percentage of pre-sarcopenia increased with aging (≤54:55–64:65–74:≥75 years = 1.8 %:3.2 %:4.9 %:14.3 %) (Fig. 3).
Table 1.
Characteristics of normal controls
| Males (n = 205) | ≤54 years old (n = 61) | 55–64 years old (n = 63) | 65–74 years old (n = 60) | ≥75 years old (n = 21) |
|---|---|---|---|---|
| Age (average) | 45.6 ± 5.7 | 60.2 ± 2.8 | 68.8 ± 2.7 | 79.0 ± 4.0 |
| Height (cm) | 171.9 ± 5.5 | 167.8 ± 6.2 | 165.1 ± 6.1 | 162.7 ± 5.8 |
| Body weight (kg) | 74.9 ± 11.0 | 69.7 ± 11.1 | 65.3 ± 8.0 | 61.2 ± 8.8 |
| Body mass index (kg/m2) | 25.3 ± 3.1 | 24.7 ± 3.2 | 23.9 ± 2.4 | 23.1 ± 2.8 |
| Psoas index (cm2/m2) | 6.50 ± 1.13 | 6.35 ± 1.45 | 5.98 ± 1.24 | 5.40 ± 1.23 |
| Females (n = 167) | ≤54 years old (n = 49) | 55–64 years old (n = 62) | 65–74 years old (n = 42) | ≥75 years old (n = 14) |
|---|---|---|---|---|
| Age (average) | 47.0 ± 6.1 | 60.3 ± 2.8 | 68.5 ± 2.9 | 78.5 ± 3.7 |
| Height (cm) | 157.6 ± 5.1 | 155.8 ± 4.8 | 151.8 ± 4.9 | 147.6 ± 5.4 |
| Body weight (kg) | 53.9 ± 7.5 | 55.4 ± 9.3 | 52.5 ± 7.9 | 47.2 ± 8.1 |
| Body mass index (kg/m2) | 21.7 ± 3.0 | 22.8 ± 3.6 | 22.7 ± 3.1 | 21.6 ± 3.3 |
| Psoas index (cm2/m2) | 4.30 ± 0.90 | 4.20 ± 0.94 | 4.15 ± 1.02 | 4.27 ± 1.12 |
Fig. 2.
Psoas index by age in normal control group. The average psoas index values for males in the normal control group aged <55, 55–64, 65–74, and ≥75 years were 6.50 ± 1.13, 6.35 ± 1.45, 5.98 ± 1.24, and 5.40 ± 1.23 cm2/m2, respectively, while those for females were 4.30 ± 0.90, 4.20 ± 0.94, 4.15 ± 1.02, and 4.27 ± 1.12 cm2/m2, respectively
Fig. 3.
Frequency of pre-sarcopenia in normal control subjects by age. The frequency of pre-sarcopenia increased with age (≤54:55–64:65–74:≥75 years = 1.8 %:3.2 %:4.9 %:14.3 %)
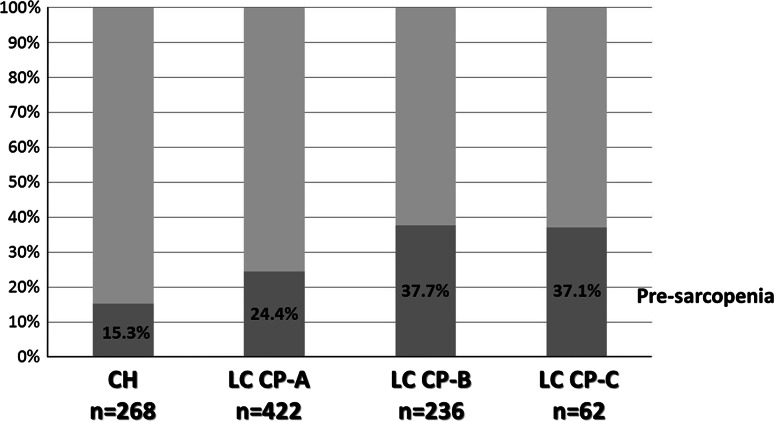
In the CLD group (HCV:HBV:HBV and HCV:alcohol:non-HBV and HCV = 652:88:7:82:159), pre-sarcopenia was present in 15.3 % (41/268) of CH, 24.4 % (103/422) of LC Child-Pugh A, 37.7 % (89/236) of LC Child-Pugh B, and 37.1 % (23/62) of LC Child-Pugh C cases (Fig. 4). Furthermore, the difference of the mean PI value of LC patients with Child-Pugh B was significantly different as compared to those of CH (P = 0.007) and LC patients with Child-Pugh A (P = 0.004) (Table 2).
Fig. 4.
Frequency of pre-sarcopenia in chronic liver disease. In patients with chronic liver disease (HCV:HBV:HBV and HCV:alcohol:negative for both HBV and HCV = 652:88:7:82:159), pre-sarcopenia was found in 15.3 % (41/268) of those with chronic hepatitis, in 24.4 % (103/422) of those with liver cirrhosis Child-Pugh A, in 37.7 % (89/236) of those with liver cirrhosis Child-Pugh B, and in 37.1 % (23/62) of those with liver cirrhosis Child-Pugh C. HCV hepatitis C virus, HBV hepatitis B virus
Table 2.
Characteristics of patients with chronic liver disease
| Total (n = 988) | Chronic hepatitis (n = 268) | LC with Child-Pugh A (n = 422) | LC with Child-Pugh B (n = 236) | LC with Child-Pugh C (n = 62) | |
|---|---|---|---|---|---|
| Average age (years old) | 68.4 ± 4.5 | 68.1 ± 10.9 | 69.1 ± 9.5 | 68.6 ± 9.7 | 64.7 ± 11.3 |
| Male:female | 684:304 | 201:67 | 267:155 | 173:63 | 43:19 |
| Etiology (HCV:HBV:HBV and HCV:Alc:NBNC) | 652:88:7:82:159 | 137:34:0:31:66 | 310:33:6:22:51 | 167:16:0:24:29 | 38:5:1:5:13 |
| Body mass index (kg/m2) | 23.3 ± 3.7 | 23.5 ± 3.5 | 23.2 ± 3.7 | 23.0 ± 3.8 | 24.2 ± 4.5 |
| Difference from mean PI | – | −0.854 ± 1.40 | −1.16 ± 1.35 | −1.47 ± 1.55 | −1.55 ± 1.41 |
| Pre-sarcopenia (n) | 256 (25.9 %) | 41 (15.3 %) | 103 (24.4 %) | 89 (37.7 %) | 23 (37.1 %) |
| Aspartate aminotransferase (IU/L) | 65.1 ± 100.0 | 54.4 ± 51.0 | 58.2 ± 55.5 | 62.3 ± 57.9 | 168.1 ± 323.5 |
| Alanine aminotransferase (IU/L) | 48.9 ± 49.4 | 48.0 ± 53.4 | 49.0 ± 43.7 | 44.2 ± 34.3 | 70.4 ± 93.6 |
| Platelets (×104 cells/μL) | 13.1 ± 8.1 | 16.7 ± 5.8 | 12.3 ± 7.7 | 11.7 ± 9.8 | 9.2 ± 7.1 |
| Total-bilirubin (mg/dL) | 1.21 ± 2.06 | 0.73 ± 0.33 | 0.81 ± 0.40 | 1.31 ± 1.68 | 5.76 ± 5.83 |
| Albumin (g/dL) | 3.69 ± 0.64 | 4.15 ± 0.45 | 3.83 ± 0.45 | 3.21 ± 0.54 | 2.60 ± 0.50 |
| Prothrombin time (%) | 80.9 ± 17.9 | 87.3 ± 12.8 | 86.2 ± 13.4 | 71.3 ± 15.4 | 48.6 ± 17.4 |
| BCAA (μmol/L) | 428.3 ± 119.6 | 450.9 ± 103.5 | 438.0 ± 125.7 | 387.6 ± 117.4 | 362.5 ± 93.8 |
| Positive for HCC (n) | 736 (74.5 %) | 206 (76.9 %) | 319 (75.6 %) | 179 (75.8 %) | 32 (51.6 %) |
| TNM stage in UICC 7th | 394:214:91:37 | 111:59:28:8 | 187:88:28:16 | 87:55:28:9 | 9:12:7:4 |
| TNM stage in LCSGJ 5th | 180:299:166:91 | 41:90:52:23 | 99:128:59:33 | 35:73:46:25 | 5:8:9:10 |
For gender, CH vs. Child-Pugh A: P = 0.001, and Child-Pugh A vs. Child-Pugh B: P = 0.009. For differences from mean PI, CH vs. Child-Pugh B: P = 0.007, and Child-Pugh A vs. Child- Pugh B: P = 0.004. For aspartate aminotransferase, Child-Pugh C vs. others: P < 0.001. For alanine aminotransferase, Child-Pugh C vs. others: P < 0.001, and CH vs. Child-Pugh B: 0.037. For platelet count, CH vs. Child-Pugh A: P = 0.018, and CH vs. Child-Pugh B, P = 0.002. For total bilirubin, CH vs. Child-Pugh A: 0.025, CH vs. Child-Pugh B: P < 0.001, CH vs. Child-Pugh C: P < 0.001, Child-Pugh A vs. Child-Pugh B: P < 0.001, and Child-Pugh B vs. Child-Pugh C: P < 0.001. For albumin, CH vs. Child-Pugh A: P = 0.003, CH vs. Child-Pugh B: P < 0.001, and CH vs. Child-Pugh C: P = 0.001. For prothrombin time, CH vs. Child-Pugh B: P = 0.006, CH vs. Child-Pugh C: P = 0.006, and Child-Pugh A vs. Child-Pugh C: P = 0.013. For frequency of HCC, CH vs. Child-Pugh C: P < 0.001, Child-Pugh A vs. Child-Pugh C: P < 0.001, and Child-Pugh B vs. Child-Pugh C: P < 0.001
LC liver cirrhosis, HCV hepatitis C virus, HBV hepatitis B virus, Alc alcoholic liver injury, NBNC negative for both HBV and HCV, BCAA branched-chain amino acid, HCC hepatocellular carcinoma, UICC 7th Union for International Cancer Control 7th, LCSGJ 5th Liver Cancer Study Group of Japan
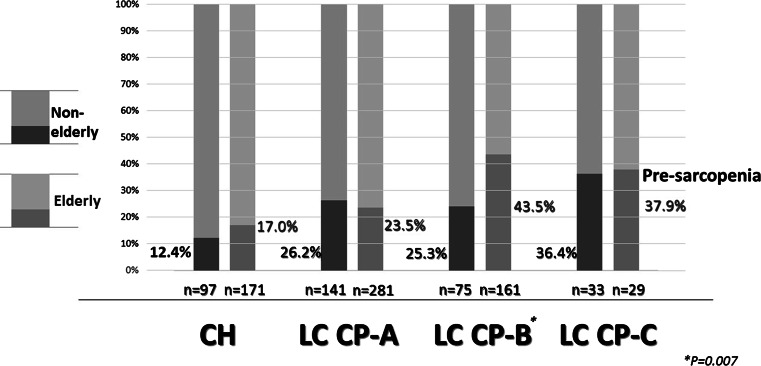
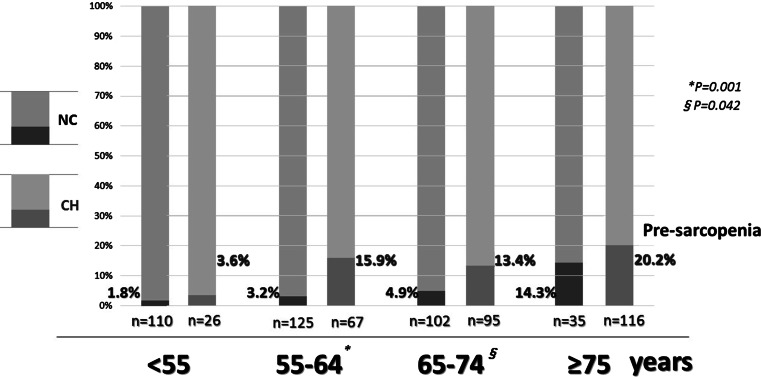
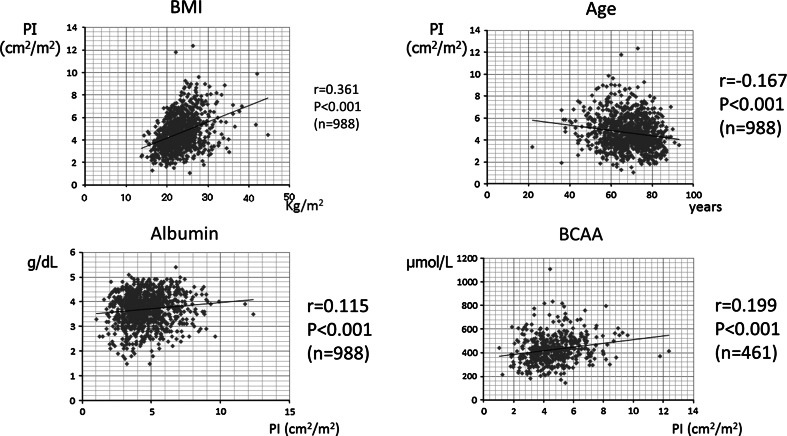
A comparison between non-elderly and elderly CH patients showed pre-sarcopenia in 12.4 % (12/97) and 17.0 % (29/171), respectively (P = 0.316), while those for LC Child-Pugh A patients were 26.2 % (37/141) and 23.5 % (66/281), respectively (P = 0.534), for LC Child-Pugh B patients were 25.3 % (19/75) and 43.5 % (70/161), respectively (P = 0.007), and for LC Child-Pugh C patients were 36.4 % (12/33) and 37.9 % (11/29), respectively (P = 0.899) (Fig. 5). In comparison with viral and non-viral CLD for each grade of CLD, there were no significant differences in regards to the differences from the mean PI value and the frequency of pre-sarcopenia (Table 3). Furthermore, a comparison of PI values in the NC group and CH patients (HCV:HBV:HBV&HCV:alcohol:nonBnonC = 137:34:0:31:66) by age showed that the frequency of pre-sarcopenia was greater in CH than NC for all generations (CH vs. NC; <55, 55–64, 65–74, ≥75 years = 3.6 vs. 1.8 %, 15.9 vs. 3.2 %, 13.4 vs. 4.9 %, and 20.2 vs. 14.3 %, respectively) (Fig. 6). Finally, PI showed correlations with body mass index (BMI) (r = 0.361, P < 0.001), age (r = −0.167, P < 0.001), albumin level (r = 0.115, P < 0.001), and BCAA level (n = 461, r = 0.199, P < 0.001) (Fig. 7).
Fig. 5.
Comparison between non-elderly and elderly regarding the frequency of each class of chronic liver disease. Comparisons between non-elderly and elderly patients showed that the percentages of pre-sarcopenia in those with chronic hepatitis were 12.4 and 17.0 % (P = 0.316), in those with liver cirrhosis Child-Pugh A, they were 26.2 and 23.5 % (P = 0.534), in those with liver cirrhosis Child-Pugh B, they were 25.3 and 43.5 % (P = 0.007), and in those with liver cirrhosis Child-Pugh C, they were 37.9 and 36.4 % (P = 0.899), respectively
Table 3.
Differences from the mean psoas index (PI): comparison between viral chronic liver disease and others
| Viral CLD | Non-viral CLD | P value | |
|---|---|---|---|
| CH | |||
| Difference from mean PI | −0.715 ± 1.311 | −1.099 ± 1.509 | 0.174 |
| Pre-sarcopenia (n) | 21/171 (12.3 %) | 20/97 (20.6 %) | 0.069 |
| LC Child-Pugh A | |||
| Difference from mean PI | −1.165 ± 1.299 | −1.135 ± 1.579 | 0.246 |
| Pre-sarcopenia (n) | 86/349 (24.6 %) | 17/73 (23.3 %) | 0.807 |
| LC Child-Pugh B | |||
| Difference from mean PI | −1.496 ± 1.540 | −1.403 ± 1.601 | 0.641 |
| Pre-sarcopenia (n) | 68/185 (36.8 %) | 21/53 (39.6 %) | 0.745 |
| LC Child-Pugh C | |||
| Difference from mean PI | −1.560 ± 1.358 | −1.532 ± 1.571 | 0.716 |
| Pre-sarcopenia (n) | 17/44 (38.6 %) | 6/18 (33.3 %) | 0.697 |
CLD chronic liver disease, CH chronic hepatitis, LC liver cirrhosis
Fig. 6.
Comparison between normal control subjects and patients with chronic hepatitis divided by age for frequency of pre-sarcopenia. A comparison of psoas muscle area index values by age showed that the frequency of pre-sarcopenia was greater in the chronic hepatitis group as compared with the normal control group [<55, 55–64, 65–74, ≥75 years = 3.6 vs. 1.8 % (P = 0.570), 15.9 vs. 3.2 % (P = 0.001), 13.4 vs. 4.9 % (P = 0.042), and 20.2 vs. 14.3 % (P = 0.443), respectively]
Fig. 7.
Correlations between the psoas index (PI) and body mass index (BMI), age, albumin, and branched-chain amino acids (BCAA). There were correlations found between the PI and BMI (n = 988, r = 0.361, P < 0.001), age (n = 988, r = −0.167, P < 0.001), albumin (n = 988, r = 0.115, P < 0.001), and BCAA (n = 461, r = 0.199, P < 0.001)
Discussion
Primary sarcopenia is defined as muscle atrophy without other chronic diseases in aged individuals, while chronic diseases are thought to occur in relation to secondary sarcopenia. Even though Rosenberg proposed the idea of sarcopenia several years ago, no common definition has been established. Recently, various working groups for sarcopenia throughout the world have proposed that a definition should be formed using a combined approach based on muscle mass and muscle quality. The common concept of primary and secondary sarcopenia is based on muscle atrophy. Psoas muscle atrophy shown by CT was reported to have predictive value for mortality in cirrhotic patients, independent of Model for End-Stage Liver Disease (MELD) and MELD-Na scores [4]. However, appropriate diagnostic cut-off values for available methods have not been established, because of differences in race and/or modalities. EWGSOP [2] and the Asian Working Group for Sarcopenia (AWGS) [3] published consensus findings regarding sarcopenia in their areas. Pre-sarcopenia is defined as a mandatory item for diagnosis of sarcopenia by the EWGSOP. However, cut-off values for muscle atrophy in each of those studies as well as the methods employed differ. Baumgartner used dual-energy X-ray absorptiometry (DXA) and defined sarcopenia as appendicular skeletal muscle mass (kg)/height (m)2 less than two SDs below the mean of a young reference group [11], while Sanada used values two SDs below the sex-specific mean of reference values obtained from young adults aged 18–40 years by DXA as a definition [12]. There is no radiological exposure measurement for use with bioelectrical impedance analysis (BIA). Tanimoto reported a BIA cut-off for muscle atrophy [13], and a correlation between BIA and MRI findings has been reported [14]. However, it is difficult to perform DXA or BIA, because most institutions do not have the appropriate equipment. Although, grip strength and respiratory function tests are less expensive alternatives for evaluation of muscular weakness, those findings cannot be retrospectively analyzed and establishment of cut-off values for each test is necessary. On the other hand, CT is sometimes performed in health checkup situations and commonly used in Japan for examining patients with CLD as screening for HCC, and while its merits include usability of the findings for retrospective analysis without a special program or equipment.
No cut-off value for the psoas area shown in CT findings has been established for defining pre-sarcopenia in normal Japanese individuals. CT is often used to screen for HCC, and obtained data can be both retrospectively and objectively evaluated; thus, we used CT findings in the present study to determine the psoas area at the mid-L3 level as the point of measurement. The PI cut-off value was defined as the mean of the younger generation minus two SDs, based on methods reported by Baumgartner [11] and Sanada [12]. Previously, Yoshizumi [15] showed that body surface area, height, body weight, and psoas muscle area correlated with total muscle area at the L3 level. In another study, Durand [4] used transversal psoas muscle thickness at the umbilicus level shown by CT for assessment of muscle waste. In the present subjects, psoas muscle area at the L3 level had a good correlation with total muscle area at the same level in CT findings. Nevertheless, since physiques differ among individuals, it was thought necessary to revise the psoas muscle area with height, the same as with BMI. Therefore, we calculated PI based on psoas muscle area and it was considered to be a suitable indicator of pre-sarcopenia.
An increase in frequency of sarcopenia with progression of chronic disease can be easily seen by imaging. Hayashi [16] reported that 44.4 % of men and 38.2 % of women with LC also had sarcopenia, while 40 % of LC patients showed sarcopenia in another study [5]. We observed pre-sarcopenia in a range of 24.4–37.7 % of our patients with various grades of LC. Furthermore, the difference from the mean PI value of LC patients with Child-Pugh B was significantly different as compared to those with CH (P = 0.007) and LC patients with Child-Pugh A (P = 0.004). Among the various conditions presented in our patients, pre-sarcopenia was more frequent in LC, though it was even observed in some CH cases. In addition, 12.4 % of the CH patients less than 65 years old showed muscle atrophy, which is also an issue in patients with advanced liver disease and elderly patients with CLD. Thus, prevention of muscle atrophy progression should be a point of focus, even in young patients with CH.
Fujita [17] reported that BCAA level may be related to prevention and treatment of sarcopenia. In another study, Kim [18] found that administration of leucine-rich essential amino acid protein (3 g, twice daily) and a 60-min comprehensive training program performed twice a week was effective for enhancing not only muscle strength, but also muscle mass and walking speed in women with sarcopenia. Kekkonen also reported that a low intensity, home based exercise program combined with post-exercise milk protein supplementation with a high leucine content was effective for improving muscle mass and functions in older individuals with inflammatory disease [19]. Thus, exercise as well as ingestion of protein with leucine are thought to be effective in preventing muscle atrophy and improving strength. Even in CH, it was reported that 4.3–18.9 % of affected patients showed a level of BCAA lower than the bottom of the normal range [20]. Based on the present findings that pre-sarcopenia existed in 15.3 % of the CH patients and the correlation of PI with BCAA, establishment of an effective nutrition and exercise program for preventing muscle atrophy related to CLD is needed.
Using CT data obtained during screening for HCC, we found it easy to retrospectively evaluate the presence of pre-sarcopenia in Japanese CLD patients; pre-sarcopenia is not a rare complication and it is important to keep in mind that muscle atrophy is common even in younger patients.
Conflict of interest
The authors declare that they have no conflict of interest.
References
- 1.Rosenberg I. Summary comments and methodological problems in determining nutritional status of older persons. Am J Clin Nutr. 1989;50:1231–1233. [PubMed] [Google Scholar]
- 2.Cruz-Jentoft AJ, Baeyens JP, Bauer JM, et al. Sarcopenia: European consensus on definition and diagnosis: report of the European Working Group on Sarcopenia in older people. Age Ageing. 2010;39:412–423. doi: 10.1093/ageing/afq034. [DOI] [PMC free article] [PubMed] [Google Scholar]
- 3.Sarcopenia in Asia consensus report of the Asian working group for sarcopenia. JAMDA. 2014;15:95–101. doi: 10.1016/j.jamda.2013.11.025. [DOI] [PubMed] [Google Scholar]
- 4.Durand F, Buyse S, Francoz C, et al. Prognostic value of muscle atrophy in cirrhosis using psoas muscle thickness on computed tomography. J Hepatol. 2014;60:1151–1157. doi: 10.1016/j.jhep.2014.02.026. [DOI] [PubMed] [Google Scholar]
- 5.Montano-Loza AJ, Meza-Junco J, Prado CM, et al. Muscle wasting is associated with mortality in patients with cirrhosis. Clin Gastroenterol Hepatol. 2012;10:166–173. doi: 10.1016/j.cgh.2011.08.028. [DOI] [PubMed] [Google Scholar]
- 6.Harimoto N, Shirabe K, Yamashita Y, et al. Sarcopenia as a predictor of prognosis in patients following hepatectomy for hepatocellular carcinoma. Br J Surg. 2013;100:1523–1530. doi: 10.1002/bjs.9258. [DOI] [PubMed] [Google Scholar]
- 7.Krell RW, Kaul DR, Martin AR, et al. Association between sarcopenia and the risk of serious infection among adults undergoing liver transplantation. Liver Transpl. 2013;19:1396–1402. doi: 10.1002/lt.23752. [DOI] [PMC free article] [PubMed] [Google Scholar]
- 8.Masuda T, Shirabe K, Ikegami T, et al. Sarcopenia is a prognostic factor in living donor liver transplantation. Liver Transpl. 2014;20:401–407. doi: 10.1002/lt.23811. [DOI] [PubMed] [Google Scholar]
- 9.Vallet-Pichard A, Mallet V, Nalps B, et al. FIB-4: an inexpensive and accurate marker of fibrosis in HCV infection. Comparison with liver biopsy and fibrotest. Hepatology. 2007;46:32–36. doi: 10.1002/hep.21669. [DOI] [PubMed] [Google Scholar]
- 10.Shah AG, Lydecker A, Murray K, et al. Comparison of noninvasive markers of fibrosis in patients with nonalcoholic fatty liver disease. Clin Gastroenterol Hepatol. 2009;7:1104–1112. doi: 10.1016/j.cgh.2009.05.033. [DOI] [PMC free article] [PubMed] [Google Scholar]
- 11.Baumgartner RN, Koehler KM, Gallagher D, et al. Epidemiology of sarcopenia among the elderly in New Mexico. Am J Epidemol. 1998;147:755–763. doi: 10.1093/oxfordjournals.aje.a009520. [DOI] [PubMed] [Google Scholar]
- 12.Sanada K, Miyauchi M, Tanimoto M, et al. A cross-sectional study of sarcopenia in Japanese men and women: reference values and association with cardiovascular risk factors. Eur J Appl Physiol. 2010;110:57–65. doi: 10.1007/s00421-010-1473-z. [DOI] [PubMed] [Google Scholar]
- 13.Tanimoto Y, Watanabe M, Sun W, et al. Association between muscle mass and disability in performing instrumental activities of daily living (IADL) in community-dwelling elderly in Japan. Arch Gerontol Geriatr. 2012;54:e230–e233. doi: 10.1016/j.archger.2011.06.015. [DOI] [PubMed] [Google Scholar]
- 14.Janssen I, Heymsfield SB, Baumgartner RN, et al. Estimation of skeletal muscle area by bioelectrical impedance analysis. J Appl Physiol. 2000;89:465–471. doi: 10.1152/jappl.2000.89.2.465. [DOI] [PubMed] [Google Scholar]
- 15.Yoshizumi T, Shirabe K, Nakagawara H, et al. Skeletal muscle area correlates with body surface area in healthy adults. Hepatol Res. 2014;44:313–318. doi: 10.1111/hepr.12119. [DOI] [PubMed] [Google Scholar]
- 16.Hayashi F, Matsumoto Y, Momoki C, et al. Physical inactivity and insufficient dietary intake are associated with the frequency of sarcopenia in patients with compensated viral liver cirrhosis. Hepatol Res. 2013;43:1264–1275. doi: 10.1111/hepr.12085. [DOI] [PubMed] [Google Scholar]
- 17.Fujita S, Volpi E. Amino acids and muscle loss with aging J Nutr. 2006;136:277S–280S. doi: 10.1093/jn/136.1.277S. [DOI] [PMC free article] [PubMed] [Google Scholar]
- 18.Kim HK, Suzuki T, Saito K, et al. Effects of exercise and amino acid supplementation on body composition and physical function in community-dwelling elderly Japanese sarcopenic women: a randomized controlled trial. J Am Geriatr Soc. 2012;60:16–23. doi: 10.1111/j.1532-5415.2011.03776.x. [DOI] [PubMed] [Google Scholar]
- 19.Björkman MP, Pilvi TK, Kekkonen RA, Korpela R, Tilvis RS. Similar effects of leucine rich and regular dairy products on muscle mass and functions of older polymyalgia rheumatica patients: a randomized crossover trial. J Nutr Health Aging. 2011;15:462–467. doi: 10.1007/s12603-010-0276-6. [DOI] [PubMed] [Google Scholar]
- 20.Michitaka K, Hiraoka A, Kume M, et al. Amino acid imbalance in patients with chronic liver diseases. Hepatol Res. 2010;40:393–398. doi: 10.1111/j.1872-034X.2009.00614.x. [DOI] [PubMed] [Google Scholar]


