
Figure 9. a. Representative tumor masses removed from mice treated with corn oil (control) or 2 mg of Curcumin.
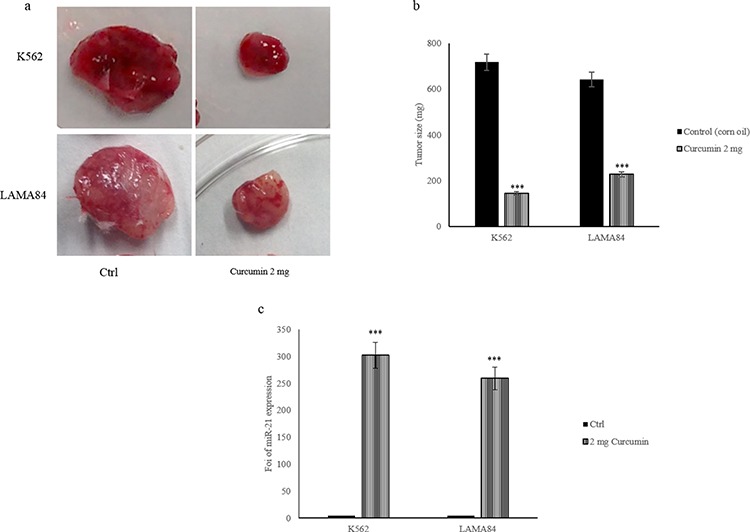
b. Tumor masses size average of mice treated with corn oil (Ctrl) and mice treated with 2 mg of Curcumin. c. MiR-21 levels in exosomes collected from serum of control mice and mice treated with 2 mg of Curcumin were determined by quantitative Real time PCR analysis. Values are the mean ± SD of 3 independent experiments *p ≤ 0.05, **p ≤ 0.01 and **p ≤ 0.005.