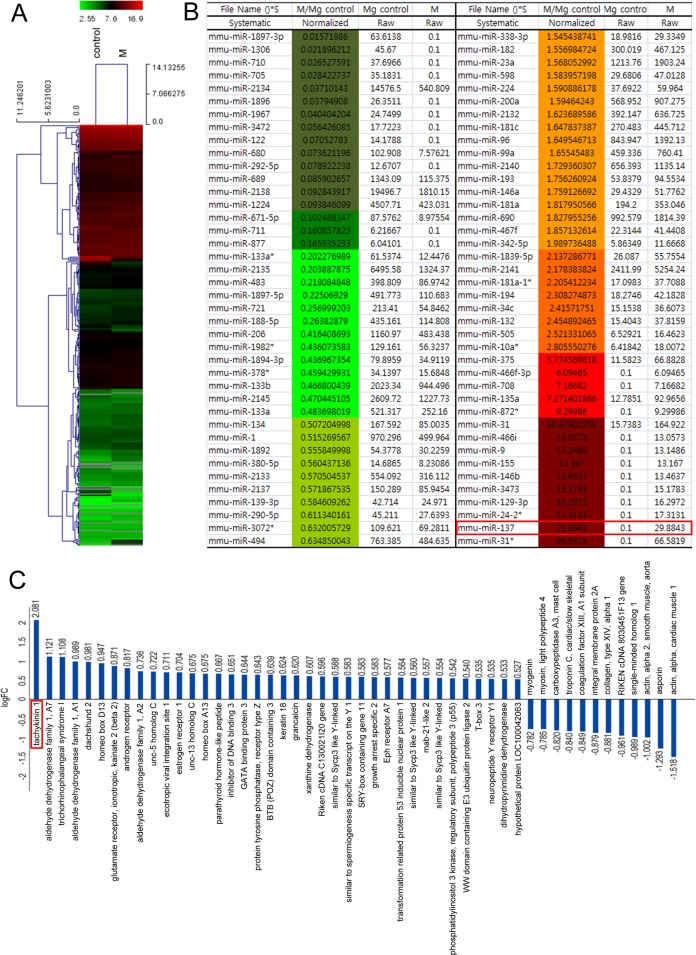
Figure 1. Heat-map of 3rd mammary gland and inter mammary gland region miRNA expression illustrating cluster-analysis of the expression data.
A., B. The signal intensity converted to log2 is reflected in the color scale such that dark green, green and red show low, medium and strong miRNA expression, respectively. The dendrogram on the left shows hierarchical similarity. C. Microarray data sorting for protein-coding genes related to mammary gland development.

