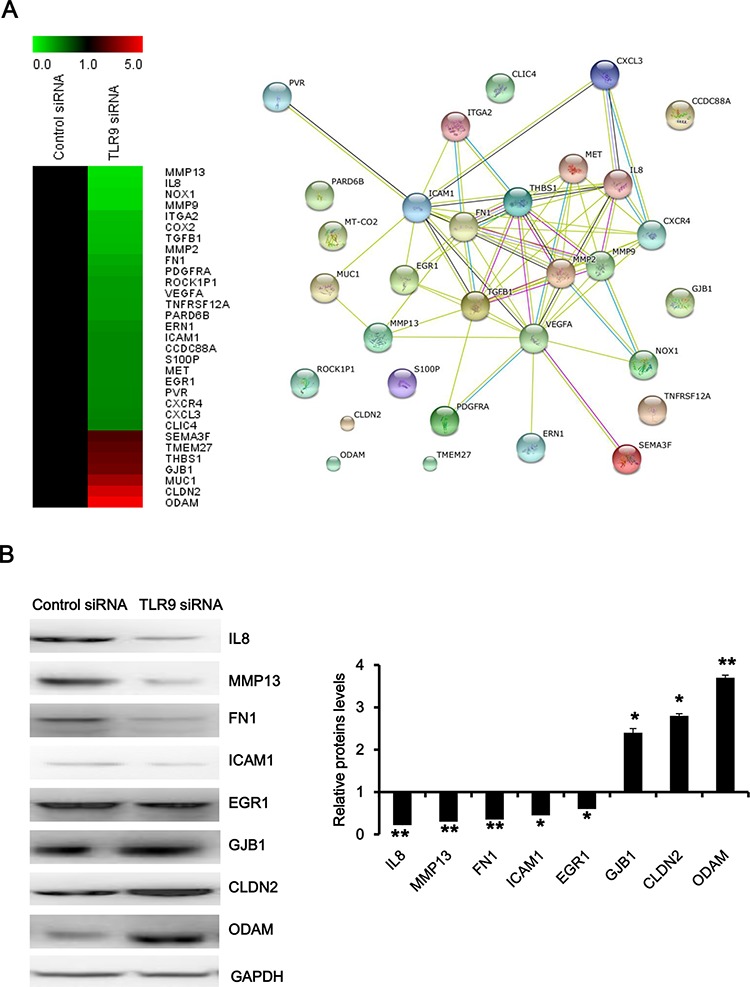
Figure 4. Functional analysis of TLR9 signaling network in regulation of migration and invasion.

A. The heatmap and interaction network of the indicated genes were anaylsed with MeV software and at http://string.embl.de/, respectively. B. Proteins were detected by Western blot with the indicated antibodies. The representative figures and quantified data from three individual experiments were shown. * and ** represent P < 0.05 and P < 0.01, respectively.
