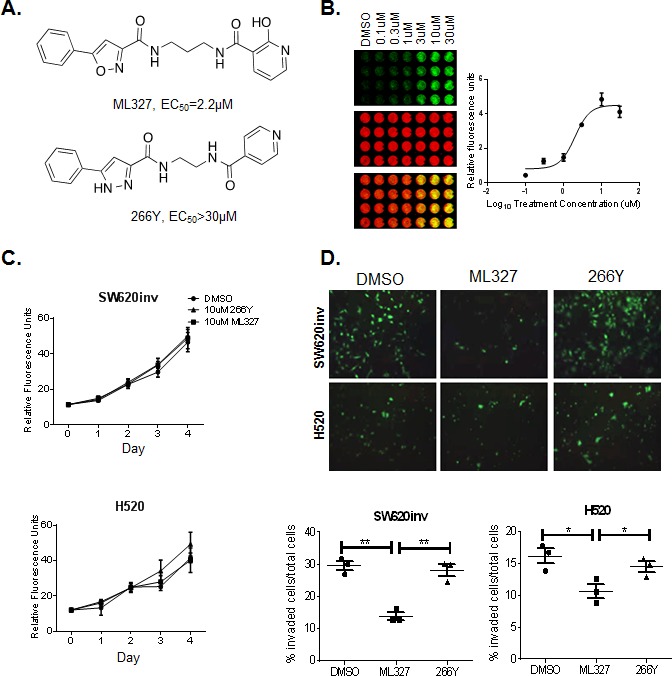
Figure 1. Treatment with ML327 reduces cancer cell invasive potential but has no effect on cell viability.

A. Chemical structures of ML327 and its inactive analogue, 266Y. Effective dose is listed for each compound. B. Representative in cell western (ICW) plate showing concentration-dependent changes in E-cadherin protein (green) relative to β-actin (red) following treatment with ML327 concentration as indicated. The graph shows mean values with standard error bars from 3 replicate plates. C. SW620inv and H520 cells were cultured in the presence of 10μM ML327, 10μM 266Y or DMSO for up to 4 days. Individual wells (n = 4 per group) were harvested for DNA content measures by fluorometry at 24 hour intervals. Mean fluorescence units (FU) is graphed with standard deviations for replicate wells in a representative experiment. The graphs are representative of at least three separate experiments with similar results. D. TOP: Images (200x magnification) of invading fluorescently labeled SW620inv and H520 cells cultured on Matrigel-coated transwells in the presence of 10μM ML327, 10μM 266Y or DMSO. BOTTOM: The proportion of stained cells that invaded through the transwell is graphed with a bar indicating the mean value and the whiskers indicating the standard deviation for 3 replicate wells in a representative experiment, statistical significance was calculated using unpaired t test, ** indicates p < 0.005, * indicates p < 0.05. The graphed data is representative of at least three separate experiments with similar results.
