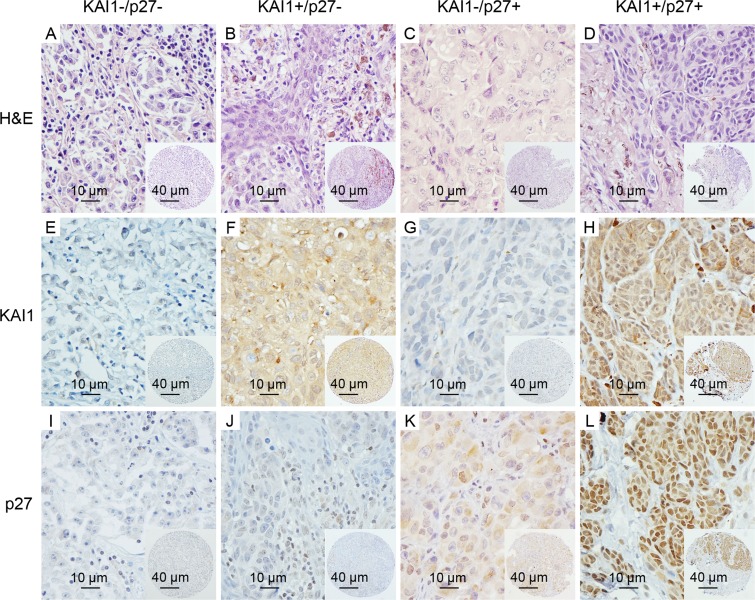
Figure 2. Representative images of KAI1 and p27 staining in subgroups of primary melanomas.
A.-D. the H & E staining images of representative cores are shown for each subgroup; E. and I., absent/minimal cytoplasmic expression of KAI1 and nuclear expression of p27 (KAI1-/p27-) were seen in 48 of the 145 cases; F.-H., J.-L., moderate or high cytoplasmic expression of KAI1 or nuclear expression of p27 (KAI1+/p27- or KAI1-/p27+), or expression of both (KAI1+/p27+), are shown in 97 of 145 primary melanoma patients. (magnification: × 400); insets show corresponding tissue microarray cores (magnification: × 100).

