

Abstract
Precise 3D spatial mapping of cells and their connections within living tissues is required to fully understand developmental processes and neural activities. Zebrafish embryos are relatively small and optically transparent, making them the vertebrate model of choice for live in vivo imaging. However, embryonic brains cannot be imaged in their entirety by confocal or two-photon microscopy due to limitations in optical range and scanning speed. Here, we use light-sheet fluorescence microscopy to overcome these limitations and image the entire head of live transgenic zebrafish embryos. We simultaneously imaged cranial neurons and blood vessels during embryogenesis, generating comprehensive 3D maps that provide insight into the coordinated morphogenesis of the nervous system and vasculature during early development. In addition, blood cells circulating through the entire head, vagal and cardiac vasculature were also visualized at high resolution in a 3D movie. These data provide the foundation for the construction of a complete 4D atlas of zebrafish embryogenesis and neural activity.
Keywords: 3D reconstruction, light-sheet microscopy, neurons, SPIM, vasculature, zebrafish embryos
INTRODUCTION
In recent years, light-sheet microscopy, or Single Plane Illumination Microscopy (SPIM), has reemerged as a valuable imaging technique, offering considerable advantages over conventional microscopy methods in developmental studies (Chardes et al., 2014; Huisken and Stainier, 2007; Keller, 2013; Keller et al., 2008, 2011; Mertz and Kim, 2010; Santi et al., 2009; Tomer et al., 2012; Truong et al., 2011; Weber and Huisken, 2011). SPIM employs side-on sample illumination using a micrometer-thick laser sheet to generate optical sections; fluorescent images are collected by a camera with its optical axis orthogonal to the illumination plane. Different regions in the focal plane are simultaneously illuminated, reducing the overall exposure time of samples, allowing faster throughput times and longer-term imaging protocols with minimal sample damage.
Acquisition of three-dimensional tissue data has been extensively done using confocal or two-photon microscopy by us and others during zebrafish embryogenesis (Kwak et al., 2013). These methods however are limited in speed and depth of imaging: only relatively small tissue samples can be scanned, meaning that whole brain samples, even those of the embryonic zebrafish cannot be imaged in their entirety. Photobleaching and phototoxicity also affect long-term in vivo imaging by confocal microscopy.
Light-sheet microscopy methodologies however can provide single-cell, or near single-cell resolution detail of a large proportion of the embryonic or larval zebrafish brain volume. Acquisition speed using SPIM is also 20–50 fold faster than point-scanning imaging without compromising the signal-to-noise ratio, resulting in reduced photobleaching and phototoxicity (Keller et al., 2011; Panier et al., 2013). Recently, functional light-sheet microscopy technology has been developed, allowing whole-brain mapping of neural activity in zebrafish embryos (Ahrens et al., 2013; Panier et al., 2013). The extended field of view provided by light-sheet microscopy allows the direct identification of related groups of cells spanning whole brain regions, helping establish interactive relationships between cells and tissues likely to be important during animal development.
Analysis of upstream genomic elements in neuronal and vascular promoters has led to the establishment of transgenic zebrafish lines with fluorescent neurons, blood cells or blood vessels (Isogai et al., 2001; Park et al., 2000; Traver et al., 2003). These resources are powerful tools, permitting the three dimensional mapping of distinct tissues in the whole brain and body. The vascular anatomy of the developing zebrafish has been previously described in detail using confocal imaging (Isogai et al., 2001).
Here, we used live SPIM imaging and transgenic lines to visualize and map in 3D the blood vessels and differentiating neurons of the entire zebrafish brain during development. We also imaged circulating blood cells within blood vessels of the whole anterior embryonic body in 3D. Our results reveal details of the spatial relationship between the developing nervous system and blood vessels, as well as providing a direct visualization of blood flow through the entire cranial vasculature. Such data cannot be obtained by traditional point scanning microscopy.
MATERIALS AND METHODS
Zebrafish husbandry
Adult zebrafish (Danio rerio) were maintained at 27.5°C in a 14/10 h light/dark cycle. Embryos were raised in E3 medium (5 mM NaCl, 0.33 mM MgSO4, 0.33 mM CaCl2, and 0.17 mM KCl) at 28.5°C and staged by hours post fertilization according to Kimmel et al. (1995). Strains used in this study were wild type AB, Tg(elavl3:DsRed)(Paquet et al., 2009), Tg(fli1a:EGFP) (Lawson et al., 2002) and Tg(gata1: DsRed)(Traver et al., 2003). All experiments were conducted according to protocols approved by the Institutional Animal Care.
Zebrafish embryo embedding for imaging
Zebrafish embryos were first anesthetized in E3 media containing 0.02% Tricaine (Sigma), then embedded and centered within glass capillaries (1.0 mm inner diameter, Zeiss) filled with low-melting point agarose (LMP, 2% in E3 medium, 0.02% Tricaine). After setting, an agarose cylinder containing the anterior portion of the embryo was extruded from the capillary by inserting the opposite end into a microfuge tube containing 2% LMP agarose. The imaging chamber was filled with E3 medium 0.02% Tricaine and was maintained at 23°C throughout the imaging period.
Light-sheet microscopy imaging
In all experiments a Lightsheet Z.1 fluorescence microscope with W Plan-Apochromat 20×/1.0 objective (Zeiss) was used to collect data. Fluorescence was excited with 488 nm and 561 nm lasers, and emission was detected with 500–545 nm and 575–615 nm band-pass filters.
Image processing
All SPIM data was saved in the LSM format and processed using ZEN software (Zeiss). Maximum intensity projections were generated from each z-stack file. Three-dimensional images were reconstructed using Imaris software (Bitplane, USA), in which each voxel was recognized by the power of each fluorescent signal.
RESULTS
Morphogenesis of the nervous system and vasculature is coordinated during embryogenesis; development of these two tissue types can occur independently, but key interactions may occur in particular regions at specific times which are necessary for proper development and function. To fully understand the activity-dependent interactions between these tissues, or to map neural circuits, precise 3D positional data across developmental time is required across the entire head or body. Here, we performed simultaneous live 3D imaging of cranial neurons and blood vessels in the entire embryonic brains of transgenic zebrafish using light-sheet fluorescence microscopy to maximize physical coverage of the brain.
Light-sheet microscopy of cranial neurons and blood vessels at 24 hpf
The transgenic line Tg(fli1a:EGFP) fluorescently labels the developing vasculature and pharyngeal arches. This was combined with Tg(elavl3:DsRed) animals, in which DsRed fluorescent protein is expressed under the control of the pan-neuronal elavl3/HuC promoter (Park et al., 2000). The resultant Tg (elavl3:DsRed)/Tg(fli1a:EGFP) embryos were live imaged in 3D at 24 hpf (Fig. 1). Using Imaris software, 3D images were generated from the entire stack of 1740 optical sections (0.488 μm thickness) (Fig. 1A, a), or from selected central optical sections to more clearly show internal structures (Fig. 1A, b–d). Samples are positioned in rotatable glass capillaries within the Lightsheet Z.1 microscope, allowing imaging from all sides. 3D reconstructions of the 24hpf embryonic head were generated illustrating dorsal, ventral and lateral views (Fig. 1B, a,c,e), each of these was further processed to create a 3D segmented model of fli1a:EGFP-positive tissues (Fig. 1B, b,d), or both fli1a:EGFP-positive and elavl3:DsRed-positive tissues (Fig. 1B, f) by surface rendering. An animated 3D reconstruction is presented in supplementary movie 1 (Supplementary Fig. S1), revealing the detailed internal structures of embryonic tissues in the whole head and anterior trunk.
Fig. 1.
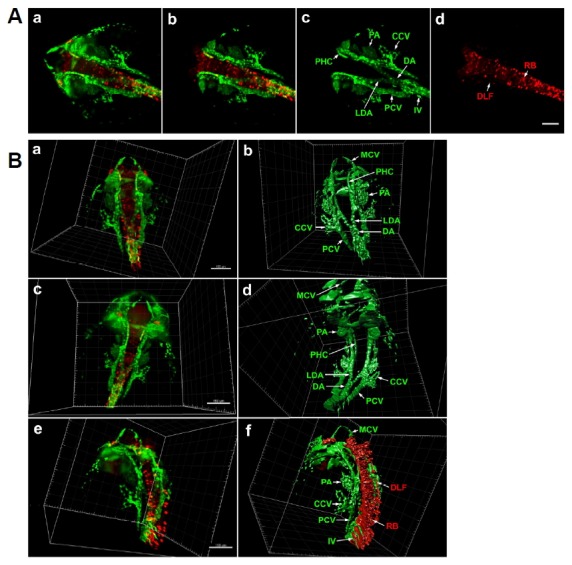
Light-sheet microscopy of differentiating neurons and vasculature in Tg(elavl3: DsRed/fli1a: EGFP) zebrafish embryo at 24 hpf. (A) Dorsal view of whole head and anterior trunk. (a) 3D reconstruction of the entire anterior portion of embryo. fli1a: EGFP-positive cells are green and elavl3:DsRed-positive cells are red. Data is comprised of 1740 optical sections of 0.488 μm thickness. (b) 3D reconstruction of 740 central optical sections (1001–1740), omission of dorsal and ventral regions allows clearer visualization of internal fli1a:EGFP-positive (c) and elavl3: DsRed-positive (d) structures. Scale bar 100 μm. (B) 3D reconstruction and segmentation using Imaris software. (a) 3D reconstruction of full image stack in dorsal view. (b) 3D segmentation of fli1a: EGFP-positive tissues, internal structures are labelled. (c) Ventral view of same embryo. (d) 3D segmentation of fli1a:EGFP-positive tissues. (e) Lateral view of 24 hpf embryo. (f) 3D segmentation of fli1a:EGFP and elavl3:DsRed-positive tissues. An animated 3D video of these data is presented in Supplementary Fig. S1. Scale bar 150 μm. CCV, common cardinal vein; DA, dorsal aorta; DLF, dorsal longitudinal fasciculus; IV, intersegmental vein; LDA, lateral dorsal aorta; MCV, middle cerebral vein; PA, pharyngeal arch; PCV, posterior cardinal vein; PHC, primordial hindbrain channel; RB, Rohon-Beard neuron.
At 24 hpf, the embryo is curled around the dorsal yolk surface; it therefore takes longer to completely image the entire embryo using longitudinal optical sections than older, straighter, embryos. In this experiment, light-sheet imaging to a depth of 850 μM covered the entire head and anterior trunk (1740 optical sections of 0.488 μm thickness). In contrast, confocal laser scanning (LSM780, Zeiss) of the same sample could only achieve a 3D image depth of 100–200 μM (data not shown).
Blood cells begin to circulate through the developing blood vessels at this stage. The arch aorta extends to the lateral dorsal aorta, then merges caudally with the dorsal aorta (Figs. 1A, c and 2B, s,d,f). The dorsal aorta runs caudally to the anal pore, while the posterior cardinal vein runs in the opposite direction from the anal pore to anterior head. Intersegmental veins branch dorsally, and the common cardinal veins develop bilaterally on the dorsal yolk surface.
Fig. 2.
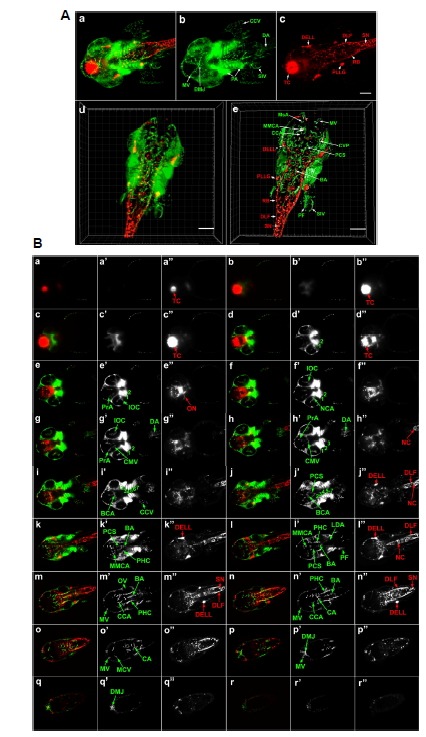
SPIM and 3D reconstruction of cranial neurons and vasculature in Tg(elavl3:DsRed/ fli1a: EGFP) zebrafish embryo at 42 hpf. (A) Dorsal view of whole head and anterior trunk. (a–c) 3D reconstruction of the entire anterior portion of embryo. fli1a:EGFP-positive cells are green and elavl3:DsRed-positive cells are red. Data is comprised of 479 optical sections of 1.176 μm thickness using optimum interval option. Scale bar 100 μm. An animated movie of the 3D raw data analysis is available in Supplementary movie Fig. S2A. (d, e) 3D reconstruction of selected optical sections (277–362) (d) and its 3D segmentation (e) using Imaris software to reveal fine detail of internal structure. Scale bar 150 μm. Video files of the final 3D reconstructions are presented as Supplementary movies in Figs. S2B (raw data) and S2C (segmented images). (B) Optical sections of 42 hpf embryo. Optical sections covering the entire embryonic head along the dorsalventral axis were merged into 21 consecutive slices of 24.696 μm thickness. The 18 of these sections (a–r) are shown (a′–r′:fli1a: EGFP, a″–r″: elavl3:DsRed). BA, basilar artery; BCA, basal communicating artery; CA, caudal artery; CCA, cerebellar central artery; CCV, common cardinal vein; CMV, communicating vessel; CVP, choroidal vascular plexus; DA, dorsal aorta; DELL, diencephalic efferent neurons to the lateral line; DLF, dorsal longitudinal fasciculus; DMJ, dorsal midline junction; IOC, inner optic circle; LDA, lateral dorsal aorta; MMCA, middle mesencephalic central artery; MsA, mesencephalic artery; MV, mesencephalic vein; NC, notochord; NCA, nasal ciliary artery; ON, optic neuron; OV, otic vesicle; PA, pharyngeal arch; PCS, posterior communicating segment; PF, pectoral fin; PHC, primordial hindbrain channel; PLLG, posterior lateral line ganglion; PrA, prosencephalic neuron; RB, Rohon-Beard neuron; SIV, subintestinal vein; SN, spinal neuron; TC, telencephalic cluster, 1, mandibular arch; 2, hyoid arch; 3 to 7, pharyngeal arch.
3D SPIM imaging and reconstruction of cranial neurons and blood vessels at 42 hpf
SPIM imaging of 42 hpf embryos was also performed (Fig. 2). In this case, light sheet thickness was 1.176 μm for each section and again, selected central sections were reconstructed to more clearly visualize internal structures (Fig. 2A, a–e, 479 sections; Fig. 2B, a–r”, 420 sections). Imaris software was used to generate a solid surface model, illustrating deep structures inside the brain (Fig. 2A, e), and a 3D reconstruction of total raw data (Fig. 2A, d). Animated 3D reconstructions of the complete 42 hpf SPIM data (Supplementary Fig. S2A), the central SPIM data after removal of most dorsal and ventral sections (Supplementary Fig. S2B), and the same central SPIM data following segmentation (Supplementary Fig. S2C) is presented as supplementary movie files.
The detailed 3D morphology of the developing embryo is clearly evident from the most anterior veins and differentiating neurons to the spinal neurons and sprouting veins of the trunk (labeled in Fig. 2A,e).
3D networks of cranial neurons and vasculature at 3.2 dpf
Tg(elavl3:DsRed/ fli1a:EGFP) embryos were similarly imaged at 3.2 dpf from dorsal (Fig. 3A, a–c) and lateral (Fig. 3A, d–f) viewpoints. 503 dorsal sections of 1.0 µm light-sheet thickness were assembled for 3D reconstruction. At this stage, the innermost structures most distant from the objective were slightly fuzzy, although the morphology of all developing neurons and blood vessels in the entire anterior embryo were identifiable (Fig. 3A, g; Supplementary movie Fig. S3A). Segmentation of the 3D image after removal of the most dorsal and ventral sections using Imaris surface rendering resulted in clearer visualization of internal structures (Fig. 3A, h; Supplementary movie Fig. S3B). Lateral imaging of the same 3.2 dpf Tg(fli1a: EGFP/elavl3:DsRed) embryo was also performed; the 3D reconstruction was generated from 591 sections of 1.0 µm optical thickness, resulting in clearer presentation of the lateral structures (Fig. 3A, d–f).
Fig. 3.
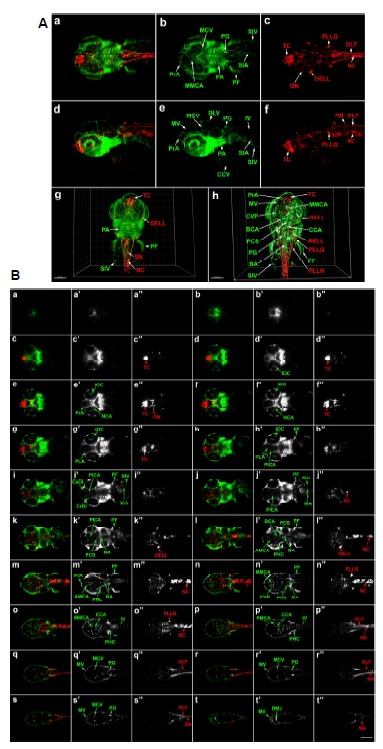
3D imaging analysis of cranial neurons and vasculature in Tg(elavl3: DsRed/Fli1a:EGFP) zebrafish embryo at 3.2 dpf. (A) Dorsal view of whole head and anterior trunk. (a–c) 3D reconstruction: fli1a:EGFP-positive tissues are green and elavl3:DsRed-positive neurons are red. Data set is 503 μm thick. Scale bar 200 μm. (d–f) Lateral images of the same embryo: 591 μm thickness. (g) 3D reconstruction of raw data: 503 μm thickness. (h) 3D segmentation of selected sections: 277 μm thickness, internal structures are labelled. Scale bars 150 μm. 3D movies showing the entire reconstructed head are presented in Supplementary Figs. S3A (raw data) and S3B (segmented images). (B) Optical sections of Tg(elavl3:DsRed/fli1a:EGFP) zebrafish at 3.2 dpf (a–t). Optical sections were combined to create 21 μm compressed sections highlighting fli1a:EGFP-positive tissues (green; a′–t′) and elavl3:DsRed-positive neurons (red; a″–t″). AMCA, anterior mesencephalic central artery; BA, basilar artery; BCA, basal communicating artery; CaDI, caudal division of the internal carotid artery; CCA, cerebellar central artery; CCV, common cardinal vein; CrDI, cranial division of the internal carotid artery; CVP, choroidal vascular plexus; DELL, diencephalic efferent neurons to the lateral line; DLF, dorsal longitudinal fasciculus; DLV, dorsal longitudinal vein; DMJ, dorsal midline junction; IOC, inner optic circle; IV, intersegmental vessel; MCV, middle cerebral vein; MMCA, middle mesencephalic central artery; MV, mesencephalic vein; NC, notochord; NCA, nasal ciliary artery; ON, optic neuron; PA, pharyngeal arch; PCS, posterior communicating segment; PF, pectoral fin; PG, pronephric glomus; PHC, primordial hindbrain channel; PICA, primitive internal carotid artery; PLA, palatocerebral artery; PLLG, posterior lateral line ganglion; PLLN, posterior lateral line neuron; PrA, prosencephalic neuron; RB, Rohon-Beard neuron; RELL, rhombencephalic efferent neurons to the lateral line; SIA, subintestinal artery; SIV, subintestinal vein; SN, spinal neuron; TC, telencephalic cluster; 1, mandibular arch; 2, hyoid arch; 3 to 7, pharyngeal arch.
Multi-view 3D imaging of blood cells and blood vessels at 35 hpf
Next, circulating blood cells and their associated vasculature were simultaneously visualized in live Tg(fli1a:EGFP/gata1: DsRed) embryos at 35 hpf (Fig. 4). In this transgenic animals, gata1:DsRed-positive blood cells circulate through fli1a:EGFP-positive blood vessels (Traver et al., 2003). Multi-view images of the whole brain, anterior trunk and the subintestinal vasculature around the yolk were recorded in 696 optical sections of 1.0 µm thickness (Fig. 4). Light-sheet microscopy imaging of samples in glass tubes allows the collecting of optical sections from multiple directions, and therefore, the limitations of SPIM resolution in deeper sections of large specimens can be overcome. Using optical sections from dorsal view imaging, we generated a 3D reconstruction from raw data (Fig. 4, m; Supplementary Fig. S4A) and also constructed segmentation models using the surface function (Fig. 4, n; Supplementary Fig. S4B). This study demonstrates that light-sheet imaging allows the complete visualization of blood cell formation, local distribution and circulation through developing blood vessels in the entire zebrafish embryo during development.
Fig. 4.
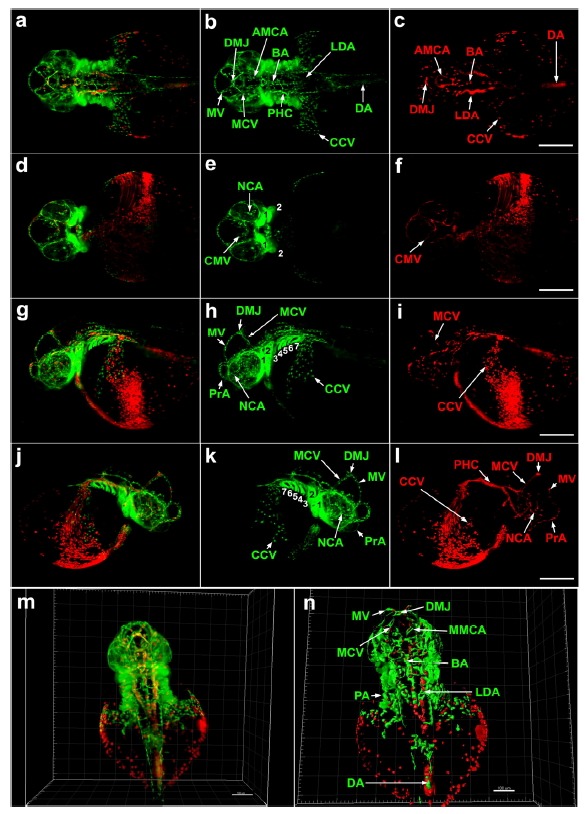
Multi-view SPIM imaging of embryonic blood cells and vasculature in Tg(gata1: DsRed/fli1a:EGFP) zebrafish at 35 hpf. (a–l) 3D reconstruction from 1.0 μm optical sections of whole brain and anterior trunk (including subintestinal vasculature) of 35 hpf embryo. fli1a: EGFP-positive cells are green gata1:DsRed -positive blood cells are red. (a–c) Dorsal view, constructed from 399 optical sections (280–618). (d–f) ventral view, constructed from 457 optical sections (195–651). (g–i) left lateral view: 515 optical sections (225–739). (j–l) right lateral view: 445 optical sections (292–736). Scale bars 200 μm. (m) 3D reconstruction of raw data containing 410 optical sections (280–618) (n) 3D reconstruction of segmented data using Imaris software’s surface function. Scale bar, 150 μm. Supplementary Figs. S4A and S4B show final 3D reconstructions from raw and segmented data. AMCA, anterior mesencephalic central artery; BA, basilar artery; CCV, common cardinal vein; CMV, communicating vessel; DA, dorsal aorta; DMJ, dorsal midline junction; LDA, lateral dorsal aorta; MCV. middle cerebral vein; MMCA, middle mesencephalic central artery; MV, mesencephalic vein; NCA, nasal ciliary artery; PHC, primordial hindbrain channel; PrA, prosencephalic artery; 1, mandibular arch; 2, hyoid arch; 3 to 7, pharyngeal arches.
DISCUSSION
This study is the first to visualize and comprehensively map the 3D anatomy of cranial neurons, vasculature tissues and blood cells in the entire embryonic brains at different stages of embryogenesis using Light-Sheet microscopy. SPIM overcomes many of the limitations of focal imaging, including confocal microscopy, generating live 3D images at high speed and spatio-temporal resolution. We achieved an imaging depth of 850 μM with SPIM, permitting complete imaging of the entire embryonic zebrafish head within 15 min. In comparison, confocal microscopy was only effective to a depth of 200 μM and complete sample imaging required hours of scanning time. Our results provide the foundation for the construction of a complete 4D developmental atlas of zebrafish embryogenesis; such a tool would be of particular benefit in providing reference for registering focal neural activity of specific brain regions across the entire brain, and for the study of detailed tissue anatomy and morphological process in normal and mutant fish.
The aim of next generation live imaging techniques should be to monitor the activities of complete neural circuits at high resolution over prolonged time periods. Multi-view light-sheet microscopy has so far been adopted to generate quantitative in vivo data from whole Drosophila and zebrafish embryos (Tomer et al., 2012). In mice, fast three-dimensional fluorescence imaging of activity in neural populations has been demonstrated by objective-coupled planar illumination microscopy (Holekamp et al., 2008). Exciting recent progress in optogenetics would be complemented by further refinement of available in vivo imaging methodologies, providing new ways of studying brain activity and associated behavioral changes in living animals. 3D maps such as ours will be invaluable in providing 3D anatomical landmarks for correlating optogenetic data with distinct neuronal circuits by rapid analysis of the entire nervous system and cranial vasculature in a single experiment; this offers real advantages over traditional landmarks which are based on anatomical features.
The volume of data created during light-sheet microscopy is far greater than that of standard confocal microscopy, often requiring terabytes of storage capacity per experiment, and thus computing power may currently be a limiting factor in the complete assembly and interpretation of light-sheet microscopy image files.
Acknowledgments
This work was supported by the Basic Science Research Program through the National Research Foundation of Korea (NRF) (2011-0021845 to YK), NRF-2015R1D1A3A01015641 to BJH by the Ministry of Education, the “Leaders Industry-University Cooperation” Project by the Ministry of Education to BJH a 2014 Research Grant from Kangwon National University to YK, and Korea Basic Science Institute grant (T35773).
Footnotes
Note: Supplementary information is available on the Molecules and Cells website (www.molcells.org).
REFERENCES
- Ahrens M.B., Orger M.B., Robson D.N., Li J.M., Keller P.J. Whole-brain functional imaging at cellular resolution using light-sheet microscopy. Nat. Methods. 2013;10:413–420. doi: 10.1038/nmeth.2434. [DOI] [PubMed] [Google Scholar]
- Chardes C., Melenec P., Bertrand V., Lenne P.F. Setting up a simple light sheet microscope for in toto imaging of C. elegans development. J. Vis. Exp. 2014;5 doi: 10.3791/51342. [DOI] [PMC free article] [PubMed] [Google Scholar]
- Holekamp T.F., Turaga D., Holy T.E. Fast three-dimensional fluorescence imaging of activity in neural populations by objective-coupled planar illumination microscopy. Neuron. 2008;57:661–672. doi: 10.1016/j.neuron.2008.01.011. [DOI] [PubMed] [Google Scholar]
- Huisken J., Stainier D.Y. Even fluorescence excitation by multidirectional selective plane illumination microscopy (mSPIM) Opt. Lett. 2007;32:2608–2610. doi: 10.1364/ol.32.002608. [DOI] [PubMed] [Google Scholar]
- Isogai S., Horiguchi M., Weinstein B.M. The vascular anatomy of the developing zebrafish: an atlas of embryonic and early larval development. Dev. Biol. 2001;230:278–301. doi: 10.1006/dbio.2000.9995. [DOI] [PubMed] [Google Scholar]
- Keller P.J. In vivo imaging of zebrafish embryogenesis. Methods. 2013;62:268–278. doi: 10.1016/j.ymeth.2013.03.015. [DOI] [PMC free article] [PubMed] [Google Scholar]
- Keller P.J., Schmidt A.D., Wittbrodt J., Stelzer E.H. Reconstruction of zebrafish early embryonic development by scanned light sheet microscopy. Science. 2008;322:1065–1069. doi: 10.1126/science.1162493. [DOI] [PubMed] [Google Scholar]
- Keller P.J., Schmidt A.D., Wittbrodt J., Stelzer E.H. Digital scanned laser light-sheet fluorescence microscopy (DSLM) of zebrafish and Drosophila embryonic development. Cold Spring Harb. Protoc. 2011;2011:1235–1243. doi: 10.1101/pdb.prot065839. [DOI] [PubMed] [Google Scholar]
- Kimmel C.B., Ballard W.W., Kimmel S.R., Ullmann B., Schilling T.F. Stages of embryonic development of the zebrafish. Dev. Dyn. 1995;203:253–310. doi: 10.1002/aja.1002030302. [DOI] [PubMed] [Google Scholar]
- Kwak J., Park O.K., Jung Y.J., Hwang B.J., Kwon S.H., Kee Y. Live image profiling of neural crest lineages in zebrafish transgenic lines. Mol. Cells. 2013;35:255–260. doi: 10.1007/s10059-013-0001-5. [DOI] [PMC free article] [PubMed] [Google Scholar]
- Lawson N.D., Vogel A.M., Weinstein B.M. sonic hedgehog and vascular endothelial growth factor act upstream of the Notch pathway during arterial endothelial differentiation. Dev. Cell. 2002;3:127–136. doi: 10.1016/s1534-5807(02)00198-3. [DOI] [PubMed] [Google Scholar]
- Mertz J., Kim J. Scanning light-sheet microscopy in the whole mouse brain with HiLo background rejection. J. Biomed. Opt. 2010;15:016027. doi: 10.1117/1.3324890. [DOI] [PMC free article] [PubMed] [Google Scholar]
- Panier T., Romano S.A., Olive R., Pietri T., Sumbre G., Candelier R., Debregeas G. Fast functional imaging of multiple brain regions in intact zebrafish larvae using selective plane illumination microscopy. Front. Neural Circuits. 2013;7:65. doi: 10.3389/fncir.2013.00065. [DOI] [PMC free article] [PubMed] [Google Scholar]
- Paquet D., Bhat R., Sydow A., Mandelkow E.M., Berg S., Hellberg S., Falting J., Distel M., Koster R.W., Schmid B., et al. A zebrafish model of tauopathy allows in vivo imaging of neuronal cell death and drug evaluation. J. Clin. Invest. 2009;119:1382–1395. doi: 10.1172/JCI37537. [DOI] [PMC free article] [PubMed] [Google Scholar]
- Park H.C., Kim C.H., Bae Y.K., Yeo S.Y., Kim S.H., Hong S.K., Shin J., Yoo K.W., Hibi M., Hirano T., et al. Analysis of upstream elements in the HuC promoter leads to the establishment of transgenic zebrafish with fluorescent neurons. Dev. Biol. 2000;227:279–293. doi: 10.1006/dbio.2000.9898. [DOI] [PubMed] [Google Scholar]
- Santi P.A., Johnson S.B., Hillenbrand M., GrandPre P.Z., Glass T.J., Leger J.R. Thin-sheet laser imaging microscopy for optical sectioning of thick tissues. BioTechniques. 2009;46:287–294. doi: 10.2144/000113087. [DOI] [PMC free article] [PubMed] [Google Scholar]
- Tomer R., Khairy K., Amat F., Keller P.J. Quantitative high-speed imaging of entire developing embryos with simultaneous multiview light-sheet microscopy. Nat. Methods. 2012;9:755–763. doi: 10.1038/nmeth.2062. [DOI] [PubMed] [Google Scholar]
- Traver D., Paw B.H., Poss K.D., Penberthy W.T., Lin S., Zon L.I. Transplantation and in vivo imaging of multilineage engraftment in zebrafish bloodless mutants. Nat. Immunol. 2003;4:1238–1246. doi: 10.1038/ni1007. [DOI] [PubMed] [Google Scholar]
- Truong T.V., Supatto W., Koos D.S., Choi J.M., Fraser S.E. Deep and fast live imaging with two-photon scanned light-sheet microscopy. Nat. Methods. 2011;8:757–760. doi: 10.1038/nmeth.1652. [DOI] [PubMed] [Google Scholar]
- Weber M., Huisken J. Light sheet microscopy for real-time developmental biology. Curr. Opin. Genet. Dev. 2011;21:566–572. doi: 10.1016/j.gde.2011.09.009. [DOI] [PubMed] [Google Scholar]
Associated Data
This section collects any data citations, data availability statements, or supplementary materials included in this article.