Abstract
The cooperativity of ligand binding is central to biological regulation and new approaches are needed to quantify these allosteric relationships. Herein, we exploit a suite of mass spectrometry (MS) experiments to provide novel insights into homotropic Cu-binding cooperativity, gas-phase stabilities and conformational ensembles of the D2-symmetric, homotetrameric copper sensitive operon repressor (CsoR) as a function of Cu(I) ligation state. Cu(I) binding is overall positively cooperative, but is characterized by distinct ligation state-specific cooperativities. Structural transitions occur upon binding the first and fourth Cu(I), with the latter occurring with significantly higher cooperativity than previous steps; this results in the formation of a holo-tetramer is that markedly more resistant than apo-, and partially-ligated CsoR tetramers toward surface-induced dissociation (SID).
Keywords: metalloregulation, allostery, metalloproteins, copper, mass spectrometry, ion-mobility, surface-induced dissociation
The structural, dynamic and thermodynamic origins of cooperativity of ligand binding (allostery) is a subject of considerable interest, motivated by the central role this process plays in the regulation of biological activity.[1] Cooperativity can be positive or negative and involve the binding of the same (homotropic) or different (heterotropic) ligands, often to an homooligomeric protein.[2–3] Bacterial repressors that function to control transition metal bioavailability in cells are typically homodimeric or homotetrameric and minimally bind two “ligands”: a DNA operator found upstream of metal-regulated genes and a specific (cognate) transition metal ion(s).[4] Although a robust thermodynamic framework capable of quantifying both homo- and heterotropic cooperativity in these systems is available,[5] these ensemble-based methods suffer from the limitation that a specific, partially ligated state can not be studied independently of other states. Such step-wise insights are required to understand allosteric coupling beyond a generally phenomenological description.[1]
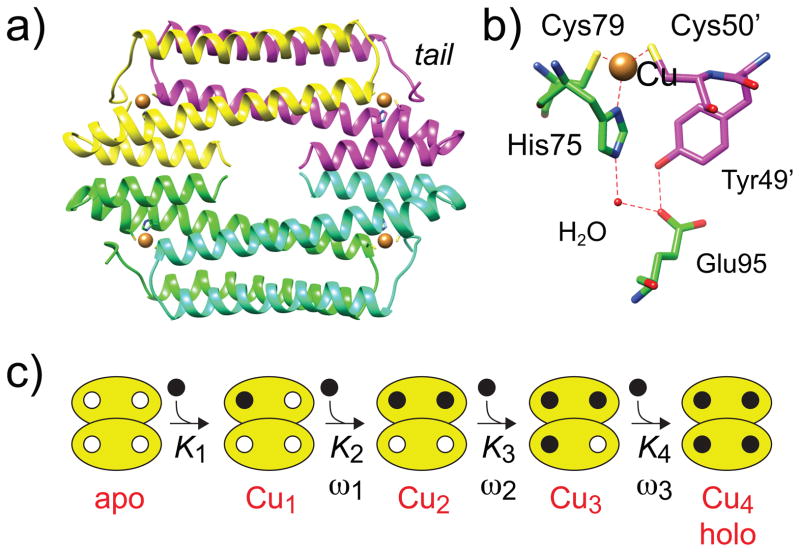
The Cu(I)-specific homotetrameric metalloregulatory protein, copper-sensitive operon repressor (CsoR) (Figure 1a) binds four Cu(I) ions to four identical subunit-bridging Cys2-His sites (Figure 1b) with high affinity, KCu≈1018 M−1.[6–7] Apo-CsoR forms a 2:1 CsoR tetramer:DNA “sandwich” complex, with bound DNA binding along one face of each of two tetramers.[8–10] Cu(I) binding leads to dissociation of CsoR from the DNA operator (negative heterotropic linkage) resulting in transcriptional derepression of Cu-resistance genes. CsoR regulates free Cu, which is buffered to vanishingly low bioavailability in the cytoplasm of cells.[11] Copper toxicity[12] is a well-established antimicrobial weapon employed by the host to combat bacterial infection.[13–14] Previous studies reveal that Cu-mediated DNA dissociation is associated with a global quaternary structural compaction in the CsoR tetramer.[15–16] However, there is no information on the structure or stability of partially Cu-ligated states of CsoR, nor is it known if the binding of Cu is cooperative.
Figure 1.
Ribbon representation (a) of the structure of a thermophilic CsoR tetramer (PDB: 4M1P) closely related to B. subtilis CsoR studied here.[16] Each protomer is shaded differently, with the Cu(I) ions indicated by the brown spheres. The folded N-terminal tail (tail) is indicated. (b) Close-up of the Cu(I) binding pocket of CsoR. (c) Schematic representation of the step-wise Ki and ωi used this analysis.
Herein, we develop a soft-ionization-based mass spectrometry (MS) approach to unravel homotropic linkage relationships in CsoR by resolving partially Cu-ligated tetramers based on their unique m/z values. Although previous studies have determined the Hill coefficient for cooperativity of ligand binding to a homotetramer using mass spectrometry[17] and prior work on monomeric metal binding proteins shows that apo- and holoproteins obtained at substoichiometric metal can be monitored by mass spectrometry as a titration is carried out in solution,[18–21] we develop here a generally applicable approach to rigorously determine the cooperativity of Cu(I) binding at every Cu(I) binding step, termed the step-wise cooperativities (Figure 1c).
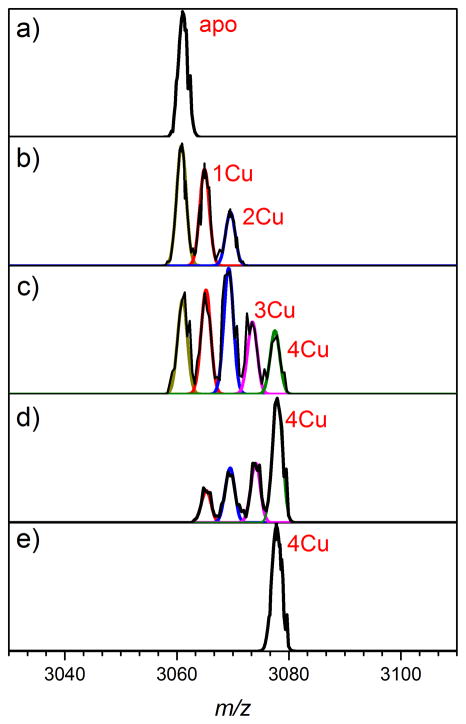
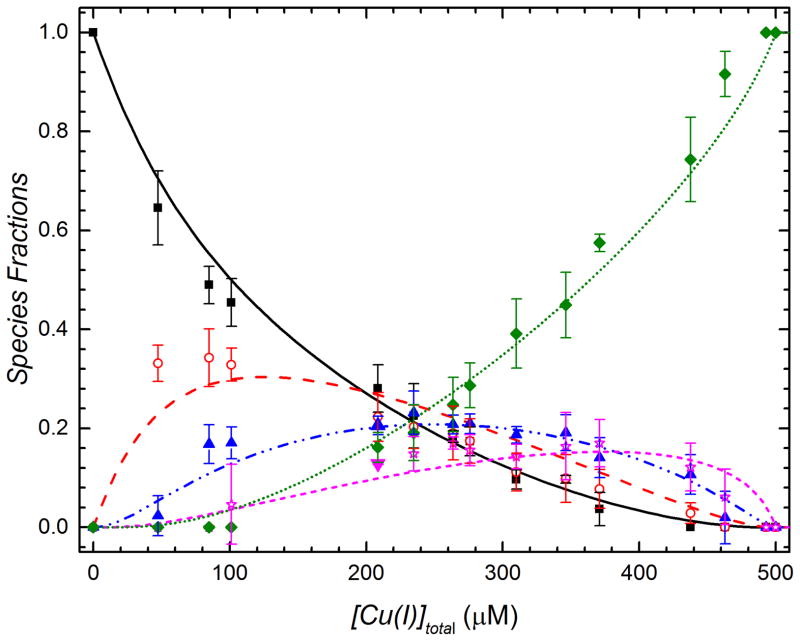
To do this, we quantified the fractional concentrations of each ith ligated species of the CsoR tetramer (where i=0 to 4) as a function of added CuCl up to stoichiometric equivalence in an anaerobic solution under conditions in which all added Cu(I) is bound, i.e., [CsoR]≫1/KCu.[22] The resulting mass spectra (see Figure S1) of the 15+ charge state (Figure 2) show the change in abundance of each ith Cu(I)i-bound state (i=0–4 in Figure 2a–e, respectively) as the total Cu(I) concentration is increased. Even at a molar ratio of Cu(I) to protomer of 2 (Figure 2c), the holo (Cu4) species, characterized by an m/z of ~3077, is present to a degree greater than would be expected for non-cooperative Cu(I) binding, with further additions of Cu(I) further increasing the abundance of the holo species (Figure 2d–e). This result holds for all charge states and can only be due to overall positively cooperative binding of Cu(I) to the CsoR tetramer. The mol species fractions of each Cu(I)i state reveals a clear propensity to form holo–CsoR at substoichiometric concentrations of Cu (Figure 3).
Figure 2.
Representative normalized mass-to-charge spectra of the 15+ charge state of CsoR as a function of copper addition. Solutions were 500 μM in CsoR protomer (125 μM tetramer) with the addition of 0 μM CuCl (a), 125 μM CuCl (b), 250 μM CuCl (c), 375 μM CuCl (d) or 500 μM CuCl (e). Each spectrum was fit with Gaussians at the mass– to–charge ratio of each Cu–bound state to determine the intensity (I) of each metallated species (apo; yellow, Cu1; red, Cu2; blue, Cu3; magenta, Cu4; green, left to right). Mol species fractions are calculated from Ii/ΣIi for each addition of Cu (see Figure 3).
Figure 3.
Mol species fractions of CsoR tetramers as a function of Cu(I) concentration. Data represent triplicate experiments across all useable charge states, with standard error of the mean value defined by the error bar. The continuous lines are the results of a global fit of all species fractions as a function of added Cu(I) to a step-wise cooperative binding model (see Supporting Information). Apo, Cu1, Cu2, Cu3, Cu4 CsoRs species are represented by black squares, red open circles, blue triangles, magenta open stars and green diamond symbols, respectively.
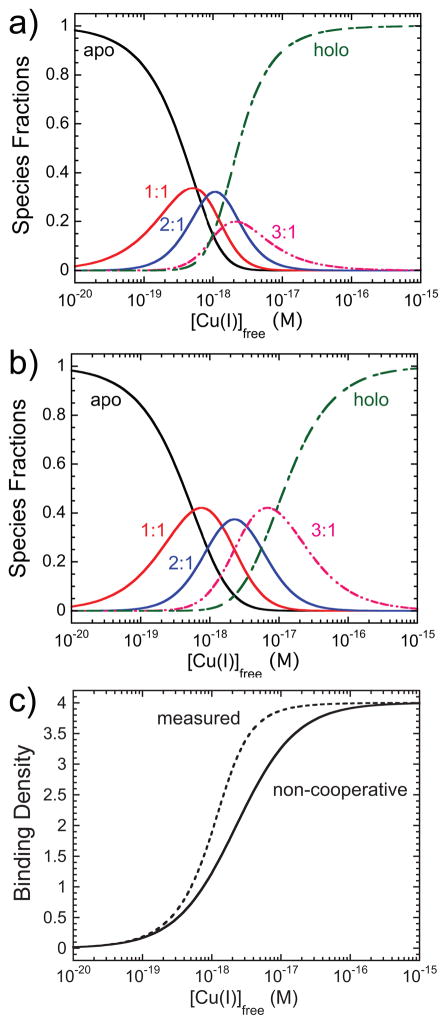
A global fitting of the data in Figure 3 allows resolution of the step-wise equilibrium binding constants (K1–K4) and ligation state-specific Cu(I) binding cooperativities, ω1, ω2, and ω3 (see Supporting Information for details) (Figure 1c). The resolved step-wise cooperativities of 1.9 (±0.2), 2.3 (±0.2) and 5.2 (±0.3) for ω1, ω2 and ω3 along with K4 ≈2-fold larger than K1, reveal quantitatively that Cu(I) binding to the CsoR tetramer is overall positively cooperative (Table S1; Figure S2). This cooperativity is also reflected in the species fractions vs. [Cu]free plots simulated from these Ki (Figure 4a), compared to a non-cooperative binding system with K1 fixed at the value obtained for K1 in the cooperative system (Figure 4b). This has the clear effect of moving the simulated Cu(I) binding isotherm to the left of the non-cooperative binding isotherm, while making it appear more sigmoidal (Figure 4c); as a result, formation of holo-CsoR occurs at ~5-fold lower [Cu]free relative to the non-cooperative case.
Figure 4.
Simulated species fractions vs. [Cu]free curves defined by the parameters resolved from the step-wise cooperative binding model (a) and a non-cooperative binding model (b) in which k=0.44 × 10¹⁸ M−1 (the fitted value from Ki (initial) of 1×10¹⁸ M−1 (see Table S1) (c) Cu-binding isotherms for the step-wise cooperative (dashed line; measured) and non-cooperative (solid line) binding models.
The advantage of this approach for quantifying ligand binding cooperativities, subject of course to the proposal that gas-phase species fractions mirror those found in solution, is further illustrated by comparing simulated Cu(I) binding curves obtained in a standard chelator competition assay using bathocuproine disulfonate (BCS) (log β2Cu = 19.8[23]) and described by the resolved cooperative vs. noncooperative binding parameters derived above (Figure 3). When these simulated curves are superimposed on published data for B. subtilis CsoR[22] (Figure S3), binding parameters derived from the noncooperative binding model (K≥1019 M−1) can not be easily distinguished from those derived from the cooperative binding model developed above at all K=K1≥1017 M−1 (Figure S3). Clearly, resolution of CsoR species fractions using the MS-based method outlined here is far superior to existing Cu(I)-binding chelator competition methods,[24] particularly in cases where distinct step-wise cooperativities (ωi) are superimposed on large intrinsic ligand affinities (Ki) (Figure 1c).
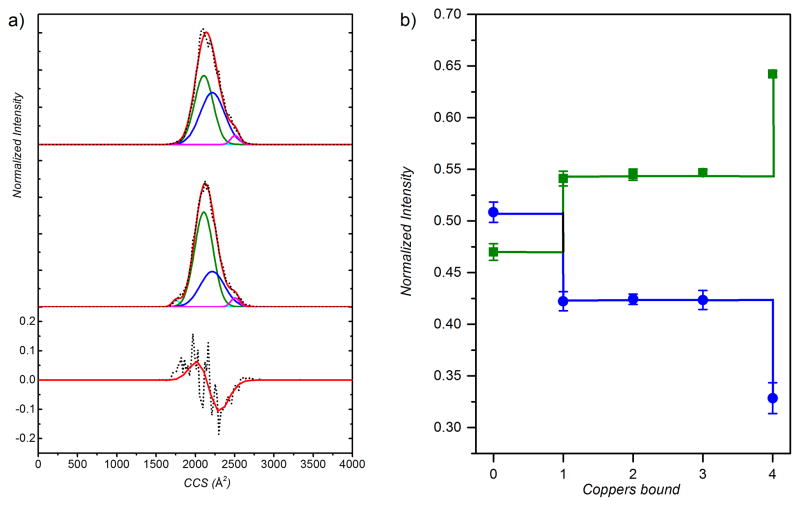
We next investigated how these distinct cooperativities influence the structure and stability of the tetramer. Ion mobility spectrometry (IMS) allows for the assessment of gas phase conformational ensemble, which in many cases appears to be representative of the solution structural ensemble.[16,25–31] Examination of the mobility distributions for the apo (Figure 5a, top) and holo (Figure 5a, middle) CsoRs show two similarly broad distributions, with clearly distinguishable peak centers of 2253 Å2 for apo–tetramer and 2231 Å2 for holo–tetramer (Figure 5a, bottom), given a peak center RMSD of 15.2 Å2 (Figure S4), a finding inherent in the raw data and independent of the number of Gaussians used to fit these mobility distributions (Figure S5a). Although this trend in collisional cross-section is consistent with previous data revealing a hydrodynamically more compact holo species,[16] the breadth of the IMS peaks suggests that multiple conformations are present. We therefore modeled these distributions for all five states (apo, Cu1-Cu4) with a set of four Gaussian functions (two major; two minor) (Figure 5a), since fitting to fewer Gaussians gives rise to statistically inferior fits (Figure S5b) (see Supporting Information).[40] Although the two minor distributions (≤3% of the total) do not change as a function of ligation state (Figure 5a), the relative abundance of the two major conformations at 2107 Å2 and 2216 Å2 change dramatically as a function of Cu ligation state (Figure 5b). These results show that the conformational ensemble becomes hydrodynamically smaller upon binding a single Cu(I), and does not vary greatly with the binding of the second and third Cu(I) ions to the tetramer. However, binding of the fourth Cu(I) induces a second shift to an even more structurally compact ensemble (Figure 5b). Previous studies on ubiquitin using both overtone mobility spectroscopy and IMS-IMS show that normally unresolved structures could be isolated and observed using this method.[32–33] This is consistent with the idea that each ligation state of CsoR may represent an interconverting ensemble of apo- and holo-like “end” state structures, leading to broader-than-expected distributions. The origin of the Cu-dependent compaction is unknown, but previous solution studies of a related thermophilic CsoR suggests that this derives from kinking of the α2 helix, repacking of the tetramer interface, and folding of the N-terminal tail over the bound Cu (cf. Figure 1a).[16] Remarkably, these changes in cross-section precisely mirror with the relative degrees of cooperativity upon filling the tetramer: the site-cooperativity is nearly independent of ligation state in transiting from the i=1 to i=2 and i=2 to i=3 states, but increases significantly in going from the i=3 to i=4 holo states.
Figure 5.
Cross-section mobility distributions (a) for apo (top) and holo (middle) CsoRs, with the difference plots (holo – apo) of the raw data (black) and Gaussian-fitted model (red) shown (bottom panel). Major conformations are colored as green (2107 Å2) and blue (2216 Å2), while minor conformers are colored cyan (1755 Å2) and magenta (2505 Å2). Gaussian global fits superimposed on the data (black) are indicated by the red line. (b) The normalized integrated intensities for the two major conformers as a function of Cu-ligation state.
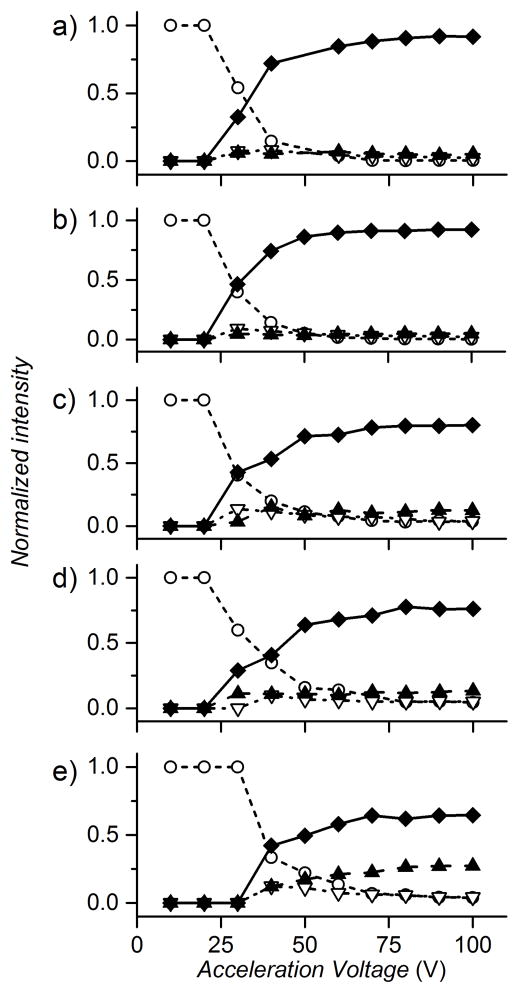
Finally, we exploited our ability to resolve differentially ith ligated states of CsoR and determined their stabilities in the gas phase, as measured by the fragmentation of each tetramer through surface induced dissociation (SID) at 40V acceleration voltage (Figure S6, 13+ charge state). As more Cu(I) is bound, the precursor increases in relative abundance in the fragmentation spectrum, with the converse is true in the monomer fragmentation region. A scan from 10 to 100V acceleration voltage reveals clearly that the fragmentation pathway differs markedly as a function of Cu(I) loading (Figure 6). Apo–CsoR and all other substoichiometric Cu(I)-CsoR tetramer complexes (Figures 6a–d) are completely fragmented by 70V acceleration voltage, cleaving into predominately monomer as the acceleration voltage increases. In contrast, holo–tetramer begins to fragment at higher voltages but most striking is the differential dimer formation during fragmentation of the apo- vs. Cu-loaded tetramer (Figure 6e). In fact, dimer fragments increase in intensity for the holo–tetramer with increased acceleration voltage, accounting for 27% of fragments at 100V.
Figure 6.
Fractional abundance of precursor and fragment peaks produced by SID as a function of acceleration voltage for apo (a), Cu1 (b), Cu2 (c), Cu3 (d) and holo Cu4 (e) CsoR species. The normalized fractional intensities of each fragment species are shown at each acceleration voltage. Tetramer, open circle trace, trimer fragment, open upside down triangle trace; dimer fragment, triangle trace, and monomer fragment, diamond trace.
These data suggest that the dimer is an intermediate in the fragmentation of the Cu-loaded CsoR tetramer to monomer, a finding that likely derives from the full complement of Cu(I) coordination bonds within each dimer of the Cu4 tetramer (cf. Figure 1b), thus biasing the SID-induced fragmentation pathway by inducing dissociating at the dimer-dimer interface. Further, the persistence of the dimer with increasing acceleration voltages suggests that positively cooperative binding of Cu(I), most notable for the fourth Cu-binding step, strongly stabilizes both the n=2 and holo forms of the tetramer. This finding is unanticipated from fragmentation patterns of D2-symmetric tetramers predicted by Proteins, Interfaces, Structures and Assemblies (PISA) analysis and SID,[34] but is likely a consequence of very strong, subunit bridging, coordinate covalent Cu(I)-S bonds.
In summary, we have developed a general MS-based framework to extract and quantify ligation state-resolved homotropic cooperativities in an oligomeric metal-binding protein, and use IMS and SID fragmentation to examine the step-wise impact of metal binding on the structure and stability of the partially ligated states. This method is dependent on transition metal (Cu, Zn, Cd) complexes that are not disrupted by the electrospray ionization source.[21,35–36] We find that the binding Cu(I) to CsoR is characterized by a distribution of ligation state-dependent cooperativities, with the final Cu-binding event biasing the conformational ensemble toward a more highly compact and more stable structure. This degree of cooperativity has the effect of moving the biological response to lower free Cu(I) and making the response more “all-or none”, as is often desired for a molecular switch. Current efforts are directed toward extending this method to other metallosensors and exploring the role of the DNA operator in these coupled equilibria.
Supplementary Material
Footnotes
This research was supported by the NIH (grant R01 GM042569 to D.P.G.).
Supporting Information for this article, including a complete description of the experimental procedures, is available on the WWW under http://dx.doi.org/10.1002/anie.2015xxxxx
Working Together: The step-wise cooperativities of Cu binding to the homotetrameric copper sensitive operon repressor were resolved by mass spectrometry, with the extent of cooperativity related to gas phase properties. The gas phase holo (Cu4) structure was found to favor a more compact state, and was markedly more resistant to fragmentation than apo- or partially Cu-ligated species.
Contributor Information
Alexander D. Jacobs, Department of Chemistry, Indiana University, Bloomington, Indiana 47405-7102 (USA)
Dr. Feng-Ming James Chang, Department of Chemistry, Indiana University, Bloomington, Indiana 47405-7102 (USA)
Dr. Lindsay Morrison, Department of Chemistry and Biochemistry, The Ohio State University, Columbus, Ohio 43210 (USA)
Dr. Jonathan M. Dilger, Department of Chemistry, Indiana University, Bloomington, Indiana 47405-7102 (USA)
Prof. Vicki H. Wysocki, Department of Chemistry and Biochemistry, The Ohio State University, Columbus, Ohio 43210 (USA)
Prof. David E. Clemmer, Department of Chemistry, Indiana University, Bloomington, Indiana 47405-7102 (USA)
Prof. David P. Giedroc, Email: giedroc@indiana.edu, Department of Chemistry, Indiana University, Bloomington, Indiana 47405-7102 (USA)
References
- 1.Motlagh HN, Wrabl JO, Li J, Hilser VJ. Nature. 2014;508:331–339. doi: 10.1038/nature13001. [DOI] [PMC free article] [PubMed] [Google Scholar]
- 2.Tzeng SR, Kalodimos CG. Nat Chem Biol. 2013;9:462–465. doi: 10.1038/nchembio.1250. [DOI] [PubMed] [Google Scholar]
- 3.Campanello GC, Ma Z, Grossoehme NE, Guerra AJ, Ward BP, Dimarchi RD, Ye Y, Dann CE, 3rd, Giedroc DP. J Mol Biol. 2013;425:1143–1157. doi: 10.1016/j.jmb.2013.01.018. [DOI] [PMC free article] [PubMed] [Google Scholar]
- 4.Reyes-Caballero H, Campanello GC, Giedroc DP. Biophys Chem. 2011;156:103–114. doi: 10.1016/j.bpc.2011.03.010. [DOI] [PMC free article] [PubMed] [Google Scholar]
- 5.Grossoehme NE, Giedroc DP. J Am Chem Soc. 2009;131:17860–17870. doi: 10.1021/ja906131b. [DOI] [PMC free article] [PubMed] [Google Scholar]
- 6.Liu T, Ramesh A, Ma Z, Ward SK, Zhang L, George GN, Talaat AM, Sacchettini JC, Giedroc DP. Nat Chem Biol. 2007;3:60–68. doi: 10.1038/nchembio844. [DOI] [PubMed] [Google Scholar]
- 7.Higgins KA, Giedroc D. Chem Lett. 2014;43:20–25. doi: 10.1246/cl.130965. [DOI] [PMC free article] [PubMed] [Google Scholar]
- 8.Chang FM, Lauber MA, Running WE, Reilly JP, Giedroc DP. Anal Chem. 2011;83:9092–9099. doi: 10.1021/ac202154r. [DOI] [PMC free article] [PubMed] [Google Scholar]
- 9.Tan BG, Vijgenboom E, Worrall JA. Nucleic Acids Res. 2014;42:1326–1340. doi: 10.1093/nar/gkt902. [DOI] [PMC free article] [PubMed] [Google Scholar]
- 10.Chang FM, Martin JE, Giedroc DP. Biochemistry. 2015;54:2463–2472. doi: 10.1021/acs.biochem.5b00154. [DOI] [PubMed] [Google Scholar]
- 11.Rae TD, Schmidt PJ, Pufahl RA, Culotta VC, O’Halloran TV. Science. 1999;284:805–808. doi: 10.1126/science.284.5415.805. [DOI] [PubMed] [Google Scholar]
- 12.Macomber L, Imlay JA. Proc Natl Acad Sci U S A. 2009;106:8344–8349. doi: 10.1073/pnas.0812808106. [DOI] [PMC free article] [PubMed] [Google Scholar]
- 13.Samanovic MI, Ding C, Thiele DJ, Darwin KH. Cell Host Microbe. 2012;11:106–115. doi: 10.1016/j.chom.2012.01.009. [DOI] [PMC free article] [PubMed] [Google Scholar]
- 14.Fu Y, Chang FM, Giedroc DP. Acc Chem Res. 2014;47:3605–3613. doi: 10.1021/ar500300n. [DOI] [PMC free article] [PubMed] [Google Scholar]
- 15.Dwarakanath S, Chaplin AK, Hough MA, Rigali S, Vijgenboom E, Worrall JA. J Biol Chem. 2012;287:17833–17847. doi: 10.1074/jbc.M112.352740. [DOI] [PMC free article] [PubMed] [Google Scholar]
- 16.Chang FM, Coyne HJ, Ramirez CA, Fleischmann PV, Fang X, Ma Z, Ma D, Helmann JD, Garcia-de Los Santos A, Wang YX, Dann CE, 3rd, Giedroc DP. J Biol Chem. 2014;289:19204–19217. doi: 10.1074/jbc.M114.556704. [DOI] [PMC free article] [PubMed] [Google Scholar]
- 17.Cubrilovic D, Haap W, Barylyuk K, Ruf A, Badertscher M, Gubler M, Tetaz T, Joseph C, Benz Jr, Zenobi R. ACS Chem Biol. 2013;9:218–226. doi: 10.1021/cb4007002. [DOI] [PubMed] [Google Scholar]
- 18.Chazin W, Veenstra TD. Rap Commun Mass Spectrom. 1999;13:548–555. doi: 10.1002/(SICI)1097-0231(19990330)13:6<548::AID-RCM523>3.0.CO;2-U. [DOI] [PubMed] [Google Scholar]
- 19.Hu P, Loo JA. J Mass Spectrom. 1995;30:1076–1082. [Google Scholar]
- 20.Nemirovskiy O, Giblin DE, Gross ML. J Am Soc Mass Spectrom. 1999;10:711–718. doi: 10.1016/S1044-0305(99)00036-7. [DOI] [PubMed] [Google Scholar]
- 21.Sutherland DE, Summers KL, Stillman MJ. Biochem Biophys Res Commun. 2012;426:601–607. doi: 10.1016/j.bbrc.2012.08.136. [DOI] [PubMed] [Google Scholar]
- 22.Ma Z, Cowart DM, Scott RA, Giedroc DP. Biochemistry. 2009;48:3325–3334. doi: 10.1021/bi900115w. [DOI] [PMC free article] [PubMed] [Google Scholar]
- 23.Xiao Z, Brose J, Schimo S, Ackland SM, La Fontaine S, Wedd AG. J Biol Chem. 2011;286:11047–11055. doi: 10.1074/jbc.M110.213074. [DOI] [PMC free article] [PubMed] [Google Scholar]
- 24.Ma Z, Cowart DM, Ward BP, Arnold RJ, DiMarchi RD, Zhang L, George GN, Scott RA, Giedroc DP. J Am Chem Soc. 2009;131:18044–18045. doi: 10.1021/ja908372b. [DOI] [PMC free article] [PubMed] [Google Scholar]
- 25.Baumketner A, Bernstein SL, Wyttenbach T, Bitan G, Teplow DB, Bowers MT, Shea JE. Protein Sci. 2006;15:420–428. doi: 10.1110/ps.051762406. [DOI] [PMC free article] [PubMed] [Google Scholar]
- 26.Ganem B, Li YT, Henion JD. Tetrahedron Lett. 1993;34:1445–1448. [Google Scholar]
- 27.Patriksson A, Marklund E, van der Spoel D. Biochemistry. 2007;46:933–945. doi: 10.1021/bi061182y. [DOI] [PubMed] [Google Scholar]
- 28.Pierson NA, Chen L, Valentine SJ, Russell DH, Clemmer DE. J Am Chem Soc. 2011;133:13810–13813. doi: 10.1021/ja203895j. [DOI] [PMC free article] [PubMed] [Google Scholar]
- 29.Ruotolo BT, Robinson CV. Curr Opin Chem Biol. 2006;10:402–408. doi: 10.1016/j.cbpa.2006.08.020. [DOI] [PubMed] [Google Scholar]
- 30.Shi H, Pierson NA, Valentine SJ, Clemmer DE. J Phys Chem B. 2012;116:3344–3352. doi: 10.1021/jp210797x. [DOI] [PMC free article] [PubMed] [Google Scholar]
- 31.Shi L, Holliday AE, Shi H, Zhu F, Ewing MA, Russell DH, Clemmer DE. J Am Chem Soc. 2014;136:12702–12711. doi: 10.1021/ja505899g. [DOI] [PubMed] [Google Scholar]
- 32.Lee S, Ewing MA, Nachtigall FM, Kurulugama RT, Valentine SJ, Clemmer DE. J Phys Chem B. 2010;114:12406–12415. doi: 10.1021/jp1060123. [DOI] [PMC free article] [PubMed] [Google Scholar]
- 33.Shi H, Atlasevich N, Merenbloom S, Clemmer D. J Am Soc Mass Spectrom. 2014;25:2000–2008. doi: 10.1007/s13361-014-0834-y. [DOI] [PMC free article] [PubMed] [Google Scholar]
- 34.Quintyn Royston S, Yan J, Wysocki Vicki H. Chem Biol. 2015;22:583–592. doi: 10.1016/j.chembiol.2015.03.019. [DOI] [PubMed] [Google Scholar]
- 35.Banci L, Bertini I, Ciofi-Baffoni S, Kozyreva T, Zovo K, Palumaa P. Nature. 2010;465:645–648. doi: 10.1038/nature09018. [DOI] [PubMed] [Google Scholar]
- 36.Summers KL, Sutherland DE, Stillman MJ. Biochemistry. 2013;52:2461–2471. doi: 10.1021/bi400021b. [DOI] [PubMed] [Google Scholar]
Associated Data
This section collects any data citations, data availability statements, or supplementary materials included in this article.


