Figure 13.
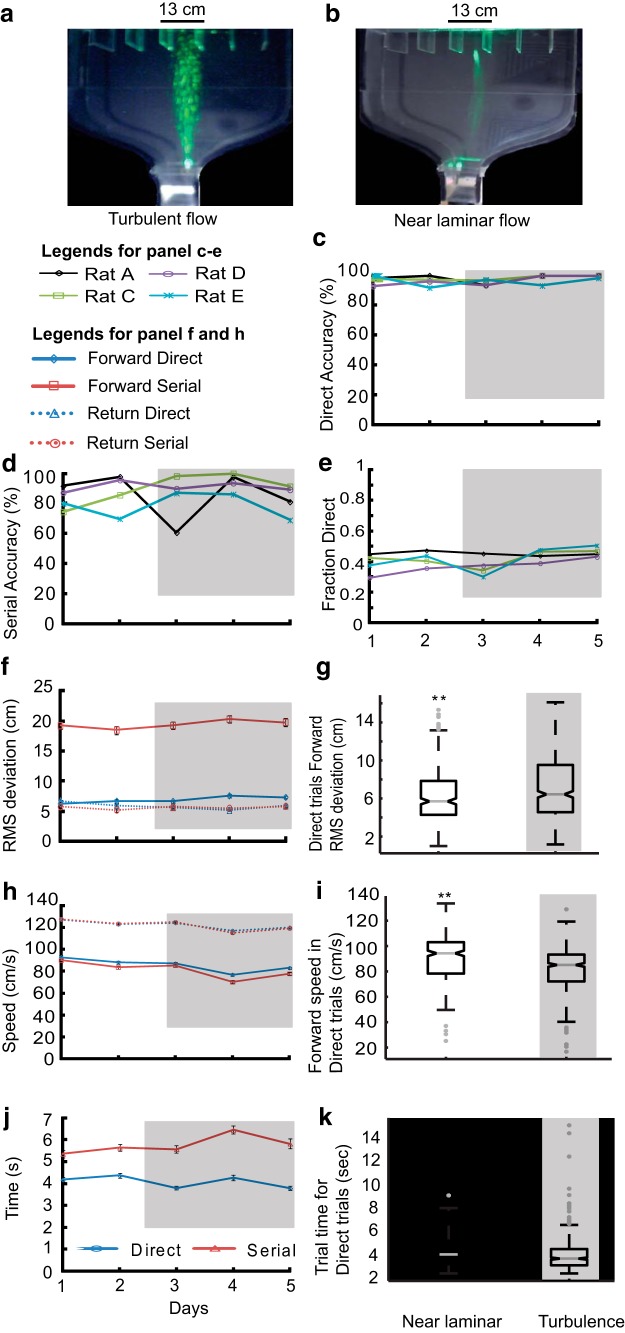
Increased turbulence does not affect tracking accuracy. a, Image of box showing turbulent and (b) laminar flows, using smoke plumes illuminated by a laser light sheet with the source near the holding chamber. c–k, Gray shaded areas indicate days when turbulence was introduced. c, Accuracy of Direct trials and (d) serial trials. e, Fraction of direct trials out of total trials. f, Averaged RMS deviation for all rats. g, Whisker bar plot of average speed for direct trials in forward direction for days with and without turbulence (Nd laminar = 325, Nd turbulence = 522). The RMS values are significantly different from each other (**p < 10−3, KW Tukey HSD test). h, Forward and return speeds for direct and serial trials averaged across all rats. i, Whisker bar plot of mean speeds for days with near laminar and increased turbulence. Speed was significantly lower for turbulent days (**p < 10−14, KW Tukey HSD test). j, Trial time averaged across all rats for direct and serial trials k, Whisker bar plot of average trial time for direct trials during near laminar and turbulent airflow. Trial time values are significantly different from each other (**p = 10−3, KW Tukey HSD test). Error bars for all line plots represent the SEM values.

