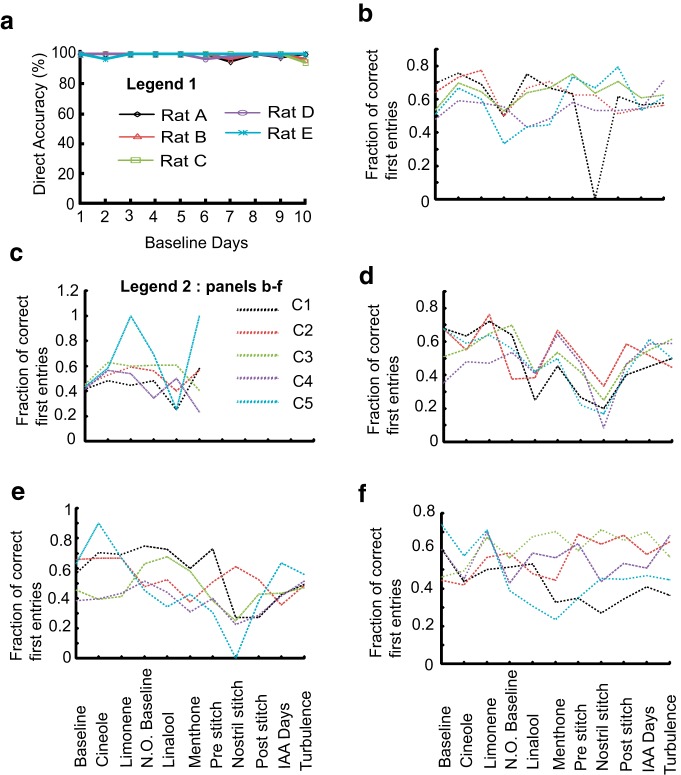
Figure 16.
Fraction Direct performance. a, Accuracy of direct trials over 10 d of baseline training for all five rats (Legend 1). b–f, Data for all experiment subsets, ie, [baseline–novel odors (Cineole, Limonene)–novel background odor (Linalool, menthone)–pre-stitch–Stitch–post-stitch–IAA background–turbulence] from five rats are shown from b onward. Each compartment is a color-coded dashed line (Legend 2). The plots show fraction from total entries into a given compartment when that compartment was the odor port, ie, fraction = number of first entries in that compartment when odor was on/total number of first entries in that compartment

