

Abstract
Categorizing human diseases provides higher efficiency and accuracy for disease diagnosis, prognosis, and treatment. Disease–disease association (DDA) is a precious information that indicates the large-scale structure of complex relationships of diseases. However, the number of known and reliable associations is very small. Therefore, identification of DDAs is a challenging task in systems biology and medicine. Here, we developed a novel network-based scoring algorithm called DDA to identify the relationships between diseases in a large-scale study. Our method is developed based on a random walk prioritization in a protein–protein interaction network. This approach considers not only whether two diseases directly share associated genes but also the statistical relationships between two different diseases using known disease-related genes. Predicted associations were validated by known DDAs from a database and literature supports. The method yielded a good performance with an area under the curve of 71% and outperformed other standard association indices. Furthermore, novel DDAs and relationships among diseases from the clusters analysis were reported. This method is efficient to identify disease–disease relationships on an interaction network and can also be generalized to other association studies to further enhance knowledge in medical studies.
Keywords: disease-disease association, network-based method, prioritization technique, scoring method
Introduction
It is a challenge for modern medicine to categorize human diseases based on pathological, etiological, epidemiological, and clinical approaches. Exploring novel associations of diseases enhances knowledge of disease relationships, which could further improve approaches to disease diagnosis, prognosis, and treatment. During the past decade, the growing number of diverse biological data has provided the opportunity to engage in various studies in systems biology. However, the number of known and reliable disease associations is relatively small because the heterogeneous data do not contribute sufficiently to finding such associations. To develop methods for the association predictions, data at the molecular level are required.
Disease–gene association is one of the forms of biological data that is largely used for inferring associations between diseases. The connections could be inferred from associated gene variants to disease,1,2 biological pathways,3 gene expression data,4 biomedical ontologies,5 or text mining.6 One of the knowledge databases that provides reliable disease–gene association is the Online Mendelian Inheritance in Man (OMIM).7 A number of studies have used these data in their research. The study by van Driel et al illustrates the way to compute similarities among over 5,000 phenotypes in OMIM using a text mining approach. They found a positive correlation of the similarity between phenotypes and a number of measures of gene function, such as protein sequence similarity, protein–protein interactions, protein motifs, and functional annotation.8 Moreover, they predicted candidate associated genes for several diseases. Lage et al used candidate proteins to construct candidate protein complexes for prioritizing disease genes.9 Their similarity scores were calculated based on phenotypes from OMIM to weigh candidate proteins in the protein complexes that linked to human diseases. Based on network analysis, various applications have been developed to provide new insights into disease associations. Goh et al used disease–gene associations to construct a human disease network by making a connection between diseases that share at least one disease-causing gene.10 The network topology of disease genes was observed in human interactome and novel cancer-related genes were found. Lee et al constructed a disease network based on metabolic processes, whereby two diseases are linked if their mutated enzymes catalyze adjacent metabolic reactions.11 They showed that the predicted links among diseases are frequently found in patients. Furthermore, the patients diagnosed with a hub disease in the disease network are likely to develop the other connected diseases. Janjic and Przulj detected a core subnetwork from a large amount of human protein–protein interaction data and proposed that its topology is the key to disease formation.12 They show that the core disease network is enriched in disease genes. Suratanee and Plaimas used a network search algorithm for finding novel proteins associated with inflammatory bowel disease in a protein–protein interaction network.13 They took the disease–gene association from genome-wide association studies. In addition, they showed that their predicted results enriched in the functional pathways of the disease. Zitnik et al found disease–disease associations (DDAs) based on the evidence from fusing all available molecular interaction and ontology data.14 The fusion was performed by a matrix factorization approach. They found new DDAs that are not present in the disease ontology. Sun et al compared four publicly available disease–gene association datasets and measured the similarities of the diseases.15 Their similarity scores are calculated on annotation-based, function-based, and topology-based measures. They demonstrated a strong correlation of their prediction results and disease associations generated from genome-wide association studies.
These aforementioned studies provide various new insights into disease association studies. However, there are certain limitations because most of the studies focused on specific diseases. In addition, combining the heterogeneous data from different data sources is meaningful as it is hard to manipulate reasonably. Nevertheless, it is possible that some of them are generated computationally. This may lead to many false positives, which are normally introduced in noisy and incomplete data. To avoid these issues, we focused only on reliable data sources of Mendelian disorders by OMIM. OMIM is known as the best-curated resource of known phenotype–genotype associations. Even most diseases in OMIM are annotated with a few genes; these genes are indicated as being related to the diseases. In this study, we aim to find relationships between diseases based on phenotype–genotype data integrated with large-scale protein–protein interaction data. With these resources, network-based prioritization techniques were used to rank diseases. After that, investigating other disease genes in the ranking results can infer relationships between pairs of diseases. The approach not only considers whether two diseases directly share associated genes but also applies a statistical measure to determine the relationships between two sets of known disease-related genes from two different diseases. The DDA score was used to quantify the degree of association between two different diseases. The results were compared both with an available benchmark of DDAs and standard association measurement. The robustness of the approach to the network was investigated. Later, the prediction results were examined by mining the literature in PubMed. Clusters of disease associations and the list of disease pairs with scores and evidence were reported.
Data and Methods
Phenotype–genotype associations and network
Information of genetic heterogeneity of similar phenotypes across the genome could be retrieved from OMIM phenotypic series,16 which is a term representing a group of disorders having similar phenotypes. For each series, we could obtain a set of corresponding disease–gene family for a well-defined Mendelian phenotype. Therefore, a list of genetic disorders with phenotypic series in human beings were taken from the OMIM (version downloaded on January 2015).7 Each disorder consists of genetic heterogeneity of similar phenotypes. We selected phenotype series that have corresponding genes not less than five to obtain enough known phenotypic genes of each phenotype. In addition, these genes would have their corresponding proteins appeared in the STRING database version 9.05.17 Totally we yielded 126 phenotype series as shown in Supplementary Table 1. The analyzed PPI network consists of 17,587 proteins with 406,264 interactions. Proteins in the network were labeled as disease’s seed nodes using information of disease genes retrieved from OMIM. To our knowledge, it is rare to find a standard database of DDA. One of the useful databases is PhenUMA (www.phenuma. uma.es).18 PhenUMA is a great tool to identify pathological relationships based on functional and phenotypic. With this PhenUMA database, a list of DDAs with their OMIM ids were obtained and used for evaluating our DDAs.
DDA measurement
Our approach was designed to find relationships between two different diseases. The basis hypothesis of this study is that if two diseases are related, two known disease gene sets associated with these two related diseases should be close to each other in the protein or gene network. Therefore, the positions of these genes associated with these two diseases were statistically investigated in the sense that they should be in the top ranks of each other after ranking by weighting with the most important genes of each disease. In this study, genes associated with a disease are mapped to their products in the protein–protein interaction network. The disease-translated proteins were assigned as seeds for a ranking algorithm. We employed an efficient ranking method, namely, random walk with restart (RWR), to prioritize genes using known disease genes as seeds. Translated proteins associated with a disease should be in the top positions in the ranked list.
We defined a DDA score that quantifies the association strength between two different diseases. This score was calculated based on the RWR prioritization method. Considering a phenotype with a set of associated genes, we used these genes as seeds for the prioritization method and then performed the ranking algorithm. This process was performed for all diseases. To find the relationships between two diseases, we simply investigated the seed gene positions of a disease in a ranked gene list of other diseases. If the gene sets of two diseases are in the top ranking area of each other, we obtained a high relationship score for these two diseases. The formulation of DDA calculation can be defined as follows.
Let ranki(k) be a rank of gene k in the rank list with genes associated with disease Di as seeds for RWR prioritization, and ci(k) be a chance of gene k likely associated with disease Di, which can be defined as
| (1) |
where NG is the total number of disease genes in the network. Therefore, the DDA score can be computed as
| (2) |
Where is the median value of ci(kj) for all kj, which are genes associated with the disease Dj, and is a median value of cj(ki) for all ki, which are genes associated with the disease Di. The range of DDA score is between 0 and 1. The algorithm to compute the DDA score is illustrated as follows, where Rank_i means the list of ranks of all genes in the network when using genes associated with Di as seeds for the random walk prioritization method. The algorithm was implemented as a software package for R (www.r-project.org, R version 3.1.2 or higher) which runs on a Linux machine. It is freely available at http://www.ma.kmutnb.ac.th/software/DDA.php.
Algorithm: DDA score calculation
| Input: | PPInetwork:= A protein-protein interaction network |
| GeneOf(Disease):= A set of disease-associated genes | |
| SetOfDiseases:= A set of diseases | |
| Output: | DDAscore:= A disease-disease association scores for all disease pairs |
| Procedure: Prioritize(Network, seeds) | |
| START | |
| For Each disease pair(Di, Dj) | |
| //Prioritizing genes in a network using genes associated with Di as seeds | |
| Rank_i:= Prioritize(PPInetwork, GeneOf(Di)) | |
| //Prioritizing genes in a network using genes associated with Dj as seeds | |
| Rank_j:= Prioritize(PPInetwork, GeneOf(Dj)) | |
| //Calculating DDA scores | |
| Totalgenes:= getNumberOfGenes(PPInetwork) DDAscore(Di,Dj):= | |
| End For Each | |
| Return DDAscore | |
| END | |
Example of a disease network with three groups of diseases and the DDA score is shown in Figure 1. In the left panel of Figure 1, a small network sample consists of 100 genes and 120 interactions. The DDA scores of disease relationships are demonstrated in the right panel of Figure 1. The example network consisted of the disease genes of three diseases (D1, D2, and D3). We assume that disease D1 has eight associated genes in red (Fig. 1), disease D2 has nine associated genes in green, and disease D3 has seven associated genes in blue. Based on the interaction network, RWR ranks the order of closely connected nodes with each set of associated genes as seeds. Next, using these ranks, the DDA scores for D1 and D2 are calculated, yielding a high DDA score of 0.75, as the seed genes between two diseases are close and located in the same neighborhood. In the same manner of calculation, we yield very low association scores for D2 and D3, as well as for D1 and D3 (0.10 and 0.06, respectively, according to the closeness of seed genes between two diseases). These show that the DDA scores can represent the probability of the chance that two diseases are related based on the interaction network.
Figure 1.

Network example of DDA score calculation.
Notes: The left panel shows a simulated network in which nodes represent genes and edges represent interactions. The network consists of the disease genes of three diseases, D1, D2, and D3. Red, green, and blue nodes represent the diseases D1, D2, and D3, respectively. The DDA scores of the relationships between D1–D2, D1–D3, and D2–D3 are presented in the right panel.
Random walk prioritization method
We incorporated a standard prioritization method called RWR19 into our algorithm. The method is widely used for ranking genes with specific conditions in several studies. RWR simulated a walker moving from seed genes to random neighbor genes or moving back to seed genes with a probability (γ). It can be given by
| (3) |
where P0 is the initial probability vector. P0 is a vector that all elements are zero, except elements corresponding to the target disease genes were set as 1. Pt is a probability vector in which the ith element is the probability of visits to gene i at step t. γ is the restart probability. In this study, we expected that a walker of the RWR is able to move far from disease’s seed genes but not too far from them. A numerical experiment with different values of γ was performed to find a suitable value of γ. We found that the performances were not much different with γ ≤ 0.75. However, when we examined the γ’s value at 0.85, 0.95, and 1.0, the performances were declined. Therefore, γ was set to a value of 0.75. M is the transition matrix of the network, where Mij is the transition probability between gene i and gene j. In our application, M is an adjacency matrix using interaction information from our analyzed PPI network. Mij was set to 1 if the interaction between gene i and gene j exists, otherwise, Mij was set to 0. M was normalized using Laplacian normalization.20 The calculation is iterated until it reaches a steady state that, changing between Pt and Pt+1, is below 10−10. The changing can be calculated by L1 norm. At the final step, all genes in the network are ranked by the probability. If the probability of gene i is less than that of gene j, gene i is more proximate to seed genes than gene j.
In addition, we employed other prioritization algorithms, consisting of NetScore,21 Functional Flow (F_Flow),21 and NetRank,21 to compare our method based on RWR. In brief, NetScore exploited a message-passing scheme among nodes in the network to send and convey information to neighbors. This algorithm considers multiple shortest paths that connected seeds. F_Flow is based on the idea of the spreading score in the network. The score is propagated from higher score nodes to lower score nodes through edges at each iteration with the amount of edge capacity. NetRank is based on PageRank with Priors.22 The idea of this algorithm mimics the random surfer model. A score is calculated from a proportion of the probability of reaching a node in the web surfing process.
Performance measurement
With DDA scores of all possible relationships and the known association set from PheUMA, a receiver operating characteristic (ROC) curve can be generated. The performance of the algorithm could be measured from the area under the curve (AUC). To avoid bias from highly unbalanced data between known and unknown phenotypic relationships, we employed a bootstrap resampling technique by selecting an equal number of relationships between these two groups and measuring the performance. This process was repeated 100 times. The overall performance could be measured by the mean value of these performances.
Association indices
We employed several association indices23 for measuring the proportion of overlap of genes between two different diseases (Di and Dj). Each disease consists of a set of genes. We defined N(Di) and N(Dj) as the number of genes in diseases Di and Dj, respectively, |N(Di)∩N(Dj)| is the number of shared genes of diseases Di and Dj, |N(Di)∪N(Dj)| is the total number of genes in diseases Di and Dj, and NG is the total number of genes. The definition of association indices are as follows:
The Jaccard index23 is defined as
| (4) |
The Simpson index23 is defined as
| (5) |
The geometric index23 is defined as
| (6) |
The cosine index23 is defined as
| (7) |
The Pearson correlation coefficient (PCC)23 is defined as
| (8) |
Network clustering
To find clusters (highly connected and dense regions) in our predicted association network, we used MCODE,24 a plugin of Cytoscape.25 MCODE is a clustering algorithm that assigns a weight to each node of the graph. The weight is based on the local neighborhood density of that node. Then, clusters are created around the top-weighted nodes by iteratively adding high-scoring nodes to the cluster. Clusters that are not sufficiently dense are eliminated from the final set of partitions.26 We used a default node cutoff value of 0.2, a K-core value of 2 and the Haircut algorithm. The score was computed from the subgraph density multiplied by the number of nodes in that cluster.
Results
Considering 126 disorders from OMIM that correspond to our criteria (see “Data and methods” section), we computed the DDA scores of each disease pair. The score calculation was performed for all combinations of these diseases. A set of known relationships was taken from PhenUMA to evaluate the DDA score. To evaluate the performance of our established scores, we first examine the distribution of our DDA scores for both the known and unknown association set. This was also performed for the other prioritization techniques to show the performance of RWR in calculating our DDA scores. Second, the comparison of our DDA scores to the other associated indices was estimated. Third, the robustness of the algorithm with respect to the interfered network was performed. Finally, our predictions with regard to the literature and network clustering were examined.
Distributions of the association scores with various prioritizations
DDA scores of known DDAs were defined as known association set, while DDA scores of unknown DDA were defined as unknown association set. These two sets were significantly separated and agreed with a P-value of 2.95E-16 (using a Wilcoxon test). Distributions of these two sets are shown in Figure 2A.
Figure 2.
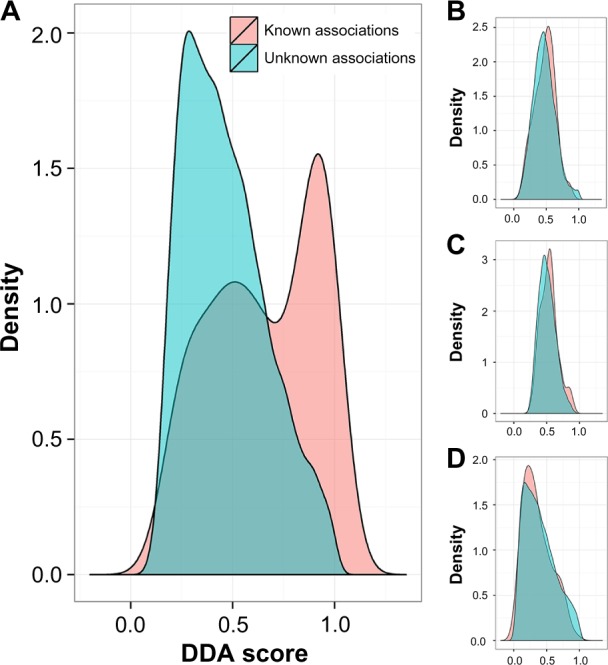
Investigating score distributions between a set of known disease associations and unknown disease associations. Two distributions of scores, between a set of known and a set of unknown disease associations. The scores of our method based on RWR, F_Flow, NetRank and NetScore are shown in the Figures 1(A), (B), (C) and (D), respectively.
Although our DDA score is reasonable in terms of statistics and probability measures, it is also based on the technique for prioritizing associated genes in the network. Therefore, we applied other network-based ranking techniques such as the NetScore, NetRank, and F_Flow algorithms to calculate the scores instead of using RWR. Interestingly, we could not find significant differences in the scores between the two sets. Only the DDA score based on NetRank showed a P-value close to 0.01. The DDA score with the other two techniques yielded P-values higher than 0.1. These P-values are presented in Table 1. The distributions of scores from F_Flow, NetRank, and NetScore of these two sets are shown in Figures 2B–D, respectively.
Table 1.
Performance measurement for identifying disease associations using our methods with different prioritization techniques.
| RWR | NetRank | NetScore | F_Flow | |
|---|---|---|---|---|
| Performance (AUC) | 0.71 | 0.57 | 0.46 | 0.53 |
| P-value | 2.95E–16 | 0.016 | 0.163 | 0.289 |
Performance of predicting DDAs
The performance of predicting a disease phenotypic relationship using a DDA score was measured by generating the ROC curve, which is the curve of recall against the true positive rate. Based on the AUC, we obtained a good performance with an accuracy of 71% (an AUC of 0.71) for separating between sets of known and unknown associations. The complete list of all 7,875 pairs of diseases with the DDA scores is provided in Supplementary Table 2. In addition, we measured performances for separating between known and unknown relationships. The results showed that they are close to random. The DDA score based on NetRank showed superior performance with an AUC of 0.57. Moreover, the DDA score based on F_Flow and NetScore yielded lower performances with AUCs of 0.53 and 0.46, respectively. Questions arise as to whether the interactions predicted from our algorithm are affected by the overlapped genes of two different disorders. This issue was considered by calculating the correlation between the number of overlap genes of disease pairs and the DDA scores based on RWR prioritization. We yielded a very low correlation value of 0.21. Moreover, we employed association indices that could be used to indicate the overlapping of genes between two datasets. The association indices used in this study were the Jaccard, Simpson, Geometric, Cosine, and PCC (see “Data and methods” section for more details). These methods consider different aspects of the intersection numbers of genes between two groups. We performed the index calculation for each pair of diseases and used the index as a score. With PCC, we obtained the best performance with an AUC of 0.62 compared with the other methods. Jaccard, Simpson, Geometric, and Cosine yielded similar results with an AUC of 0.57 (Table 2). However, none of these indices could yield a higher performance than our method. This guarantees that our DDA score with RWR prioritization is the best for ranking related genes and diseases and also the best for identifying DDAs.
Table 2.
Performance measurement for identifying disease association using scores of different association indices.
| JACCARD | SIMPSON | GEOMETRIC | COSINE | PCC | |
|---|---|---|---|---|---|
| Performance (AUC) | 0.5706 | 0.5709 | 0.5695 | 0.5705 | 0.6213 |
The consistency between these indices was investigated by calculating the correlation between them. As expected, high correlations were observed for each pair of these indices (Supplementary Table 3).
Robustness of DDA scores to interfered network
To compare the effect of the quality of network to our method with prioritization, we defined the robustness as investigating changes in the prediction capacity of the DDA scores when the network was perturbed. We randomly swapped the edges in the network in different thresholds. The percentages for swapping the edges were defined as 20%, 40%, 60%, and 80%. The results showed that edge swapping at the 20% criteria did not have an effect on the algorithms. This might be caused by a large number of interactions in the network. Therefore, the performance of the method for 20% edge swapping is quite similar to the performance of the method with the original network. The results were reasonable at 40%, 60%, and 80%, and the performances declined with AUCs of 0.69, 0.68, and 0.64, respectively (Fig. 3A). We also performed this test with a DDA score based on other prioritization methods. Based on NetRank, NetScore, and F_Flow, the performances with different swapping percentages were inferior compared with the performances of the method with RWR. Figure 3A illustrates the performances of the DDA score based on different prioritization methods with different thresholds of edge swapping.
Figure 3.

Performances of our method based on four different prioritization algorithms on an edge swapping network and the node removing network. (A) Edges in the original protein-protein interaction network were swapped with different amounts of edge swappings (20%, 40%, 60%, and 80%). (B) Nodes were removed from the original protein-protein interactions with different amounts of nodes (20%, 40%, 60%, and 80%). The performances of our method based on F_Flow, NetRank, NetScore, and RWR on the interfered networks are shown.
In addition, we removed nodes from the network with different thresholds. Particularly, the removed nodes should not be disease genes. We performed in the same manner as edge swapping by removing nodes with criteria of 20%, 40%, 60%, and 80%. The performances of our method based on RWR decreased with the removal percentages. We yielded AUCs of 0.70, 0.68, 0.65, and 0.60 for node removal of 20%, 40%, 60%, and 80%, respectively. Based on NetRank, NetScore, and F_Flow, we obtained performances close to random. Figure 3B shows the performances of the DDA score based on different prioritization methods with different node removal thresholds.
Examining DDA predictions
To examine the predicted associations, literature searches were performed using two keywords in PubMed. The two keywords were two names of diseases for a disease pair. With this text mining, the numbers of PubMed ids found from the keywords were aggregated and were used to compare between the two groups: (1) the group of disease pairs with our predicted score greater than a selected cutoff score, a high probability value of disease association with our method and (2) the group of disease pairs with a score less than the cutoff score. Our DDA scores reflect how likely two diseases related. A higher score indicates more confidence level of disease relationship. If the cutoff scores were 0.75, 0.85, and 0.95, then the results showed significant difference between these two groups with a P-value of 1.84E-57, 1.24E-57, and 3.12E-78 (one-sided Wilcoxon test), respectively. The former group had a greater number of studies than the latter group with mean values of 7.33 and 0.55 for the cutoff of 0.75, 12.08, and 0.67 for the cutoff of 0.85, 30.87, and 0.82 for the cutoff of 0.95). All of the other cutoff scores were also examined and resulted in the same tendency with significant difference between these two groups. We also compared the number of studies of the two groups of disease pairs that were found and not found in PhenUMA and obtained a fewer significantly different P-value of 1.37E-34 (one-sided Wilcoxon test). The mean values of studies found in the former and latter groups were 15.42 and 1.08, respectively.
Table 3 presents a list of top 20 predicted DDAs, comprises the full names of the phenotypic series of each DDA pair and also their corresponding OMIM ids, and shows whether the association was found in PhenUMA. If the pair was found in the PhenUMA, the value of that association is 1, otherwise, it is 0. In addition, we added the number of studies found in PubMed when we search two disease names as keywords in PubMed. The full list of prediction results are reported in Supplementary Table 2, which also contains PubMed id(s) found for the DDAs.
Table 3.
Predicted disease associations with the number of studies found in PubMed.
| PHENOTYPI C SERIES 1 (PS1) | PHENOTYPIC SERIES 2 (PS2) | OMIM ID CORRESPONDING TO PS1 | OMIM ID CORRESPONDING TO PS2 | DISEASE-DISEASE ASSOCIATION (DDA) SCORE | PheNUMA (1: FOUND, 0: NOT FOUND) | NUMBER OF FOUND STUDIES IN PUBMED |
|---|---|---|---|---|---|---|
| Muscular dystrophy-dystroglycanopathy, type B | Muscular dystrophy-dystroglycanopathy, type C | PS613155 | PS609308 | 0.9995 | 0 | 0 |
| Epilepsy, generalized, with febrile seizures plus | Seizures, familial febrile | PS604233 | PS121210 | 0.9994 | 0 | 136 |
| Muscular dystrophy-dystroglycanopathy, type A | Muscular dystrophy-dystroglycanopathy, type B | PS236670 | PS613155 | 0.9994 | 0 | 0 |
| Muscular dystrophy-dystroglycanopathy, type A | Muscular dystrophy-dystroglycanopathy, type C | PS236670 | PS609308 | 0.9994 | 0 | 1 |
| Mitochondrial DNA depletion syndrome | Progressive external ophthalmoplegia with mtDNA deletions | PS603041 | PS157640 | 0.9992 | 1 | 3 |
| Muscular dystrophy-dystroglycanopathy, type B | Muscular dystrophy, limb-girdle, auto-somal recessive | PS613155 | PS253600 | 0.9988 | 0 | 0 |
| Muscular dystrophy-dystroglycanopathy, type C | Muscular dystrophy, limb-girdle, auto-somal recessive | PS609308 | PS253600 | 0.9987 | 1 | 0 |
| Joubert syndrome | Meckel syndrome | PS213300 | PS249000 | 0.9985 | 0 | 34 |
| Muscular dystrophy-dystroglycanopathy, type A | Muscular dystrophy, limb-girdle, auto-somal recessive | PS236670 | PS253600 | 0.9981 | 0 | 0 |
| Atrial fibrillation, familial | Brugada syndrome | PS608583 | PS601144 | 0.9978 | 1 | 40 |
| Meckel syndrome | Nephronophthisis | PS249000 | PS256100 | 0.9974 | 0 | 21 |
| Maple syrup urine disease | Pyruvate dehydro-genase complex deficiency | PS248600 | PS312170 | 0.9972 | 0 | 1 |
| Cardiomyopathy, familial hypertrophic | Left ventricular noncompaction | PS192600 | PS604169 | 0.9969 | 0 | 13 |
| Epiphyseal dysplasia, multiple | Stickler syndrome | PS132400 | PS108300 | 0.9967 | 0 | 0 |
| Bardet-Biedl syndrome | Meckel syndrome | PS209900 | PS249000 | 0.9966 | 1 | 13 |
| Brugada syndrome | Long QT syndrome | PS601144 | PS192500 | 0.9966 | 1 | 435 |
| Atrial fibrillation, familial | Long QT syndrome | PS608583 | PS192500 | 0.9963 | 1 | 45 |
| Hemolytic uremic syndrome | Macular degeneration, age-related | PS235400 | PS603075 | 0.9961 | 0 | 0 |
| Joubert syndrome | Nephronophthisis | PS213300 | PS256100 | 0.9960 | 0 | 66 |
| Microphthalmia, isolated | Microphthalmia, isolated, with coloboma | PS251600 | PS300345 | 0.9960 | 0 | 19 |
Clusters of the disease association network
We selected DDAs with a high DDA score (>0.95) for constructing a disease network. With this selection, 129 predicted DDAs were investigated. A complete network of these associations is illustrated in Figure 4. With this predicted association network, three interesting clusters were found using MCODE,24 a plugin of Cytoscape25 (see “Data and methods” section for more detail). The MCODE algorithm finds highly interconnected subgroups. Some nodes from the 129 predicted associations could be discarded during the algorithm processes because of their low node scores. Only strong associations were presented in clusters. A cluster with the highest ranking score consisting of 13 nodes and 36 edges is shown in Figure 5 (left panel). The cluster of the second consists of 6 nodes and 14 edges. The third ranking cluster consists of three nodes and three edges (Fig. 5, middle and right panels, respectively). For the highest score cluster, we found a group of muscular disorders, eg, muscular dystrophy, limb-girdle, autosomal dominant (PS159000), and autosomal recessive (PS253600),27 Muscular dystrophy-dystroglycanopathy type B (PS61355) and type C (PS609308), myofibrillar myopathy (PS601419),28 and nemaline myopathy (PS161800).29 In addition, the cluster consists of cardiomyopathies, eg, dilated cardiomyopathy (PS115200)30 and a rare cardiomyopathy disorder, left ventricular noncompaction (PS604169).31 Moreover, a group of heart disorders are also found, namely, atrial fibrillation (PS608583),32 long QT syndrome (PS192500),33 and Brugada syndrome (PS601144).34 This cluster also showed the interactions between these disorders and a group of febrile seizures, such as seizures, familial febrile (PS192500),35 and generalized epilepsy with febrile seizures plus (PS604233).36
Figure 4.

Network of selected predicted disease associations with a high score. Selected 129 predicted disease associations with a score higher than 0.95 were used for constructing a network.
Figure 5.

Clusters from our predicted interaction network. Three highly connected regions computed from MCODE from our predicted disease association network. Clusters from left to right panels in the figure are ranked from high-score to low-score cluster.
Disorders in the second ranking score cluster are mostly ciliopathic human genetic disorders that produced many effects to many parts of the body, including the eyes and kidneys. Bardet–Biedl syndrome (PS209900) and Leber’s congenital amaurosis (PS204000) have major features with vision problems, for example, retinitis pigmentosa.37–39 Joubert syndrome (PS213300) affects the cerebellum and is associated with syndromic retinitis pigmentosa.40 Meckel syndrome (PS249000) has disease features of enlarged kidneys and also causes problems with the development of the eyes, heart, bones, urinary system, and genitalia.41–44
Interestingly, Joubert syndrome was reported in several studies to be related to Meckel syndrome.45,46 For example, some phenotypic features, such as occipital encephalocele and polydactyly, are found in some patients with Joubert syndrome, and these features were also observed in those with Meckel syndrome.47 Karmous-Benailly et al suggested that a genetic interaction between Bardet–Biedl syndrome and Meckel syndrome may exist. Recessive mutations in Bardet–Biedl syndrome-related genes (BBS2, BBS4, and BBS6) were identified in several cases of Meckel syndrome.48 Short-rib thoracic dysplasia (PS208500), a group of autosomal recessive ciliopathies, engenders abnormality in major organs such as the brain, eyes, heart, kidneys, liver, and pancreas.49,50 Nephronophthisis (PS256100) is inherited in an autosomal recessive fashion and is the most frequent genetic cause of end-stage kidney disease in children.45,51 With distinct mutations of identical genes, a continuum for the multiple-organ phenotypic abnormalities was found in Meckel syndrome, Joubert syndrome/CORS, and nephronophthisis.45
The third cluster comprises paragangliomas (PS168000), pyruvate dehydrogenase complex deficiency (PDCD; PS312170), and maple syrup urine disease (MSUD; PS248600). Paragangliomas is a rare tumor related to nervous and endocrine systems. This tumor can develop at various parts of the body, for example, the head, neck, thorax, and abdomen.52 PDCD is a neurodegenerative disorder associated with abnormal mitochondrial metabolism. Patients with PDCD usually have neurological problems that include developmental delay, intermittent ataxia, weak muscle tone, abnormal eye movements, poor coordination, difficulty walking, or seizures.53,54 MSUD is an inherited disorder caused by dysfunctional oxidative decarboxylation of branched-chain alpha-ketoacids. MSUD leads to mental and physical morbidity and may result in death in the neonatal period.55
This evidence demonstrated that the disorders in the clusters were implicated genetically. A complete list of disorders of the clusters with the number of nodes and edges including the OMIM ids of the nodes are shown in Table 4.
Table 4.
Clusters of selected 129 disease associations.
| CLUSTER | SCORE | NUMBER OF NODES | NUMBER OF EDGES | NODE IDS |
|---|---|---|---|---|
| 1 | 6 | 13 | 36 | PS115200, PS613155, PS601419, PS609308, PS604233, PS121210, PS161800, PS253600, PS608583, PS601144, PS192600, PS604169, PS192500 |
| 2 | 5.5 | 6 | 14 | PS213300, PS208500, PS249000, PS209900, PS204000, PS256100 |
| 3 | 3 | 3 | 3 | PS312170, PS168000, PS248600 |
Conclusion and Discussion
We integrate reliable disease–gene associations, protein–protein interaction data, and prioritization approach to identify associations of diseases. The DDA score is defined to represent the relationship between two diseases and is compared with standard association indices. Several ranking techniques, RWR, NetScore, PageRank, and F_Flow, are tested in our algorithm for calculating the DDA score. Because these prioritization techniques are network-based approaches, we tested the robustness of our algorithm. We found that the DDA score based on RWR shows superior performance compared with other ranking techniques. Predicted associations are validated through publicly available DDA databases and text mining studies in PubMed. For the text mining, we could not ensure that the number of found literature from the mining of any two diseases directly indicates the associations between these two diseases. However, we could imply from the text mining that if two diseases are associated, the number of literature in which these two diseases presented should be significantly higher than the number of literature in which the two diseases are not involved as shown with P-values in the analyzed results. Therefore, the results from text mining can be used as evidence for evaluating our predictions. The high-scoring DDAs are used for constructing subnetworks and clusters. The evidence in the literature shows the implications among the disorders in the clusters.
Our network-based scoring approach adopts global analysis strategies based on the relevance of neighboring genes with those of known disease genes. Therefore, the seed genes need to have an accurately identified relevance to those diseases. This is the reason why we choose the OMIM database, which avoids false-positive disease genes. Our method does not measure the disease relationships by considering only the number of sharing genes as is the case with the standard association indices. We statistically infer the relationships by the probabilities of the positions of a set of disease genes in the ranked list of another disease. In DDA score calculation, we use the median instead of the mean because it is more robust to any outlier disease genes from a given disease that might be in low ranking with regard to another disease. This means that if two diseases are associated, it is not necessary that all the disease genes from these two diseases be in the top rank of each other. In addition, our method outperformed the standard association indices as a result of the competency of the network-based method that allows the use of neighborhood gene information to calculate the relationship in the DDA score.
The global ranking methods that model information flow to assess the proximity and connectivity between genes, such as RWR and PageRank with priors, are used in our algorithms. As shown in the results, our method with these ranking approaches performed better than the method based on the localized methods. The localized methods are direct similarity-based methods that count directly interacting genes or compute the shortest paths between genes. This might be caused by the capability of the iterative probabilistic method such as RWR that could produce adaptive neighborhood profiles better than other static methods such as NetScore. Even the PageRank with Priors algorithm is quite similar to RWR, but their edge weight normalizations are different. However, the disadvantage of RWR could not perform well in a large network. Parameter settings are still an important issue because most of the parameters are difficult to assign, for example, the parameter length of the shortest path in NetScore or the number of iterations for converging in most of the methods.
The predicted associations by our method could be from the result of sharing the same disease genes for two different diseases. However, this is not true in every case as we showed by the performances of the association indices, which is the method for calculating sharing genes between two groups. The performances are quite low compared with our method, and we could not find any correlations between DDA scores and association index scores. Moreover, we also evaluated the robustness of our method on the protein–protein interaction network. The performances are not much different with a low threshold for interrupted networks. This might be explained by the high density of human interactions in the network. Swapping interactions or deleting genes in small amounts do not have a noticeable effect on our algorithms.
In conclusion, understanding the relationship between diseases helps us to gain insight into disease etiology and discover common pathophysiology. It can be applied for treatment suggestion that might be suitable from one disease to another disease. Inferring DDAs in this study is simple and straightforward. Our analysis proposed novel associations of diseases that could be used as information for further validation in experiments. These novel disease associations can also be used to further study large scales of comorbidity. Moreover, this study provides the opportunity to enhance disease classifications that lead to an improvement of disease diagnosis and prognosis.
Supplementary Materials
Supplementary Table 1. The list of 126 phenotypic series.
Supplementary Table 2. The complete list of all 7,875 pairs of diseases with the DDA scores and literature evidence.
Supplementary Table 3. The correlation between association indices of all 7,875 pairs of diseases.
Acknowledgments
We thank the peer reviewers for their helpful comments that have improved our manuscript.
Footnotes
ACADEMIC EDITOR: Thomas Dandekar, Associate Editor
PEER REVIEW: Two peer reviewers contributed to the peer review report. Reviewers’ reports totaled 845 words, excluding any confidential comments to the academic editor.
FUNDING: This work was supported under Grant No. KMUTNB-GEN-58-14 from King Mongkut’s University of Technology North Bangkok, Thailand. The authors confirm that the funder had no influence over the study design, content of the article, or selection of this journal.
COMPETING INTERESTS: Authors disclose no potential conflicts of interest.
Paper subject to independent expert blind peer review. All editorial decisions made by independent academic editor. Upon submission manuscript was subject to anti-plagiarism scanning. Prior to publication all authors have given signed confirmation of agreement to article publication and compliance with all applicable ethical and legal requirements, including the accuracy of author and contributor information, disclosure of competing interests and funding sources, compliance with ethical requirements relating to human and animal study participants, and compliance with any copyright requirements of third parties. This journal is a member of the Committee on Publication Ethics (COPE).
Author Contributions
Conceived and designed the experiments: AS. Analyzed the data: AS. Wrote the first draft of the manuscript: AS. Contributed to the writing of the manuscript: AS, KP. Agreed with manuscript results and conclusions: AS, KP. Jointly developed the structure and arguments for the paper: AS, KP. Made critical revisions and approved the final version: AS, KP. Both the authors reviewed and approved the final manuscript.
REFERENCES
- 1.Collins FS, Guyer MS, Charkravarti A. Variations on a theme: cataloging human DNA sequence variation. Science. 1997;278(5343):1580–1. doi: 10.1126/science.278.5343.1580. [DOI] [PubMed] [Google Scholar]
- 2.Risch N, Merikangas K. The future of genetic studies of complex human diseases. Science. 1996;273(5281):1516–7. doi: 10.1126/science.273.5281.1516. [DOI] [PubMed] [Google Scholar]
- 3.Li Y, Agarwal P. A pathway-based view of human diseases and disease relationships. PLoS One. 2009;4(2):e4346. doi: 10.1371/journal.pone.0004346. [DOI] [PMC free article] [PubMed] [Google Scholar]
- 4.Emilsson V, Thorleifsson G, Zhang B, et al. Genetics of gene expression and its effect on disease. Nature. 2008;452(7186):423–8. doi: 10.1038/nature06758. [DOI] [PubMed] [Google Scholar]
- 5.Osborne JD, Flatow J, Holko M, et al. Annotating the human genome with disease ontology. BMC Genomics. 2009;10(suppl 1):S6. doi: 10.1186/1471-2164-10-S1-S6. [DOI] [PMC free article] [PubMed] [Google Scholar]
- 6.Pletscher-Frankild S, Palleja A, Tsafou K, et al. DISEASES: text mining and data integration of disease-gene associations. Methods. 2015;74:83–9. doi: 10.1016/j.ymeth.2014.11.020. [DOI] [PubMed] [Google Scholar]
- 7.Hamosh A, Scott AF, Amberger JS, et al. Online Mendelian Inheritance in Man (OMIM), a knowledgebase of human genes and genetic disorders. Nucleic Acids Res. 2005;33(Database issue):D514–7. doi: 10.1093/nar/gki033. [DOI] [PMC free article] [PubMed] [Google Scholar]
- 8.van Driel MA, Bruggeman J, Vriend G, et al. A text-mining analysis of the human phenome. Eur J Hum Genet. 2006;14(5):535–42. doi: 10.1038/sj.ejhg.5201585. [DOI] [PubMed] [Google Scholar]
- 9.Lage K, Karlberg EO, Storling ZM, et al. A human phenome-interactome network of protein complexes implicated in genetic disorders. Nat Biotechnol. 2007;25(3):309–16. doi: 10.1038/nbt1295. [DOI] [PubMed] [Google Scholar]
- 10.Goh KI, Cusick ME, Valle D, et al. The human disease network. Proc Natl Acad Sci U S A. 2007;104(21):8685–90. doi: 10.1073/pnas.0701361104. [DOI] [PMC free article] [PubMed] [Google Scholar]
- 11.Lee DS, Park J, Kay KA, et al. The implications of human metabolic network topology for disease comorbidity. Proc Natl Acad Sci U S A. 2008;105(29):9880–5. doi: 10.1073/pnas.0802208105. [DOI] [PMC free article] [PubMed] [Google Scholar]
- 12.Janjic V, Przulj N. The core diseasome. Mol Biosyst. 2012;8(10):2614–25. doi: 10.1039/c2mb25230a. [DOI] [PubMed] [Google Scholar]
- 13.Suratanee A, Plaimas K. Identification of inflammatory bowel disease-related proteins using a reverse k-nearest neighbor search. J Bioinform Comput Biol. 2014;12(4):1450017. doi: 10.1142/S0219720014500176. [DOI] [PubMed] [Google Scholar]
- 14.Zitnik M, Janjic V, Larminie C, et al. Discovering disease-disease associations by fusing systems-level molecular data. Sci Rep. 2013;3:3202. doi: 10.1038/srep03202. [DOI] [PMC free article] [PubMed] [Google Scholar]
- 15.Sun K, Goncalves JP, Larminie C, et al. Predicting disease associations via biological network analysis. BMC Bioinformatics. 2014;15:304. doi: 10.1186/1471-2105-15-304. [DOI] [PMC free article] [PubMed] [Google Scholar]
- 16.Amberger JS, Bocchini CA, Schiettecatte F, et al. OMIM.org: Online Mendelian Inheritance in Man (OMIM(R)), an online catalog of human genes and genetic disorders. Nucleic Acids Res. 2015;43(Database issue):D789–98. doi: 10.1093/nar/gku1205. [DOI] [PMC free article] [PubMed] [Google Scholar]
- 17.Szklarczyk D, Franceschini A, Kuhn M, et al. The STRING database in 2011: functional interaction networks of proteins, globally integrated and scored. Nucleic Acids Res. 2011;39(Database issue):D561–8. doi: 10.1093/nar/gkq973. [DOI] [PMC free article] [PubMed] [Google Scholar]
- 18.Rodriguez-Lopez R, Reyes-Palomares A, Sanchez-Jimenez F, et al. PhenUMA: a tool for integrating the biomedical relationships among genes and diseases. BMC Bioinformatics. 2014;15(1):375. doi: 10.1186/s12859-014-0375-1. [DOI] [PMC free article] [PubMed] [Google Scholar]
- 19.Lovász L. Random walks on graphs: a survey. Combinatorics Paul Erdös is Eighty. 1993;2(1):353–98. [Google Scholar]
- 20.Chung FRK. Spectral Graph Theory. Providence, RI: American Mathematical Society; 1997. Published for the Conference Board of the Mathematical Sciences. [Google Scholar]
- 21.Guney E, Oliva B. Exploiting protein-protein interaction networks for genome-wide disease-gene prioritization. PLoS One. 2012;7(9):e43557. doi: 10.1371/journal.pone.0043557. [DOI] [PMC free article] [PubMed] [Google Scholar]
- 22.Scott W, Padhraic S. Algorithms for estimating relative importance in networks; Proceedings of the Ninth ACM SIGKDD International Conference on Knowledge Discovery and Data Mining; Washington DC: ACM; 2003. pp. 266–75. [Google Scholar]
- 23.Fuxman Bass JI, Diallo A, Nelson J, et al. Using networks to measure similarity between genes: association index selection. Nat Methods. 2013;10(12):1169–76. doi: 10.1038/nmeth.2728. [DOI] [PMC free article] [PubMed] [Google Scholar]
- 24.Bader GD, Hogue CW. An automated method for finding molecular complexes in large protein interaction networks. BMC Bioinformatics. 2003;4:2. doi: 10.1186/1471-2105-4-2. [DOI] [PMC free article] [PubMed] [Google Scholar]
- 25.Hannon P, Markiel A, Ozier O, et al. Cytoscape: a software environment for integrated models of biomolecular interaction networks. Genome Res. 2003;13(11):2498–504. doi: 10.1101/gr.1239303. [DOI] [PMC free article] [PubMed] [Google Scholar]
- 26.Asur S, Ucar D, Parthasarathy S. An ensemble framework for clustering protein-protein interaction networks. Bioinformatics. 2007;23(13):i29–40. doi: 10.1093/bioinformatics/btm212. [DOI] [PubMed] [Google Scholar]
- 27.Nigro V, Savarese M. Genetic basis of limb-girdle muscular dystrophies: the 2014 update. Acta Myol. 2014;33(1):1–12. [PMC free article] [PubMed] [Google Scholar]
- 28.Greenberg SA, Salajegheh M, Judge DP, et al. Etiology of limb girdle muscular dystrophy 1D/1E determined by laser capture microdissection proteomics. Ann Neurol. 2012;71(1):141–5. doi: 10.1002/ana.22649. [DOI] [PubMed] [Google Scholar]
- 29.Marseglia L, D’Angelo G, Manti S, et al. Sudden cardiac arrest in a child with nemaline myopathy. Ital J Pediatr. 2015;41(1):20. doi: 10.1186/s13052-015-0124-8. [DOI] [PMC free article] [PubMed] [Google Scholar]
- 30.Nair AS, Nirale AM, Sriprakash K, et al. Dilated cardiomyopathy in acromegaly: case report and anesthesia management. Anesth Essays Res. 2013;7(3):411–14. doi: 10.4103/0259-1162.123277. [DOI] [PMC free article] [PubMed] [Google Scholar]
- 31.Parent JJ, Towbin JA, Jefferies JL. Left ventricular noncompaction in a family with lamin a/c gene mutation. Tex Heart Inst J. 2015;42(1):73–6. doi: 10.14503/THIJ-13-3843. [DOI] [PMC free article] [PubMed] [Google Scholar]
- 32.Hui DS, Morley JE, Mikolajczak PC, et al. Atrial fibrillation: a major risk factor for cognitive decline. Am Heart J. 2015;169(4):448–456. doi: 10.1016/j.ahj.2014.12.015. [DOI] [PubMed] [Google Scholar]
- 33.Cuneo BF. The beginnings of long QT syndrome. Curr Opin Cardiol. 2015;30(1):112–7. doi: 10.1097/HCO.0000000000000135. [DOI] [PubMed] [Google Scholar]
- 34.Sarquella-Brugada G, Campuzano O, Arbelo E, Brugada J, Brugada R. Brugada syndrome: clinical and genetic findings. Genet Med advance online publication. 2015 Apr 23; doi: 10.1038/gim.2015.35. [DOI] [PubMed] [Google Scholar]
- 35.Saghazadeh A, Mastrangelo M, Rezaei N. Genetic background of febrile seizures. Rev Neurosci. 2014;25(1):129–61. doi: 10.1515/revneuro-2013-0053. [DOI] [PubMed] [Google Scholar]
- 36.Li N, Zhang J, Guo JF, et al. Novel mutation of SCN1 A in familial generalized epilepsy with febrile seizures plus. Neurosci Lett. 2010;480(3):211–4. doi: 10.1016/j.neulet.2010.06.040. [DOI] [PubMed] [Google Scholar]
- 37.Beales PL, Elcioglu N, Woolf AS, et al. New criteria for improved diagnosis of Bardet-Biedl syndrome: results of a population survey. J Med Genet. 1999;36(6):437–46. [PMC free article] [PubMed] [Google Scholar]
- 38.Rakoczy EP, Narfstrom K. Gene therapy for eye as regenerative medicine? Lessons from RPE65 gene therapy for Leber’s Congenital Amaurosis. Int J Biochem Cell Biol. 2014;56:153–7. doi: 10.1016/j.biocel.2014.09.022. [DOI] [PubMed] [Google Scholar]
- 39.Walia S, Fishman GA, Jacobson SG, et al. Visual acuity in patients with Leber’s congenital amaurosis and early childhood-onset retinitis pigmentosa. Ophthalmology. 2010;117(6):1190–8. doi: 10.1016/j.ophtha.2009.09.056. [DOI] [PubMed] [Google Scholar]
- 40.Sattar S, Gleeson JG. The ciliopathies in neuronal development: a clinical approach to investigation of Joubert syndrome and Joubert syndrome-related disorders. Dev Med Child Neurol. 2011;53(9):793–8. doi: 10.1111/j.1469-8749.2011.04021.x. [DOI] [PMC free article] [PubMed] [Google Scholar]
- 41.Salonen R, Paavola P. Meckel syndrome. J Med Genet. 1998;35(6):497–501. doi: 10.1136/jmg.35.6.497. [DOI] [PMC free article] [PubMed] [Google Scholar]
- 42.Salonen R, Kestila M, Bergmann C. Clinical utility gene card for: Meckel syndrome. Eur J Hum Genet. 2011;19(7) doi: 10.1038/ejhg.2010.255. [DOI] [PMC free article] [PubMed] [Google Scholar]
- 43.Tanriverdi HA, Hendrik HJ, Ertan K, et al. Meckel Gruber syndrome: a first trimester diagnosis of a recurrent case. Eur J Ultrasound. 2002;15(1–2):69–72. doi: 10.1016/s0929-8266(02)00009-5. [DOI] [PubMed] [Google Scholar]
- 44.Leightner AC, Hommerding CJ, Peng Y, et al. The Meckel syndrome protein meckelin (TMEM67) is a key regulator of cilia function but is not required for tissue planar polarity. Hum Mol Genet. 2013;22(10):2024–40. doi: 10.1093/hmg/ddt054. [DOI] [PMC free article] [PubMed] [Google Scholar]
- 45.Hildebrandt F, Attanasio M, Otto E. Nephronophthisis: disease mechanisms of a ciliopathy. J Am Soc Nephrol. 2009;20(1):23–35. doi: 10.1681/ASN.2008050456. [DOI] [PMC free article] [PubMed] [Google Scholar]
- 46.Parisi MA, Doherty D, Chance PF, et al. Joubert syndrome (and related disorders) (OMIM 213300) Eur J Hum Genet. 2007;15(5):511–21. doi: 10.1038/sj.ejhg.5201648. [DOI] [PubMed] [Google Scholar]
- 47.Baala L, Romano S, Khaddour R, et al. The Meckel-Gruber syndrome gene, MKS3, is mutated in Joubert syndrome. Am J Hum Genet. 2007;80(1):186–94. doi: 10.1086/510499. [DOI] [PMC free article] [PubMed] [Google Scholar]
- 48.Karmous-Benailly H, Martinovic J, Gubler MC, et al. Antenatal presentation of Bardet-Biedl syndrome may mimic Meckel syndrome. Am J Hum Genet. 2005;76(3):493–504. doi: 10.1086/428679. [DOI] [PMC free article] [PubMed] [Google Scholar]
- 49.Huber C, Cormier-Daire V. Ciliary disorder of the skeleton. Am J Med Genet C Semin Med Genet. 2012;160C(3):165–74. doi: 10.1002/ajmg.c.31336. [DOI] [PubMed] [Google Scholar]
- 50.Schmidts M, Vodopiutz J, Christou-Savina S, et al. Mutations in the gene encoding IFT dynein complex component WDR34 cause Jeune asphyxiating thoracic dystrophy. Am J Hum Genet. 2013;93(5):932–44. doi: 10.1016/j.ajhg.2013.10.003. [DOI] [PMC free article] [PubMed] [Google Scholar]
- 51.Apostolou T, Nikolopoulou N, Theodoridis M, et al. Late onset of renal disease in nephronophthisis with features of Joubert syndrome type B. Nephrol Dial Transplant. 2001;16(12):2412–5. doi: 10.1093/ndt/16.12.2412. [DOI] [PubMed] [Google Scholar]
- 52.Lefebvre M, Foulkes WD. Pheochromocytoma and paraganglioma syndromes: genetics and management update. Curr Oncol. 2014;21(1):e8–17. doi: 10.3747/co.21.1579. [DOI] [PMC free article] [PubMed] [Google Scholar]
- 53.Ferriero R, Manco G, Lamantea E, et al. Phenylbutyrate therapy for pyru-vate dehydrogenase complex deficiency and lactic acidosis. Sci Transl Med. 2013;5(175):175ra131. doi: 10.1126/scitranslmed.3004986. [DOI] [PMC free article] [PubMed] [Google Scholar]
- 54.Debray FG, Lambert M, Gagne R, et al. Pyruvate dehydrogenase deficiency presenting as intermittent isolated acute ataxia. Neuropediatrics. 2008;39(1):20–3. doi: 10.1055/s-2008-1077084. [DOI] [PubMed] [Google Scholar]
- 55.Nellis MM, Danner DJ. Gene preference in maple syrup urine disease. Am J Hum Genet. 2001;68(1):232–37. doi: 10.1086/316950. [DOI] [PMC free article] [PubMed] [Google Scholar]
Associated Data
This section collects any data citations, data availability statements, or supplementary materials included in this article.
Supplementary Materials
Supplementary Table 1. The list of 126 phenotypic series.
Supplementary Table 2. The complete list of all 7,875 pairs of diseases with the DDA scores and literature evidence.
Supplementary Table 3. The correlation between association indices of all 7,875 pairs of diseases.