Abstract
In this study, we have developed 50- to 100-µm-sized titanium phosphate glass microcarriers (denoted as Ti5) that show enhanced proliferation of human mesenchymal stem cells and MG63 osteosarcoma cells, as well as enhanced human mesenchymal stem cell expression of bone differentiation markers, in comparison with commercially available glass microspheres at all time points. We also demonstrate that these microcarriers provide superior human mesenchymal stem cell proliferation with conventional Dulbecco’s Modified Eagle medium than with a specially developed commercial stem cell medium. The microcarrier proliferative capacity is revealed by a 24-fold increase in MG63 cell numbers in spinner flask bioreactor studies performed over a 7-day period, versus only a 6-fold increase in control microspheres under the same conditions; the corresponding values of Ti5 and control microspheres under static culture are 8-fold and 7-fold, respectively. The capability of guided osteogenic differentiation is confirmed by ELISAs for bone morphogenetic protein-2 and osteopontin, which reveal significantly greater expression of these markers, especially osteopontin, by human mesenchymal stem cells on the Ti5 microspheres than on the control. Scanning electron microscopy and confocal laser scanning microscopy images reveal favorable MG63 and human mesenchymal stem cell adhesion on the Ti5 microsphere surfaces. Thus, the results demonstrate the suitability of the developed microspheres for use as microcarriers in bone tissue engineering applications.
Keywords: Titanium, phosphate glasses, microspheres, bone cells, mesenchymal stem cells
Introduction
In the ever-expanding field of tissue engineering, the so-called bottom-up tissue engineering paradigm1 has recently emerged as a viable alternative to the commonly used “top-down” paradigm,2 which suffers from the fundamental limitation of concentration gradients of biologically relevant molecules (e.g. oxygen, glucose, amino acids, metabolic products) between the outer surface and the center of the tissue-engineered construct, along with the consequent problems of (1) preferential cell proliferation and extracellular matrix formation at the outer surface (up to about 200–250 µm in depth), (2) nutrient deprivation and subsequent cell death at the core, and (3) restrictions in the dimensions of the tissue engineering constructs thus formed (generally in the millimeter range).3–6
The bottom-up approach envisages the initial development of microscopic building blocks of structures that mimic the natural tissue composition and architecture, followed by the assembly of these building blocks to form larger tissue constructs, thereby potentially facilitating the development of three-dimensional (3D) tissue-engineered structures with high cell density and overcoming the size limitation of the top-down approach.7–9 Among the various designs investigated as micro-scale cell-based building blocks, cell-seeded microcarriers or microspheres have been widely investigated from the viewpoints of microcarrier design and cell–microcarrier interactions, and a large variety of microcarriers have been explored including commercially available microcarriers such as Biosilon® (polystyrene), Cellagen® (collagen), Cultispher® (gelatin), Cytodex® (dextran, positively charged or gelatin coated), and Hillex® (dextran with surface coating) as well as non-commercial microcarriers made of materials such as cellulose, chitosan, polycaprolactone, and poly(l-lactide).10 These microcarrier designs are characterized by the presence of porosity, which increases the available surface area considerably and allows cell penetration into the microcarrier bulk but at the same time poses the challenge of cell harvesting post culture since trypsinization may not be the optimal method to dislodge the maximum number of cells from the microspheres.
Non-porous glass microspheres, which have thus far been used mainly in oncological applications as internal brachytherapeutic tools to combat hepatic malignancies,11 are now being explored as microcarrier substrates in tissue engineering applications. In the context of in vitro bone cell expansion and bone tissue engineering, microspheres made from titanium phosphate glasses offer certain advantages from both material and biological standpoints. Titanium phosphate glasses have already been extensively studied as suitable biomaterials for orthopedic applications on account of their highly controllable physicochemical properties and ability to elicit a positive response from bone cells under both in vitro and in vivo conditions.12–16 Microspheres of these glasses possess certain features—a large surface area (in comparison with tissue culture plastic) that is easily and accurately quantifiable (as opposed to porous microcarriers or glass microparticles) and a non-porous morphology that allows easy harvesting by trypsinization—that make them appropriate substrates for industrial scale-up of the cell expansion process for providing a large quantity of cells that can be used in cell-based therapies or high-throughput screening applications. The cell-seeded microspheres thus obtained can be assembled into larger tissue via methods such as packing into perfusion bioreactors, stacking of layers, or direct assembly.17
In this study, we investigated the interactions between titanium phosphate glass microspheres and two different human cell types, namely, MG63 osteosarcoma cells and human mesenchymal stem cells (hMSCs), under two culture environments: (1) static culture in ultra-low attachment cell culture plates and (2) dynamic culture in spinner flask bioreactors.
Materials and methods
Preparation of glass microspheres
Titanium phosphate glass having the composition 0.5P2O5–0.4CaO–0.05Na2O–0.05TiO2 (mole fraction) was prepared by the melt-quench technique in accordance with Abou Neel et al.’s methods18 using stoichiometric quantities of phosphorus pentoxide (P2O5), calcium carbonate (CaCO3), sodium dihydrogen orthophosphate (NaH2PO4), and titanium oxide (TiO2) (all precursors were of >98% purity and were obtained from VWR-BDH, UK). Preheating of the precursor mix at 700°C for 30 min was followed by melting at 1300°C for 3 h, rapid quenching by pouring on to a steel plate, and overnight cooling. The glass thus obtained was crushed and sieved to form microparticles in the size range 50–100 µm, which were then processed to form microspheres using the flame spheroidization technique as described elsewhere.19
Preparation of MG63 osteoblast-type and hMSCs
MG63 osteoblast-type cells and hMSCs were grown using previously described protocols20 with some modifications depending on the type of cell culture medium employed. Three types of culture media were used in different experiments, with all reagents procured from Gibco® (Life Technologies Ltd, UK) unless mentioned otherwise: (1) low-glucose Dulbecco’s modified Eagle medium (DMEM) supplemented with fetal calf serum (FCS; 10% v v−1) and penicillin–streptomycin (1%); (2) osteogenic medium (OM), prepared as per previously explained methods21 and comprising low-glucose DMEM, FCS (10% v v−1), penicillin–streptomycin (1%), Fungizone (0.1%), dexamethasone (0.1 µM), ascorbic acid 2-phosphate (0.2 mM), and glycerol 2-phosphate (10 mM; last three chemicals procured from Sigma–Aldrich, UK); and (3) a commercially available mesenchymal stem cell growth medium DXF (PromoCell GmbH, Germany). Since DXF does not contain cell attachment and spreading factors, the surface of the cell culture flask was treated with bovine fibronectin (10 µg mL−1; PromoCell GmbH) in phosphate buffered saline (PBS) for 1 h prior to cell seeding in order to facilitate cell attachment and cytoplasmic spreading.
Cell culture on microspheres under static conditions
Static culturing of cells on microspheres was carried out in Corning Costar® ultra-low attachment 24-well cell culture plates (Corning, USA). For microsphere sterilization, microspheres were weighed and sterilized by dry heating at 180°C for 1 h. The microspheres (approximately 200 mg weight) were aseptically transferred to the ultra-low attachment plates such that the entire surface of the well was covered with a thin microsphere layer. Pre-warmed cell medium at 37°C was added to each well, followed by equilibration at 37°C/5% CO2 for 1 h and cell seeding at a density of 50,000 cells per well. The plate was then incubated in a 37°C/5% CO2 incubator. In all the experiments (unless otherwise noted), 50% of the medium was replaced at intervals of 2 days. The control used for all the experiments was commercially available silica glass microspheres (Polysciences Inc., USA) with sizes of 50–100 µm. For experiments involving the DXF medium, an additional microsphere coating step was employed prior to pre-warmed medium addition, in which bovine fibronectin in PBS (1 mL; 10 µg mL−1 solution) was added to each well containing sterilized microspheres and left as is for 1 h before removal.
Cell culture on microspheres under dynamic conditions
Dynamic culture experiments were conducted in 125 mL capacity spinner flask bioreactors (4500 series; Corning). Prior to the experiment, the inner surfaces of the bioreactor were siliconized by treating with 1 mL Sigmacote (Sigma–Aldrich) for 2–3 h, followed by rinsing in distilled water and autoclaving. The cells were initially seeded on microspheres in ultra-low attachment 24-well cell culture plates at a density of 50,000 cells per well as described above. The cell culture plate was then (1) placed in a 37°C/5% CO2 incubator for 1 h, (2) placed on a plate shaker operating at 100 r/min for 5 min so as to ensure mixing of cells and microspheres in the well, and (3) replaced in the incubator for 1 h. Meanwhile, pre-warmed DMEM (40 mL) was added to the bioreactors. The contents of each plate well were then added to the bioreactor using Pasteur pipettes; the well was washed three to four times with medium (approximately 10 mL) which was subsequently added to the bioreactor to bring the total medium volume to 50 mL. The bioreactors were then placed on a Variomag Biosystem magnetic stirrer plate (Thermo Scientific, USA) inside a 37°C/5% CO2 incubator, with agitation achieved via a polytetrafluoroethylene paddle fitted with a magnetic stirring bar; the stirrer plate was connected to a Cimarec Biomodul 40B control unit (Thermo Scientific, Germany) placed outside the incubator so that the stirring speed could be controlled externally. The stirring speed was maintained at 20 r/min for 24 h. Subsequently, more DMEM (50 mL) was added to the bioreactor to bring the working volume within the bioreactor to 100 mL, and the stirring speed was increased to 40 r/min and maintained for the remainder of the experiment. At 3-day intervals, 50% of the bioreactor medium was replaced with fresh medium. At 1, 4, and 7 days, approximately 90 mL of the medium was discarded and the solid contents (microspheres and adherent cells) were transferred to a conventional 24-well cell culture plate using Pasteur pipettes. The bioreactor bottom surface was washed two to three times with cell culture medium so as to dislodge any remaining microspheres which were then transferred to the well; at each step, excess medium in the wells was discarded. After the entire solid contents were transferred to the cell culture plate, fresh cell culture medium (1 mL) was added to each well. Commercially available 50–100 µm size silica glass microspheres (Polysciences Inc.) were used as the control.
SEM and live–dead staining and imaging using CLSM
SEM and CLSM imaging were carried out as per previously described methods19 with some modifications. The sample preparation steps for both SEM imaging (fixation, dehydration, critical point drying, and sputter coating) and CLSM imaging (fixation, staining of cytoskeleton actin filaments with phalloidin, and counterstaining of nucleus with propidium iodide) were performed in situ. SEM and CLSM images were obtained with a scanning electron microscope (model JSM 5410LV, JEOL, Japan; operating voltage = 10 kV) and confocal microscope (Biorad, USA), respectively.
Quantification of cell number
Cell proliferation on the microspheres was quantitatively determined using the Cell Counting Kit-8 cell titer assay (CCK-8; Sigma–Aldrich) at time points of 1, 4, and 7 days for duplicate samples (i.e. n = 2). At each time point, part of the culture medium (10% volume) was removed from all the wells and replaced with CCK-8 reagent, followed by incubation at 37°C/5% CO2 for 4 h. Aliquots (100 µL) from each well were then transferred to a 96-well plate (eight aliquots per sample/control well), and absorption was detected at 450 nm using a Tecan Infinite® 200 PRO microplate reader (Tecan, Switzerland). To obtain the data in terms of the number of cells, a standard calibration curve was determined in a separate experiment.
Alizarin Red S assay for determination of mineralization
The Alizarin Red S assay was carried out in accordance with the protocol as described by Gregory et al.22 with some modifications. Assay measurements for the sample and control microspheres were performed at 7, 14, and 21 days on duplicate samples (i.e. n = 2) cultured in OM within ultra-low attachment 24-well plates. At each time point, the contents in each well were washed with PBS and fixed with formalin (10%; Sigma–Aldrich) for 1 h at room temperature, followed by further washing, addition of Alizarin Red S dye (2%) in water (0.5 mL; pH 4.2), aspiration after 20 min, and overnight drying. For quantification of staining, a solution of cetylpyridinium chloride (0.5 mL; 10% w v−1; Sigma–Aldrich) in sodium phosphate buffer (10 mM; pH 7.0) was added to each well. After 2 h, aliquots (100 µL) were transferred to a 96-well plate and absorbance was measured in the microplate reader at 540 nm.
ELISAs for bone morphogenetic protein-2 and osteopontin
ELISAs for detection of bone morphogenetic protein (BMP-2 and osteopontin (OPN) release were carried out as per protocols specified by the manufacturer (mammalian Quantikine ELISA kits; R&D Systems, UK). As in the Alizarin Red S assay, the ELISA measurements for the sample and control microspheres were performed at 7, 14, and 21 days on duplicate samples (i.e. n = 2) cultured in OM within ultra-low attachment 24-well plates. At each time point, the cell culture supernatant from each well was collected and replaced with fresh medium. The collected supernatant was centrifuged at 1500 r/min for 10 min at a temperature of 4°C so as to remove any particulates; the supernatant was then stored at −20°C until required. Following the assay procedure, optical density was measured at 450 nm with respect to a reference wavelength of 540 nm. In order to convert the optical density values to protein concentrations in nanograms per milliliter or picograms per milliliter, a standard curve of protein concentration versus optical density was plotted according to the manufacturer instructions.
Statistical analysis
All statistical analyses were carried out using IBM SPSS version 21 (SPSS Inc., USA). Initial normality tests (one-sample Kolmogorov–Smirnov test) revealed that the data did not have a normal distribution, so non-parametric tests were used, specifically the Kruskal–Wallis H test and Mann–Whitney U test. Multiple pairwise comparisons were corrected using the Bonferroni correction method. The assumed levels of significance for the statistical tests were 0.05 unless Bonferroni corrections were used, in which case it was either 0.008 or 0.016.
Results
Static and dynamic MG63 cell–microsphere interactions
Cell titer assays
In order to quantify the effects of the bioreactor-induced dynamic environment on the number of MG63 cells attached to the microspheres, the results obtained from dynamic culture in spinner flasks were compared with those from static culture in ultra-low attachment plates for the same experimental conditions: (1) weights of microspheres used (200 mg), (2) seeding density (50,000 cells per well), (3) medium replacement interval (every 3 days), and (4) time points (1, 4, and 7 days).
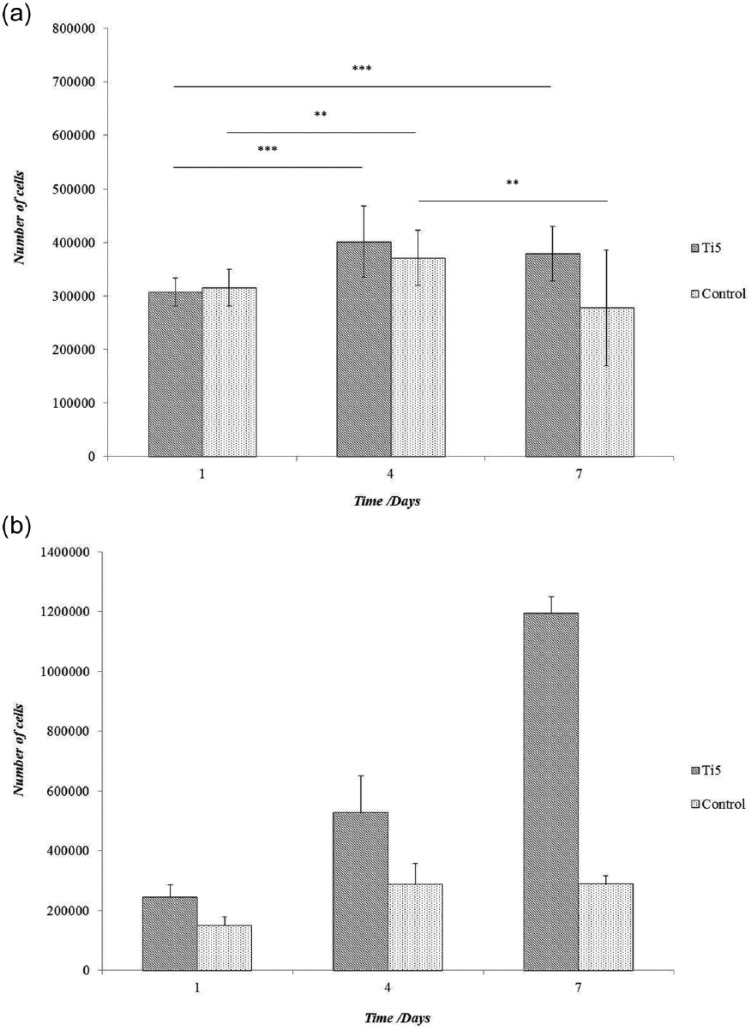
In the static culture system (Figure 1(a)), the differences in cell numbers between the Ti5 and control glass microspheres were not significant at any of the time points (p > 0.016, Bonferroni correction). The Ti5 microspheres showed a 30% increase in cell numbers from day 1 to day 4 and an overall 29% increase from day 1 to day 7 (***p < 0.001); the cell numbers decreased slightly from day 4 to day 7, but the difference was statistically insignificant (p > 0.016, Bonferroni correction). The control microspheres showed an 18% increase in cell numbers from day 1 to day 4, but the cell numbers underwent a significant 25% decrease from day 4 to day 7 (**p < 0.01 in both cases). For an initial seeding density of 50,000 cells per well, the increase in the cell population by day 7 was approximately eightfold on the Ti5 microspheres and approximately sixfold on the control microspheres.
Figure 1.
Bar charts showing the proliferation of MG63 cells on Ti5 and control glass microspheres at time points of 1, 4, and 7 days under (a) static conditions in ultra-low attachment plates and (b) under dynamic conditions in spinner flask bioreactors, as determined using the CCK-8 assay. The control comprises silica glass microspheres (Polysciences Inc.). Error bars represent ±SD where n = 2. ** and *** indicate p < 0.01 and p < 0.001, respectively (note that for clarity, statistical significance is not shown in graph (b)).
In the dynamic culture system (Figure 1(b)), the cell numbers for the Ti5 microspheres were considerably higher than those for the control microspheres at all the time points (62% higher on day 1, 87% on day 4, and 314% on day 7; ***p < 0.001). The number of cells on the control microspheres increased by 88% between days 1 and 4 (***p < 0.001); however, the increase between days 4 and 7 was statistically insignificant (p > 0.016, Bonferroni correction). In contrast, the number of cells on the Ti5 microspheres increased by 117% between days 1 and 4 and 127% between days 4 and 7 (***p < 0.001). Importantly, for an initial seeding density of 50,000 cells per well, the cell population over a 7-day period underwent an approximately 24-fold increase in the Ti5 microspheres but only an approximately 6-fold increase in the control microspheres.
Scanning electron microscopy and confocal laser scanning microscopy imaging
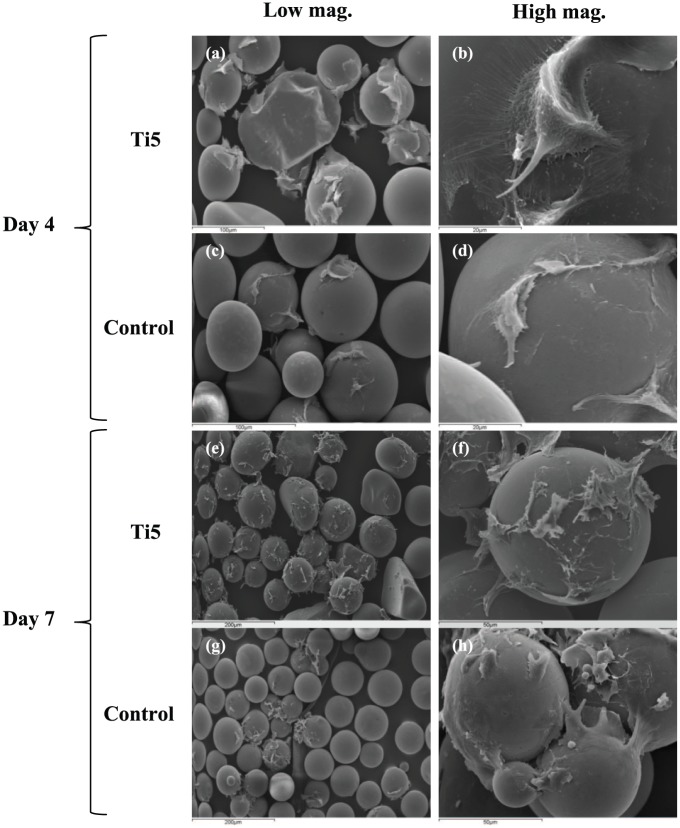
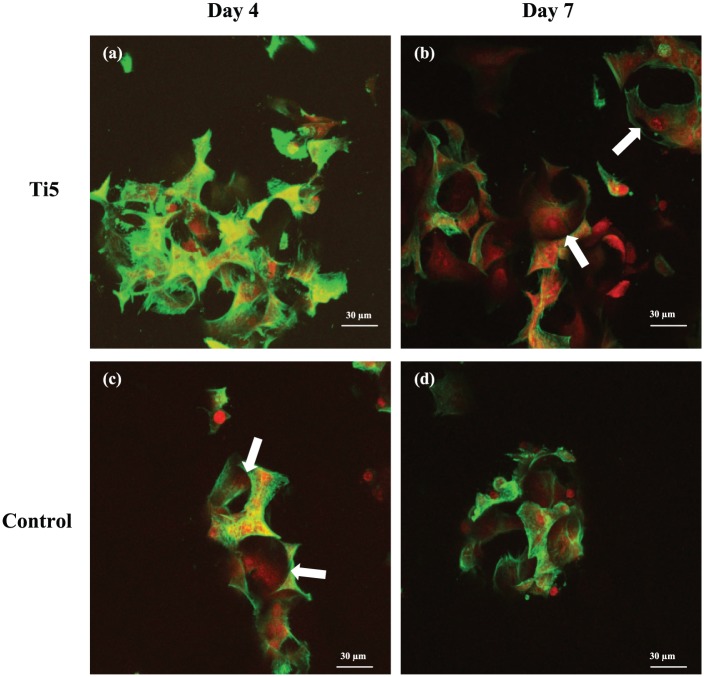
Scanning electron microscopy (SEM) imaging of samples cultured under dynamic conditions revealed that on days 4 and 7, the Ti5 microspheres exhibited greater cell coverage on the surface in comparison with the control microspheres (Figure 2). On Ti5 microspheres, more cells were observed on the surface on day 7 compared with day 4. In many cases, the cells exhibited a disrupted appearance as they adhered to the surfaces of both the Ti5 and control microspheres. At the same time, it was possible to discern individual cells with a flattened morphology on the microspheres as well as groups of cell–microsphere aggregates with groups of cells on adjacent microspheres joined to each other. Similar observations were made from confocal laser scanning microscopy (CLSM) images of bioreactor-mediated MG63 culture on Ti5 and control microspheres at days 4 and 7 post seeding, with good cell adhesion indicated by the alignment of cytoskeletal filaments along the microsphere curvature (Figure 3; note that SEM/CLSM images for day 1 are not included since very little cell adhesion was observed in those images, with most of the microspheres appearing devoid of cells).
Figure 2.
Scanning electron microscopy images showing MG63 cells attached to (a, b) Ti5 and (c, d) control glass microspheres at 4 days post seeding as well as (e, f) Ti5 and (g, h) control glass microspheres at 7 days post seeding after culture under dynamic conditions in spinner flask bioreactors. Left images are at lower magnifications (100× or 200×), while right images are at higher magnifications (1500× or 2000×).
Figure 3.
Confocal laser scanning microscopy images of MG63 cells growing on Ti5 and control microspheres in spinner flask bioreactors at 4 days post culture (a, c) and 7 days post culture (b, d), respectively. Phalloidin stains the actin filaments of the cytoskeleton green, while propidium iodide stains the nuclei red. The white arrows in the images indicate the alignment of cytoskeletal filaments along the surface curvature.
Static hMSC–microsphere interactions
Determination of cell number assays
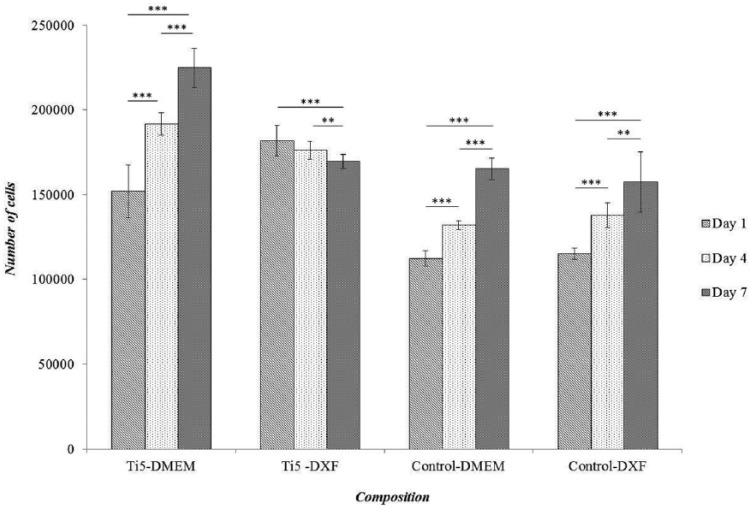
It was observed that among the four sample/medium combinations that were investigated, that is, Ti5–DMEM, Ti5–DXF, control–DMEM, and control–DXF, all the combinations except Ti5–DXF showed a significant increase in cell number from day 1 to day 7 (***p < 0.001; Figure 4). Under DMEM culture, the Ti5 and control microspheres showed overall increases of 48% and 47% (***p < 0.001) in the cell number from day 1 to day 7; for an initial seeding density of 50,000 cells, the cell numbers increased by 4.5- and 3.3-fold, respectively. Under DXF medium culture, the cell number trends for the control microspheres were roughly similar to when DMEM was used. However, in contrast to all the other results, the Ti5 microspheres showed a statistically significant decrease in cell number of 7% from day 1 to day 7 (***p < 0.001) but a 3.4-fold increase for 50,000 cells per well initial seeding density.
Figure 4.
Bar chart representing the results of a CCK-8 assay to quantify hMSC proliferation on Ti5 and control microspheres in ultra-low attachment cell culture plates at time points of 1, 4, and 7 days when DMEM and a commercially available mesenchymal stem cell growth medium DXF (Promocell GmbH, Germany) are used as the culture medium. The control comprises silica glass microspheres (Polysciences Inc.). Error bars represent ±SD and n = 2. ** and *** indicate p < 0.01 and p < 0.001, respectively.
Under DMEM culture, the Ti5 microspheres showed significantly greater cell numbers than the control microspheres at all the investigated time points; thus, the differences in cell numbers between the Ti5 and control microspheres were 26%, 31%, and 26% at days 1, 4, and 7, respectively (***p < 0.001). Under DXF medium culture, a significantly greater number of cells were found on the Ti5 microspheres in comparison with the control microspheres at days 1 and 4 (40% difference at day 1; 24% difference at day 4; ***p < 0.001) but not at day 7 (p > 0.05). Furthermore, it was observed that in the case of the Ti5 microspheres, DMEM resulted in 18% lower cell number than the commercially available DXF on day 1 (***p < 0.001); however, DMEM subsequently outperformed DXF with 7% higher cell number on day 4 and 24% higher proliferation on day 7 (***p < 0.001). In the case of the control microspheres, no statistically significant difference was found between the DMEM and DXF media at any of the time points (p > 0.05 throughout).
SEM and live–dead assay using CLSM
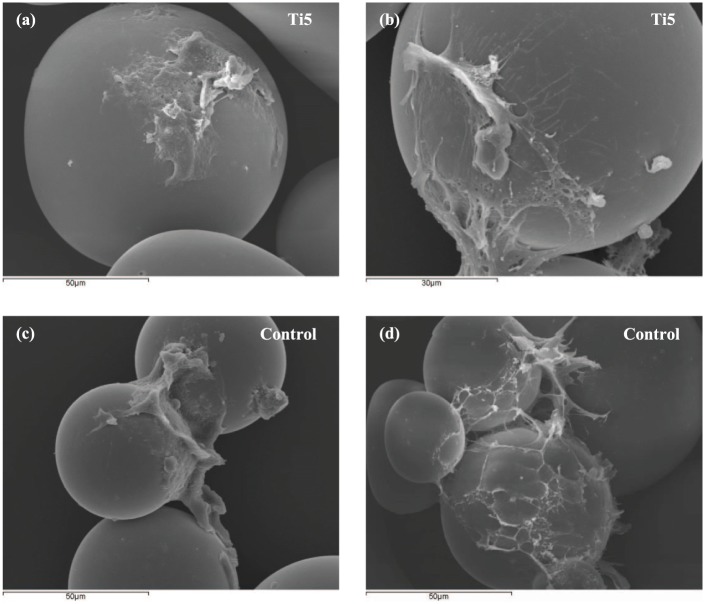
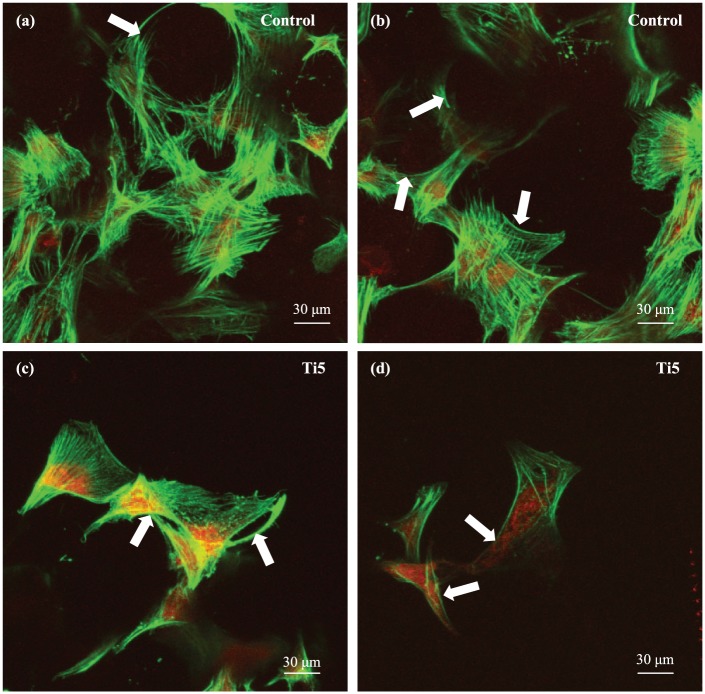
SEM imaging at day 7 revealed that on both the Ti5 and control microspheres, the cells were either somewhat flattened and seem to be spreading out on the surface or they had a disrupted appearance and seemed to be peeling off the microspheres (Figure 5). Mostly, individual cells were seen on the Ti5 microspheres, whereas groups of cells could be seen on the control microspheres. Cell–microsphere aggregates comprising groups of microspheres covered with cells joined to each other by means of processes could also be discerned in the control microspheres. CLSM images obtained at day 7 showed more cells adhering to the microspheres than the SEM images (Figure 6). Similar to the SEM images, more cells were observed growing on the control microspheres as compared to the Ti5 microspheres in the CLSM images. Favorable cell adhesion could be inferred from the alignment of the green actin filaments along the microsphere curvature (note that SEM/CLSM images for days 1 and 4 are not included since very little cell adhesion was observed in those images, with most of the microspheres appearing devoid of cells).
Figure 5.
Scanning electron microscopy images showing hMSCs attached to (a, b) Ti5 and (c, d) control glass microspheres when cultured in ultra-low attachment plates at 7 days post seeding (DMEM is used as the culture medium).
Figure 6.
Confocal laser scanning microscopy images of hMSCs growing on the (a, b) control microspheres and (c, d) Ti5 microspheres in ultra-low attachment plates at 7 days post culture. DMEM is used as the culture medium. Phalloidin stains the actin filaments of the cytoskeleton green, while propidium iodide stains the nuclei red. The white arrows in the images indicate the alignment of cytoskeletal filaments along the surface curvature.
Alizarin Red S assay for mineralization determination
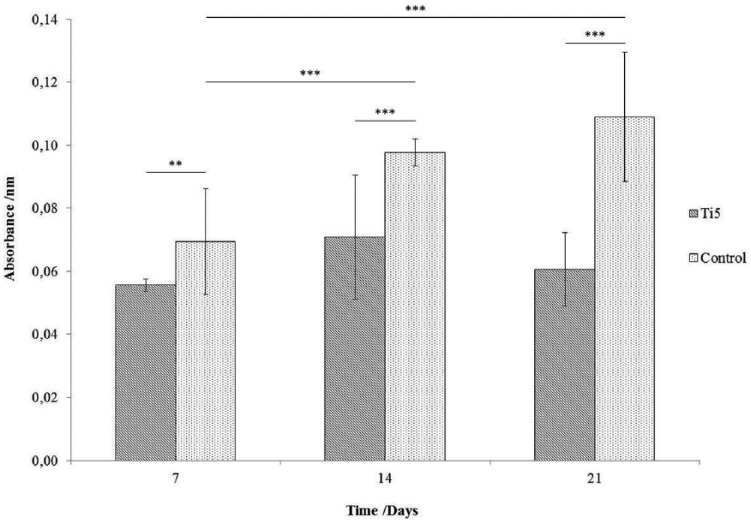
Over the 21-day experimental period, the level of mineralization on the control microspheres was found to be significantly greater than that on the Ti5 microspheres at all the investigated time points (Figure 7; **p < 0.01; ***p < 0.001). The absorbance values underwent an increase in the control microspheres over the duration of the experiment, with the differences between days 7 and 14 and between days 7 and 21 being statistically significant (***p < 0.001). However, for the Ti5 microspheres, the differences among the absorbance values at all the investigated time points were not statistically significant (p > 0.016, Bonferroni correction).
Figure 7.
Bar chart representing the differentiation of hMSCs in OM into bone cells on Ti5 and control glass microspheres as quantified by the extent of mineralization on the microsphere surface using an Alizarin Red S assay carried out at time points of 7, 14, and 21 days. Error bars represent ±SD where n = 2. ** and *** indicate p < 0.01 and p < 0.001, respectively.
ELISAs for bone morphogenetic protein-2 and OPN
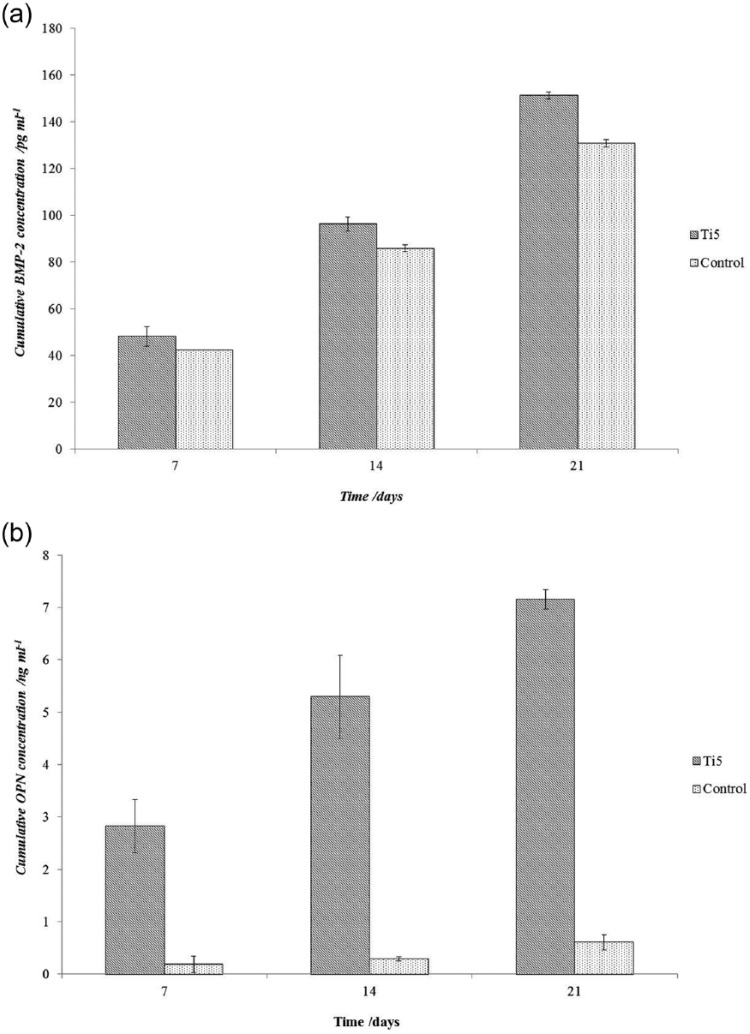
At all time points, in comparison with the control microspheres, BMP-2 production on the Ti5 microspheres was significantly enhanced (Figure 8(a)), with the differences being 13.6%, 12.1%, and 15.7% at 7, 14, and 21 days, respectively; however, OPN production on the Ti5 microspheres was considerably higher (Figure 8(b)), with differences of 15.2-, 18.3-, and 11.8-fold. The hMSCs produced OPN at higher levels (0.2–7.1 ng mL−1 or 200–7100 pg mL−1 range) than BMP-2 (42–151 pg mL−1 range) when cultured on the Ti5 and control microspheres. To illustrate, at day 21, the amount of OPN produced by the cells on the Ti5 microspheres was 7154 ng mL−1, whereas that on the control microspheres was 605 ng mL−1; the amounts of BMP-2 produced by the same cells on the Ti5 and control microspheres were only 151 and 130 ng mL−1, respectively.
Figure 8.
Bar chart for hMSCs in OM showing the variation in the cumulative secretion of (a) bone morphogenetic protein-2 (BMP-2) and (b) osteopontin (OPN) by hMSCs at time points of 7, 14, and 21 days when cultured on Ti5 and control microspheres in osteogenic medium, as quantified using a mammalian BMP-2 ELISA. Error bars represent ±SD where n = 2.
Discussion
The aim of this study was to explore the interactions between titanium phosphate glass microspheres and two different cell types—MG63 osteosarcoma cells and hMSCs—under two different environments: (1) static environments via culture in ultra-low attachment cell culture plates and (2) dynamic environments via culture in spinner flask bioreactors.
In the bioreactor studies, the Ti5 microspheres exhibited markedly superior MG63 cell proliferation in spinner flask bioreactors in comparison with control microspheres in the bioreactors, as well as with Ti5 and control microspheres under static conditions with similar experimental parameters. This result demonstrates the potential of the investigated titanium phosphate glass microspheres to function as stable microcarrier surfaces for in vitro bone cell expansion, as well as the efficacy of the bioreactor approach employed in the study. It is clear that under the same mechanical shear force levels, MG63 cells react very differently when cultured on the Ti5 microspheres in comparison with the control microspheres, with much stronger cell adhesion, spreading, and proliferation on the Ti5 microsphere surface. The effects of the mechanical forces exerted in bioreactors on bone cells have been studied previously, and it has been demonstrated that the presence of such forces can significantly benefit bone cell differentiation, mineral matrix formation, and phenotypic expression in vitro.23–25 Thus, it has been reported that fluid low under in vitro conditions can exert mechanical forces on bone cells that beneficially impact the levels of various biochemical factors. These include intracellular calcium, nitric oxide, and prostaglandin E2. Furthermore, these forces can upregulate the expression of the genes for OPN, cyclooxygenase-2, and c-Fos as well as other intracellular messengers and transcription factors. The stimulatory effects of such forces in vitro are analogous to how bone cells respond in vivo when pressure gradients arise during mechanical loading during different activities. With regard to the static culture results in Figure 1(a), the lower cell numbers and high error values at day 7 can be attributed to the medium replacement frequency used (3 days), which, while being adequate for dynamic culture with a 100 mL working volume, is not adequate for static culture with a working volume of 1 mL; the build-up of waste products from cell metabolic processes is suggested as a possible influencing factor, as well as cell loss during media replacement.
With regard to the dynamic culture SEM and CLSM images (Figures 2 and 3 respectively), the presence of greater cells adhering to the Ti5 microspheres compared to the control microspheres at days 4 and 7 is in agreement with the cell proliferation results. However, the apparent disrupted appearance of the cells on the microspheres is in contrast to the appearance of MG63 cells cultured on the microspheres under static conditions in previous studies, where most of the cells appeared undisturbed.19,26 The disrupted appearance of the cells cultured under dynamic conditions can be attributed to the forces exerted on the microsphere–cell aggregates when they were pipetted out of the bioreactors at each time point using Pasteur pipettes (these pipetting steps were not necessary during static culture) and also when the samples were processed for SEM and CLSM. It is possible that loss of poorly adherent cells may also have occurred during these processes. However, it is anticipated that such cell loss should not constitute a major concern when harvesting the expanded cells for use in cell therapy applications because the attached cells would in any case need to be trypsinized to detach them from the microsphere surfaces prior to further use or, depending on the application, not removed from the substrate at all.
The factors influencing hMSC adhesion and differentiation on glass surfaces have been previously assessed,27 and the beneficial effects on stem cell adhesion and differentiation of the presence of particular functional groups such as −NH2 on the glass surface have been highlighted. From a biofunctionalization perspective, the coating of the culture surface with proteins such as fibronectin, gelatin, or collagen has been found to enhance MSC adhesion and to more effectively mimic several features of the extracellular microenvironment.28,29 Therefore, to obtain effective hMSC proliferation on the microspheres in this study, an attempt was made to combine two strategies: (1) the use of DXF medium—marketed as a specifically designed medium for the efficient proliferation of MSCs and robust differentiation of undifferentiated multipotent MSCs—for improved proliferation of hMSCs on the Ti5 microspheres, and (2) coating the microsphere surfaces with fibronectin so as to provide the necessary attachment factors for improved cell adhesion. Irrespective of the medium used (DMEM or DXF), the Ti5 microspheres typically showed greater hMSC numbers than the control microspheres over the 7-day culture period, further confirming the superior performance of the developed microspheres over the commercially available silica glass microspheres when comparing their respective cell proliferation capacities.
However, the results shown in Figure 4 clearly revealed that the DXF medium was not as effective as conventional DMEM in aiding hMSC proliferation on the Ti5 microsphere surface over a 7-day period; indeed, a statistically significant adverse effect was indicated, with DMEM showing greater proliferation than DXF on days 4 and 7. The medium replacement regime may be an influencing factor here since the fibronectin coating was applied only once to the microspheres prior to introduction of medium into the culture wells even as both the DMEM and DXF media were replaced at intervals of 2 days; removal of the fibronectin coating after day 1 with medium replacement and/or ineffective initial coating of the microspheres with fibronectin prior to cell seeding cannot be ruled out as possible reasons.
The suboptimal findings vis-à-vis use of commercially available culture media to aid hMSC adhesion and proliferation on substrate materials are, to some extent, in agreement with observations by other research groups engaged in similar research. As reviewed by Jung et al.,30 several companies have developed specifically designed media for the accelerated expansion of hMSCs, but major limitations in the use of such media are their high cost and the non-disclosure of the underlying formulations in most cases. Several studies cited in the review have reported contradictory results in terms of media performance for the same culture media, often because of the differences in the substrate used. Thus, it is vital to carefully evaluate the available media with regard to specific medium or serum components that could significantly affect hMSC adhesion and proliferation. Commercially available stem cell media with clearly defined compositions have a significant advantage since they allow researchers to assess the effects of different media components and to alter the media composition according to the end application.31,32 Furthermore, several research groups have investigated the use of so-called home-made mesenchymal stem cell media using a combination of high-glucose DMEM, fetal bovine serum, penicillin–streptomycin, and recombinant human fibroblast growth factor.30,33,34 Such media can be prepared in the laboratory at a fraction of the cost of the commercially available media, and the formulations can be varied so as to suit specific end applications.
The SEM images in Figures 5 provided further evidence of less robust adhesion of hMSCs to the microsphere surface in comparison with MG63 cells on the same microspheres;19 fewer hMSCs were visible on the microsphere surfaces (with many microspheres devoid of cells) and many of the cells had a disrupted or peeled appearance. It is possible that the various SEM processing steps such as fixing, dehydration, and critical point drying—all of which involve pipetting of solvents into the cell culture wells—may be causing large-scale loss of poorly adherent cells as well as tearing of cell aggregates. More hMSCs are observed in the CLSM images (Figure 6) than in the SEM images, which is attributable to the fewer and less forceful processing steps involved in sample preparation for CLSM imaging. In both the SEM and CLSM images, more cells were found attached to the control microspheres than to the Ti5 microspheres; however, considering the qualitative nature of the images, it is not possible to make any definite inferences from these results.
The Alizarin Red S and ELISAs were performed in order to assess the potential of the Ti5 microspheres to function as platforms for guided differentiation of hMSCs along osteogenic pathways. The Alizarin Red S assay results (Figure 7) showed significantly greater mineral formation on the control microspheres than on the Ti5 microspheres at all the time points. It is possible that the forces involved in the processing steps such as pipetting, washing, and aspiration may have disrupted the mineral deposits formed on the microspheres; the relatively high error values suggest this may be the case. It is also worth noting that the mineral deposits formed on the surface of the silica glass control microspheres may be intrinsic to the material itself, as has been observed previously for silica-based glasses,35,36 and in this case may not be entirely indicative of the differentiation potential of the hMSCs; conversely, a lack of mineral layer formation on titanium phosphate glasses immersed in simulated biological fluid has been reported, even as these glasses have been found to elicit a favorable biological response from bone cells.18
BMP-2 has been implicated to be a key protein in the regulation of such diverse cellular processes as growth, differentiation, chemotaxis, and apoptosis in various cell types including mesenchymal, epithelial, hematopoietic, and neuronal cells.37 OPN is considered to play a role in bone metabolism; it has been shown to stimulate the adhesion of osteoclasts to bone in vitro38 and also to influence the regulation of mineral crystal formation and growth both in vitro and in vivo.39 The results showed that the Ti5 microspheres elicited greater BMP-2 expression than the control microspheres throughout the 21-day study period (Figure 8(a)), suggesting that Ti5 microspheres have a more positive influence on hMSCs in terms of differentiation to bone cells. Furthermore, the 12- to 15-fold higher OPN expression from hMSCs cultured on Ti5 microspheres compared to those cells grown on the control microspheres (Figure 8(b)) seems to suggest that hMSCs are far more metabolically active on the Ti5 microspheres than on the control.
OPN expression on the Ti5 microspheres prevailed over that on the control microspheres as well as BMP-2 expression on both microsphere types. The exact reasons for this result are not entirely clear, although it is considered that ion release, especially phosphate release, from the Ti5 microspheres may be an influencing factor. Ion release data for the Ti5 microspheres have been reported previously,19 and the release of phosphate species (PO43−, P3O93−, P2O74−, and P3O105−) has been found to be in the range of 5–13 ppm h−1; it is possible that these ion release levels are sufficient to cause significant expression of proteins such as OPN. In in vitro murine cellular models, increased phosphate levels have been found to be a signal for OPN induction in MC3T3-E1 cells,40 and extracellular inorganic phosphate has been reported to be responsible for significantly increased OPN expression in vitro by cementoblasts.35,36 However, further research is required in order to elucidate the exact mechanisms involving the cell signaling pathways that underlie the present results.
Conclusion
The interactions between titanium phosphate glass microspheres and two types of cells, namely, human MG63 osteosarcoma cells and mesenchymal stem cells (hMSCs), have been investigated under both static conditions (ultra-low attachment cell culture plates) and dynamic conditions (spinner flask bioreactors) with a view to establishing the efficacy of the microspheres as suitable microcarrier substrates for cell adhesion, proliferation, and, in the case of hMSCs, differentiation along osteogenic pathways. The results reveal that under dynamic conditions, titanium phosphate glass microspheres containing 5 mol% TiO2 (Ti5 microspheres) show a 24-fold increase in MG63 cell numbers over a 7-day culture period, which is considerably higher than the 6-fold increase shown under the same conditions by the control (commercially available silica glass microspheres). This increase in cell numbers is also much greater than the sevenfold to eightfold increase shown by Ti5 and control microspheres under static conditions. The results of hMSC static culture experiments show that the commonly used low-glucose DMEM culture outperforms the specially formulated commercial stem cell medium DXF in terms of the ability to aid in hMSC proliferation on the microsphere surface. The results of the Alizarin Red S assay are inconclusive, but ELISAs over a 21-day period demonstrate that hMSCs cultured on Ti5 microspheres express significantly higher levels of BMP-2 and considerably higher levels of OPN in comparison with the control microspheres, thereby confirming the ability of the investigated microspheres to function as platforms for guided osteogenic differentiation of hMSCs. It is expected that these approaches will in future facilitate the development of viable bone tissue in vitro for use in bone replacement therapies.
Footnotes
Declaration of conflicting interests: The author(s) declared no potential conflicts of interest with respect to the research, authorship, and/or publication of this article.
Funding: The author(s) disclosed receipt of the following financial support for the research, authorship, and/or publication of this article: This work was supported by Global Research Laboratory (GRL, #2015032163) Program through the National Research Foundation (NRF), funded by the Ministry of Education, Science and Technology, Republic of Korea. Part of this work was undertaken at UCL/UCLH which receives funding from the Department of Health’s NIHR as a Comprehensive Biomedical Research Centre. The UCL Graduate School is thanked for the GRS and ORS scholarships provided to N.J.L.
References
- 1. Nichol JW, Khademhosseini A. Modular tissue engineering: engineering biological tissues from the bottom up. Soft Matter 2009; 5: 1312–1319. [DOI] [PMC free article] [PubMed] [Google Scholar]
- 2. Langer R, Vacanti JP. Tissue Engineering. Science 1993; 260: 920. [DOI] [PubMed] [Google Scholar]
- 3. Ishaug SL, Crane GM, Miller MJ, et al. Bone formation by three-dimensional stromal osteoblast culture in biodegradable polymer scaffolds. J Biomed Mater Res 1997; 36: 17–28. [DOI] [PubMed] [Google Scholar]
- 4. Ishaug-Riley SL, Crane-Kruger GM, Yaszemski MJ, et al. Three-dimensional culture of rat calvarial osteoblasts in porous biodegradable polymers. Biomaterials 1998; 19: 1405–1412. [DOI] [PubMed] [Google Scholar]
- 5. Holy CE, Shoichet MS, Davies JE. Engineering three-dimensional bone tissue in vitro using biodegradable scaffolds: investigating initial cell-seeding density and culture period. J Biomed Mater Res 2000; 51; 376–382. [DOI] [PubMed] [Google Scholar]
- 6. Muschler GE, Nakamoto C, Griffith LG. Engineering principles of clinical cell-based tissue engineering. J Bone Joint Surg Am 2004; 86A: 1541–1558. [DOI] [PubMed] [Google Scholar]
- 7. Fernandez JG, Khademhosseini A. Micro-masonry: construction of 3D structures by microscale self-assembly. Adv Mater 2010; 22: 2538–2541. [DOI] [PMC free article] [PubMed] [Google Scholar]
- 8. Liu B, Liu Y, Lewis AK, et al. Modularly assembled porous cell-laden hydrogels. Biomaterials 2010; 31: 4918–4925. [DOI] [PubMed] [Google Scholar]
- 9. Yanagawa F, Kaji H, Jang YH, et al. Directed assembly of cell-laden microgels for building porous three-dimensional tissue constructs. J Biomed Mater Res A 2011; 97: 93–102. [DOI] [PMC free article] [PubMed] [Google Scholar]
- 10. Martin Y, Eldardiri M, Lawrence-Watt DJ, et al. Microcarriers and their potential in tissue regeneration. Tissue Eng Part B 2011; 17: 71–80. [DOI] [PubMed] [Google Scholar]
- 11. Ho S, Lau WY, Leung TW, et al. Internal radiation therapy for patients with primary or metastatic hepatic cancer: a review. Cancer 1998; 83: 1894–1907. [PubMed] [Google Scholar]
- 12. Abou Neel EA, Chrzanowski W, Knowles JC. Effect of increasing titanium dioxide content on bulk and surface properties of phosphate-based glasses. Acta Biomaterialia 2008; 4: 523–534. [DOI] [PubMed] [Google Scholar]
- 13. Navarro M, Michiardi A, Castano O, et al. Biomaterials in orthopaedics. J R Soc Interface 2008; 5: 1137–1158. [DOI] [PMC free article] [PubMed] [Google Scholar]
- 14. Brauer DS, Karpukhina N, Law RV, et al. Effect of TiO2 addition on structure, solubility and crystallisation of phosphate invert glasses for biomedical applications. J Non-Cryst Solids 2010; 356: 2626–2633. [Google Scholar]
- 15. Lucacel RC, Maeir M, Simon V. Structural and in vitro characterization of TiO2-CaO-P2O5 bioglasses. J Non-Cryst Solids 2010; 356: 2869–2874. [Google Scholar]
- 16. Kiani A, Lakhkar NJ, Salih V, et al. Titanium-containing bioactive phosphate glasses. Philos Trans R Soc A 2012; 370: 1352–1375. [DOI] [PubMed] [Google Scholar]
- 17. Urciuolo F, Imparato G, Guaccio A, et al. Novel strategies to engineering biological tissue in vitro. Methods Mol Biol 2012; 811: 223–244. [DOI] [PubMed] [Google Scholar]
- 18. Abou Neel EA, Knowles JC. Physical and biocompatibility studies of novel titanium dioxide doped phosphate-based glasses for bone tissue engineering applications. J Mater Sci Mater Med 2008; 19: 377–386. [DOI] [PubMed] [Google Scholar]
- 19. Lakhkar NJ, Park JH, Mordan NJ, et al. Titanium phosphate glass microspheres for bone tissue engineering. Acta Biomaterialia 2012; 8: 4181–4190. [DOI] [PubMed] [Google Scholar]
- 20. Chen QZ, Efthymiou A, Salih V, et al. Bioglass-derived glass-ceramic scaffolds: study of cell proliferation and scaffold degradation in vitro. J Biomed Mater Res A 2008; 84: 1049–1060. [DOI] [PubMed] [Google Scholar]
- 21. De Girolamo L, Sartori MF, Albisetti W, et al. Osteogenic differentiation of human adipose-derived stem cells: comparison of two different inductive media. J Tissue Eng Regener Med 2007; 1: 154–157. [DOI] [PubMed] [Google Scholar]
- 22. Gregory CA, Grady Gunn W, Peister A, et al. An alizarin red-based assay of mineralization by adherent cells in culture: comparison with cetylpyridinium chloride extraction. Anal Biochem 2004; 329: 77–84. [DOI] [PubMed] [Google Scholar]
- 23. Bancroft GN, Sikavitsast VI, van den Dolder J, et al. Fluid flow increases mineralized matrix deposition in 3D perfusion culture of marrow stromal osteloblasts in a dose-dependent manner. P Natl Acad Sci USA 2002; 99: 12600–12605. [DOI] [PMC free article] [PubMed] [Google Scholar]
- 24. Sikavitsast VI, Bancroft GN, Holtorf HL, et al. Mineralized matrix deposition by marrow stromal osteoblasts in 3D perfusion culture increases with increasing fluid shear forces. P Natl Acad Sci USA 2003; 100: 14683–14688. [DOI] [PMC free article] [PubMed] [Google Scholar]
- 25. Meinel L, Karageorgiou V, Fajardo R, et al. Bone tissue engineering using human mesenchymal stem cells: effects of scaffold material and medium flow. Ann Biomed Eng 2004; 32: 112–122. [DOI] [PubMed] [Google Scholar]
- 26. Guedes JC, Park J-H, Lakhkar NJ, et al. TiO2-doped phosphate glass microcarriers: a stable bioactive substrate for expansion of adherent mammalian cells. J Biomater Appl 2013; 28: 3–11. [DOI] [PMC free article] [PubMed] [Google Scholar]
- 27. Curran JM, Chen R, Hunt JA. Controlling the phenotype and function of mesenchymal stem cells in vitro by adhesion to silane-modified clean glass surfaces. Biomaterials 2005; 26: 7057–7067. [DOI] [PubMed] [Google Scholar]
- 28. Caplan AI. Review: mesenchymal stem cells: cell-based reconstructive therapy in orthopedics. Tissue Eng 2005; 11: 1198–1211. [DOI] [PubMed] [Google Scholar]
- 29. Wagner W, Ho AD. Mesenchymal stem cell preparations—comparing apples and oranges. Stem Cell Rev 2007; 3: 239–248. [DOI] [PubMed] [Google Scholar]
- 30. Jung S, Panchalingam KM, Rosenberg L, et al. Ex vivo expansion of human mesenchymal stem cells in defined serum-free media. Stem Cells Int 2012; 2012: 123030. [DOI] [PMC free article] [PubMed] [Google Scholar]
- 31. Parker AM, Shang H, Khurgel M, et al. Low serum and serum-free culture of multipotential human adipose stem cells. Cytotherapy 2007; 9: 637–646. [DOI] [PubMed] [Google Scholar]
- 32. Mimura S, Kimura N, Hirata M, et al. Growth factor-defined culture medium for human mesenchymal stem cells. Int J Dev Biol 2011; 55: 181–187. [DOI] [PubMed] [Google Scholar]
- 33. Steigman SA, Fauza DO. Isolation of mesenchymal stem cells from amniotic fluid and placenta. Curr Protoc Stem Cell Biol. Epub ahead of print 1 June 2007. DOI: 10.1002/9780470151808.sc01e02s1 [DOI] [PubMed] [Google Scholar]
- 34. Hudson JE, Mills RJ, Frith JE, et al. A defined medium and substrate for expansion of human mesenchymal stromal cell progenitors that enriches for osteo- and chondrogenic precursors. Stem Cells Dev 2011; 20: 77–87. [DOI] [PubMed] [Google Scholar]
- 35. Foster B, Nociti F, Jr, Swanson E, et al. Regulation of cementoblast gene expression by inorganic phosphate in vitro. Calcif Tissue Int 2006; 78: 103–112. [DOI] [PubMed] [Google Scholar]
- 36. Fatherazi S, Matsa-Dunn D, Foster B, et al. Phosphate regulates osteopontin gene transcription. J Dent Res 2009; 88: 39–44. [DOI] [PMC free article] [PubMed] [Google Scholar]
- 37. Hogan BLM. Bone morphogenetic proteins: multifunctional regulators of vertebrate development. Genes Dev 1996; 10: 1580–1594. [DOI] [PubMed] [Google Scholar]
- 38. Reinholt FP, Hultenby K, Oldberg A, et al. Osteopontin–a possible anchor of osteoclasts to bone. P Natl Acad Sci USA 1990; 87: 4473–4475. [DOI] [PMC free article] [PubMed] [Google Scholar]
- 39. Boskey AL, Maresca M, Ullrich W, et al. Osteopontin-hydroxyapatite interactions in vitro: inhibition of hydroxyapatite formation and growth in a gelatin-gel. Bone Miner 1993; 22: 147–159. [DOI] [PubMed] [Google Scholar]
- 40. Beck GR, Zerler B, Moran E. Phosphate is a specific signal for induction of osteopontin gene expression. P Natl Acad Sci USA 2000; 97: 8352–8357. [DOI] [PMC free article] [PubMed] [Google Scholar]


