

Abstract
The aim of this study was to investigate the association between drug exposure and disease severity in SCA types 1, 2, 3 and 6. The Clinical Research Consortium for Spinocerebellar Ataxias (CRC-SCA) enrolled 319 participants with SCA1, 2, 3, and 6 from 12 medical centers in the United States and repeatedly measured clinical severity by the Scale for Assessment and Rating of Ataxia (SARA), the Unified Huntington's Disease Rating Scale part IV (UHDRS-IV), and the 9-item Patient Health Questionnaire during July 2009 to May 2012. We employed generalized estimating equations in regression models to study the longitudinal effects of coenzyme Q10 (CoQ10), statin, and vitamin E on clinical severity of ataxia after adjusting for age, sex, and pathological CAG repeat number. Cross-sectionally, exposure to CoQ10 was associated with lower SARA and higher UHDRS-IV scores in SCA1 and 3. No association was found between statins, vitamin E, and clinical outcome. Longitudinally, CoQ10, statins, and vitamin E did not change the rates of clinical deterioration indexed by SARA and UHDRS-IV scores within 2 years. CoQ10 is associated with better clinical outcome in SCA1 and 3. These drug exposures did not appear to influence clinical progression within 2 years. Further studies are warranted to confirm the association.
Keywords: coenzyme Q10, statins, spinocerebellar ataxias, neurodegeneration
Spinocerebellar ataxias (SCAs) are a group of autosomal-dominant cerebellar degenerative disorders, characterized by gait difficulty, speech disturbance, and loss of hand dexterity. SCA1, 2, 3, and 6 are the most common types of SCAs1; their respective pathological CAG repeat expansions in ATXN1, 2, 3, and CAC-NA1A genes cause abnormal polyglutamine protein inclusions and neurodegeneration.1 SCAs are rare diseases with a prevalence of 3 per 100,000.1 To study these rare disorders, ataxia specialists from 12 medical centers in the United States organized Clinical Research Consortium for Spinocerebellar Ataxias (CRC-SCAs) and prospectively followed up SCA1, 2, 3, and 6 patients. A similar consortium in Europe, EUROSCA, was also established to study the natural history of SCAs.2 The Scale for Assessment and Rating of Ataxia (SARA) was chosen to measure disease progression in SCAs.3,4
Despite the lack of evidence-based treatment, several mechanism-based therapeutic approaches have been proposed and employed in clinical practice. Polyglutamine repeats can directly activate the mitochondrial apoptotic pathway leading to neuronal death.5-8 Coenzyme Q10 (CoQ10) is a key mitochondrial respiratory chain cofactor, and primary CoQ10 deficiency can cause cerebellar ataxia,9 which is well responsive to CoQ10 supplement.10 Therefore, CoQ10 could be a potential candidate for treating SCAs.11,12 Statins are a class of cholesterol-lowering medications that have effects on lipid metabolism, cell signaling, and anti-inflammation.13 Statin use has been shown to reduce the incidence of Alzheimer's disease (AD),14 and discontinuation of statin is associated with increased incidence of Parkinson's disease.15 Disrupted cholesterol hemostasis has been discovered in polyglutamine disorders, such as Huntington's disease.16 Whether statins are also beneficial in other neurodegenerative diseases, such as SCAs, is not clear. Vitamin E is a potent antioxidant and has a potential effect of disease modification in AD animal models.17 Ataxia is also a prominent symptom in vitamin E deficiency and a beta-lipoproteinemia.18 It remains unknown whether vitamin E would have similar beneficial effects in other cerebellar ataxias. Varenicline and riluzole have been found to improve ataxia symptoms within a short-term treatment period,19,20 and whether these short-term benefits will continue requires longer observation.
There are very few medications such as varenicline being tested specifically for SCAs.19 Development of drugs for SCAs was mainly hindered by disease rarity and the need for long-term follow-ups. Therefore, we repeatedly measured SARA scores, the Unified Hun-tington's Disease Rating Scale part IV (UHDRS-IV) and depressive symptoms (the 9-item Patient Health Questionnaire; PHQ-9) to study the longitudinal effects of candidate drugs, including CoQ10, statins and vitamin E, in a cohort of SCA type 1, 2, 3 and 6 from the CRC-SCA.
Patients and Methods
Study Subjects
Study participants were recruited by ataxia or movement disorders specialists during July 2009 to May 2012 from 12 CRC-SCA centers at Columbia University, Emory University, Massachusetts General Hospital, Johns Hopkins University, University of California Los Angeles, University of California San Francisco, University of Chicago, University of Florida, University of Michigan, University of Minnesota, University of South Florida, and University of Utah. These patients were referred to specialty clinics by patients themselves, community physicians, local support groups, and the National Ataxia Foundation. The uniform study protocol was approved by the local institutional review boards and the informed consents were obtained from all participants. Our inclusion criteria were (1) the presence of ataxia, (2) definite genetic diagnosis of SCA1, 2, 3, or 6 either for the subject or another affected family member with ataxia, (3) willingness of participation, and (4) age of 6 years and older. Exclusion criteria were (1) known recessive, X-linked, and mitochondrial ataxias, (2) exclusion of SCA1, 2, 3, and 6 by previous genetic tests, and (3) concomitant disorder(s) that affect SARA and other ataxia measurements used in this study. Basic demographics were recorded, and all participants were asked to provide blood samples for SCA genotyping. Study participants were followed every 6 months until 2 years from the baseline visit or the end of August 2012 when the study was closed. In each visit, the severity of ataxia was recorded by a trained ataxia expert using SARA scores. We also used the UHDRS-IV to assess the functional impairment and PHQ-9 to evaluate depression, which is a common comorbidity in SCA patients.21 Information on concurrent medication was also collected.
Genetic Testing
DNA samples from blood of 263 participants were obtained, and CAG repeat expansions were determined in Dr. Stefan Pulst's laboratory. The Qiagen FlexiGene DNA Kit (Qiagen, Hilden, Germany) was used to extract DNA and CAG repeat expansions of SCAs were determined by multiplex polymerase chain reaction, followed by capillary electrophoresis with internal standards. Regenotyping and Sanger sequencing were performed for verification of repeat length in 10% of all samples. For 38 patients whose blood samples were not available in the research lab, we used the repeat numbers from the commercial labs.
Predictor Variables
Concomitant use of CoQ10, statins, vitamin E, riluzole, or varenicline at baseline is our major predictor and was treated as a dichotomous variable. We further divided statins into lipophilic (simvastatin, lovastatin, fluvastatin, and atorvastatin) and lipophobic statins (pravastatins and rosuvastatin).22 Statin could potentially lower the levels of CoQ10,23 and the interaction term (statin × CoQ10) was thus entered for secondary analysis. Although the duration and dosage of medication exposure were not consistently available, we further tested the effect of dose dependency in secondary analysis to confirm the primary outcome.
Outcome Variables
SARA is our primary outcome, which measures motor performance with a total score ranging from 0 to 40. Higher SARA scores reflected poor motor performance. There were 25 questions regarding functional performance in daily activities in the UHDRS-IV. One point was given if the answer to the individual question was positive; the total score of UHDRS-IV ranged from 0 to 25, and higher scores indicated better functional status. The PHQ-9 used nine questions to assess depressive mood over the past 2 weeks. Four levels were rated (not at all = 0; several days = 1; more than half the days = 2; nearly every day = 3) in each question, and higher scores (range, 0-27) reflected the severity of depression. The above outcome measures were all treated as continuous variables.
Statistical Analysis
Participants with repeated outcome measures were entered into analyses. SCA1, 2, 3, and 6 were treated as four independent cohorts and analyzed separately. We employed repeated-measures linear regression (an exchangeable working within-subject correlation model by a generalized estimating equation [GEE]) to compute average rates of disease progression in each SCA group and assess the associations between certain drug exposures and disease severity after controlling for age, sex, and pathological CAG repeat number. CAG repeat expansions have been shown to be strongly correlated with age of ataxia onset, explaining 55% to 70% of the variability24,25; thus, we did not include both age of onset and CAG repeat expansions in our primary analysis. Age of ataxia onset or disease duration was additionally included in the models in the secondary analysis. The longitudinal effects of drug exposure on disease progression during the 2-year observation period were assessed by entering the interaction terms (drug × time) into the GEE models. Coefficients of the interaction terms reflected the direction and magnitude of how certain drug exposures modified the disease course in SCAs.
All statistical analyses and graphics were performed in the software R (version 2.11.1; R Foundation for Statistical Computing, Vienna, Austria). All tests of statistical significance were conducted at the two-tailed α level of 0.05. Bonferroni's correction was made to account for multiple comparisons for five different drugs and was applied consistently to the reported analyses. The two-tailed α level of individual test was 0.01.
Results
Baseline Features and Disease Progression
A total of 319 patients in the CRC-SCA cohort were followed up with repeated measures of SARA scores and other health outcome indicators (Table 1). SCA3 was the most common type of SCA in the cohort (40.4%). Mean age at enrollment was around 15 years older for the SCA6 than SCA1, 2, and 3. After taking age and sex into account, baseline SARA score was higher in the SCA2 group (P = 0.02), whereas other outcome indicators, including UHDRS-IV and PHQ-9, did not differ across SCA groups.
Table 1. Clinical features of 319 participants in the CRC-SCA at enrollment.
| SCA1 | SCA2 | SCA3 | SCA6 | |
|---|---|---|---|---|
| Demographic feature | ||||
| Sample size, n | 53 | 69 | 129 | 68 |
| Mean age, y (SD) | 50.3 (13.0) | 50.9 (13.5) | 51.4 (12.3) | 65.5 (10.8) |
| Sex, male/female | 24/29 | 29/40 | 62/67 | 30/38 |
| White race, % | 90.6 | 73.9 | 54.2 | 91.2 |
| Mean age of onset (SD) | 40.2 (11.7) | 36.4 (11.9) N = 68 | 38.9 (11.9) N = 127 | 52.3 (10.4) |
| Mean disease duration (SD) | 8.8 (6.9) | 13.6 (8.3) N = 68 | 11.5 (7.8) N =128 | 11.7 (10.5) |
| Median repeats (range) | 46 (37-59) N = 52 | 39 (23-49) N = 64 | 71 (60-79) N =119 | 22 (22-27) N = 65 |
| Functional state | ||||
| SARA score (SD) | 14.4 (8.2) | 17.1 (7.4) | 15.1 (8.9) N 5128 | 14.1 (7.4) |
| UHDRS-IV score (SD) | 18.7 (6.3) | 18.2 (6.3) N = 68 | 17.2 (6.9) | 18.6 (5.8) |
| PHQ-9 score (SD) | 6.1 (6.7) N = 49 | 5.3 (5.4) N = 64 | 7.3 (5.8) N = 123 | 6.5 (6.0) N = 64 |
| Medication use, n (%) | ||||
| Coenzyme Q10 | 14 (26.4) | 9 (13.0) | 31 (24.0) | 20 (29.4) |
| Statin | 8 (15.1) | 7 (10.1) | 15 (11.6) | 13 (19.1) |
| Vitamin E | 6 (11.3) | 9 (13.0) | 14 (10.9) | 11 (16.2) |
| Riluzole | 3 (5.7) | 1 (1.4) | 9 (7.0) | 2 (2.9) |
| Varenicline | 1 (1.9) | 0 (0) | 4 (3.1) | 2 (2.9) |
Sd, standard deviation.
Clinical progression of SCAs in 2 years is well captured by SARA scores and UHDRS-IV scores in the CRC-SCA cohort.26 Older age and greater number of CAG repeats were associated with higher SARA scores, but not faster progression. The rate of clinical progression is similar to the EUROSCA cohort.2
CoQ10 and SARA Scores
CoQ10 was given to nearly one quarter of patients in this cohort (23.3%), more often than statins (13.2%), vitamin E (12.6%), riluzole (4.7%), and var-enicline (2.2%). The median daily dosage of CoQ10 exposure was 600 mg (n = 68; range, 100-2,400), and the mean duration of CoQ10 exposure before study visits was 34.7 months (n = 33; range, 1-139). Cross-sectionally, CoQ10 use was significantly associated with lower baseline SARA scores or better outcome in SCA1 and 3 (CoQ10 exposure vs. no CoQ10 exposure, or CoQ10 coefficient, SCA1: β = −5.90, P = 0.008; SCA2: β = −3.20, P = 0.11; SCA3: β = −5.54, P < 0.001; SCA6: β = −1.17, P = 0.54), and the effects remained significant with an additional adjustment for age of ataxia onset (SCA1: β = −5.67, P < 0.001; SCA2: β = −1.55, P = 0.43; SCA3: β = −4.95, P < 0.001; SCA6: β = −1.04, P = 0.57) or disease duration (SCA1: β = 25.87, P = 0.01; SCA2: β = −1.44, P = 0.55; SCA3: β = −4.35, P = 0.002; SCA6: β = −1.38, P = 0.41). With daily dosage of CoQ10 as our predictor, SCA patients who took higher daily dose of CoQ10 would have lower baseline SARA scores or better outcome by a 4.52-point difference (95% confidence interval: −6.84, −2.20) for every 1,000-mg increase in daily CoQ10 exposure, after adjusting for age, sex, and CAG repeat number. The relationship between CoQ10 dosage and baseline SARA scores is shown in the box plot (Fig. 1). The main effect was driven by the SCA3 group (−6.07; P = 0.003), though all other groups were in the same direction (SCA1: −5.4, P = 0.13; SCA2: −5.55, P = 0.14; SCA6: −2.36, P = 0.13). Longitudinally, CoQ10 exposure did not modify the annual rates of change in SARA scores across all SCA groups (CoQ10 exposure and time interaction coefficient; SCA1: β = −0.05, P = 0.43; SCA2: β = −0.06, P = 0.28; SCA3: β = −0.01, P = 0.76; SCA6: β = −0.05, P = 0.41; Table 2). Only 4 patients discontinued CoQ10 during the 2-year follow-ups, and 1 began taking CoQ10 during the study. Given that the discontinuation frequency was low, we treated CoQ10 use as a time-independent variable based on baseline information. We performed a sensitivity analysis by recoding these 4 patients as CoQ10 nonusers and still obtained similar results.
Fig. 1.
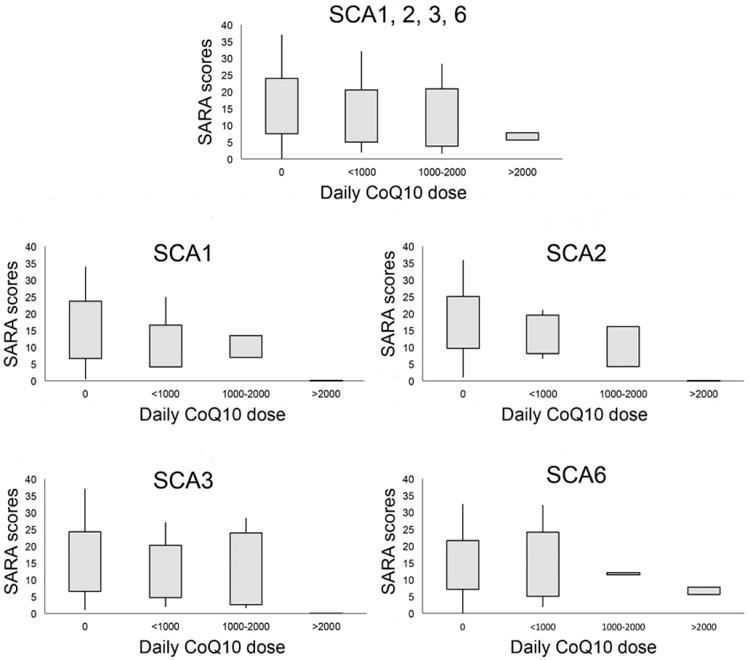
Baseline SARA scores of patients taking different daily dose of CoQ10 in all SCAs (A) or each SCA subtype (B–E). Box represents the first to the third quartile and whiskers show the minimum and maximum values (A–E).
Table 2. Effects of CoQ10, statin, and vitamin E on SARA scores in GEE models.
| Regression Coefficient in GEE Models of SARA Scores | ||||
|---|---|---|---|---|
|
| ||||
| SCA 1 | SCA 2 | SCA 3 | SCA 6 | |
| CoQ10 model | ||||
| CoQ10 | −5.90a | −3.20 | −5.54a | −1.17 |
| Time | 0.15a | 0.07 | 0.05 | 0.09 |
| CoQ10 × time | −0.05 | −0.06 | −0.01 | −0.05 |
| Statin model | ||||
| Statin | −1.29 | −1.08 | −1.26 | 4.50 |
| Time | 0.12a | 0.08 | 0.06 | 0.07 |
| Statin × time | 0.04 | −0.09 | −0.07 | 0.05 |
| Vitamin E model | ||||
| Vitamin E | −3.09 | −1.45 | −4.25 | −0.22 |
| Time | 0.12a | 0.05 | 0.05 | 0.06 |
| Vitamin E × Time | 0.08 | 0.11 | 20.001 | 0.13 |
Entries are regression coefficients in the GEE models with the time-varying SARA scores as the outcome of interest and age (year), sex (male/female), pathological CAG repeat number (N), time (month), concurrent medication (Y/N), and its interaction with time as predictors (coefficients of age, sex, and CAG repeat are not shown in the table). The regression coefficients can be interpreted as the change of SARA score per unit change of the predictor variables.
P < 0.01 or the rate of change is significantly different from zero.
Statins, Vitamin E, and SARA Scores
Cross-sectionally, statin exposure and baseline SARA scores in SCA1, 2, and 3 were not related, but statin use was associated with worse baseline SARA scores in the SCA6 group (statin exposure vs. no statin exposure, or statin coefficient; SCA1: β = −1.29, P50.66; SCA2: β = −1.08, P = 0.58; SCA3: β = −1.26, P = 0.83; SCA6: β = 4.50, P = 0.02); the negative association disappeared after Bonferroni's correction and remained similar when we also adjusted for age of ataxia onset (SCA6: β = 4.52, P = 0.006) or disease duration (SCA6: β = 4.55, P = 0.02) or after excluding lipophobic statins (SCA6: β = 5.05, P = 0.018). Longitudinally, statins did not modify the 2-year clinical course measured by SARA scores either (statin exposure and time interaction coefficient; SCA1: β = 0.05, P = 0.52; SCA2: β = −0.09, P = 0.19; SCA3: β = −0.07, P = 0.08; SCA6: β = 0.05, P = 0.47). Vitamin E was associated with neither baseline SARA scores nor the progression of SARA scores over time in all SCAs (Table 2).
CoQ10, Statins, Vitamin E, and UHDRS-IV
CoQ10 use was also significantly associated with higher baseline UHDRS-IV scores (mean difference: 3.2 points) or better outcomes in SCA1 and 3 (CoQ10 exposure vs. CoQ10 exposure, or CoQ10 coefficient; SCA1: β = 4.85, P < 0.001; SCA2: β = 2.59, P = 0.04; SCA3: β = 3.65, P < 0.001; SCA6: β = 1.87, P = 0.14). Statins and vitamin E were not associated with UHDRS-IV scores in all SCAs (Table 3). The total number of patients with riluzole or varenicline exposure was too small (riluzole, n = 15; varenicline, n = 7) to meaningfully assess the drug effects. Age of onset, CAG repeat number, and other demographic features were mostly comparable between CoQ10 users and nonusers (Table 4), except for the disease duration, which seemed to be longer in non-CoQ10 users than in CoQ10 users in SCA2 and SCA3 patients, though not statistically significant (P = 0.08 in SCA2 and P = 0.08 in SCA3). Only 8 SCA patients took both CoQ10 and statins (2 SCA1, 3 SCA3, and 3 SCA6), and 19 SCA patients took both CoQ10 and vitamin E (4 SCA1, 3 SCA2, 9 SCA3, and 3 SCA6). The sample size was too small to investigate their interactions.
Table 3. Effects of CoQ10, statin, and vitamin E on UHDRS-IV scores in GEE models.
| Regression Coefficient in GEE Models of UHDRS-IV Scores | ||||
|---|---|---|---|---|
|
| ||||
| SCA 1 | SCA 2 | SCA 3 | SCA 6 | |
| CoQ10 model | ||||
| CoQ10 | 4.85a | 2.59 | 3.65a | 1.87 |
| Time | −0.03 | −0.05 | −0.10a | −0.08a |
| CoQ10 × time | −0.07 | 0.01 | 0.02 | 0.05 |
| Statin model | ||||
| Statin | 3.30 | 2.92 | 1.11 | −3.33 |
| Time | −0.05 | −0.03 | −0.10a | −0.08a |
| Statin × time | 0.03 | −0.09 | −0.01 | 0.06 |
| Vitamin E model | ||||
| Vitamin E | 3.44 | −0.10 | 2.52 | 0.88 |
| Time | −0.03 | −0.04 | −0.10a | −0.05 |
| Vitamin E × time | −0.17 | −0.09 | 0.04 | −0.09 |
Entries are regression coefficients in the GEE models with the time-varying UHDRS-IV scores as the outcome of interest and age (year), sex (male/female), pathological CAG repeat number (N), time (month), concurrent medication (Y/N), and its interaction with time as predictors (coefficients of age, sex, and CAG repeat are not shown in the table). The regression coefficients can be interpreted as the change of UHDRS-IV score per unit change of the predictor variables.
P < 0.01.
Table 4. Clinical features of participants with and without coenzyme Q10 exposure.
| CoQ10 exposure | SCA1 | SCA2 | SCA3 | SCA6 | ||||
|---|---|---|---|---|---|---|---|---|
|
|
|
|
|
|||||
| Yes | No | Yes | No | Yes | No | Yes | No | |
| Sample size, n | 14 | 39 | 9 | 60 | 31 | 98 | 20 | 48 |
| Mean age, years | 50.0 ± 9.4 | 50.4 ± 14.2 | 51.7 ± 11.6 | 50.8 ± 13.8 | 52.3 ± 11.2 | 51.1 ± 12.6 | 65.9 ± 9.7 | 65.3 ± 11.3 |
| Male, % | 28.6 | 51.3 | 33.3 | 43.3 | 58.1 | 44.9 | 40 | 45.8 |
| White race, % | 100 | 87.2 | 77.8 | 73.3 | 71 | 49 | 95 | 89.6 |
| Age at onset, years | 40.5 ± 12.1 | 40.1 ± 11.7 | 41.3 ± 13.1 | 35.6 ± 11.7 | 41.7 ± 10.9 | 38 ± 12.1 | 52.9 ± 10.6 | 52.1 ± 10.5 |
| Disease duration, years | 8.1 ± 9.0 | 9.1 ± 6.2 | 9.1 ± 4.7 | 14.3 ± 8.6 | 9.3 ± 6.5 | 12.2 ± 8.1 | 11.6 ± 11.5 | 11.7 ± 10.1 |
| CAG repeats | 45.9 ± 2.8 | 46.2 ± 4.9 | 38.8 ± 2.2 | 39.7 ± 3.8 | 71.2 ± 3.5 | 70.6 ± 4.2 | 22.4 ± 0.7 | 22.4 ± 1.0 |
| Baseline SARA | 9.2 ± 5.8 | 16.2 ± 8.2 | 13.7 ± 5.7 | 17.6 ± 7.5 | 12.5 ± 8.3 | 16.0 ± 9.0 | 13.7 ± 8.5 | 14.2 ± 7.0 |
| Concomitant drugs, n | 5.4 ± 4.6 | 3.9 ± 3.2 | 4.1 ± 2.7 | 4.3 ± 3.6 | 6.1 ± 3.5 | 5.2 ± 4.2 | 6.8 ± 4.0 | 4.9 ± 4.4 |
Mean ± standard deviation is reported.
Discussion
We found that CoQ10 exposure was associated with better outcomes indexed by SARA scores and UHDRS-IV in SCA1 and 3 at baseline or cross-sectionally, although none of these drugs modify the disease progression within the 2-year observation or longitudinally. The dose-dependent effect of CoQ10 on SARA scores was found in SCA3, but not significant in SCA1, 2, and 6. A larger sample size for SCA1, 2, and 6 is warranted to clarify the difference.
The associations between CoQ10 exposure and clinical outcomes in SCA1 and 3 appeared to be consistent, but required cautious interpretation. CoQ10 was in a trend of being associated with lower SARA scores in SCA2 if not statistically significant (P = 0.11). Because the percentage of patients exposed to CoQ10 in SCA2 was much lower than that in SCA1 or 3 (CoQ10 exposure: SCA1, 26.4%; SCA2, 13.0%; SCA3, 24.0%), the CoQ10 effect may be noted if we have more SCA2 participants taking CoQ10 included in our analyses. However, the CoQ10 benefit we observed could be the result of several reasons. Those CoQ10 nonusers may have been exposed to CoQ10 earlier, but discontinued because of adverse effect or no effect, for which we do not know. Patients who have severe comorbid conditions requiring medical intervention may be less likely given CoQ10 for ataxia. All the above would make CoQ10 users look healthier at baseline.
There is growing evidence that CoQ10 could be beneficial in SCAs. CoQ10 is a cofactor of the mitochondrial respiratory chain and plays an important role in maintaining adequate mitochondrial function, whereas mitochondrial dysfunction is the common theme of neuronal death in SCAs.11,12 Pathological polyglutamine expansions in SCAs can form aggregates in neurons, which activates caspase-8 and leads to mitochondrial apoptotic neuronal death by up-regulating Bax and down-regulating Bcl-xL.5-8,27 Mitochondrial complex I gene polymorphism (10398G) is associated with early disease onset of SCA2.28 Taken together, it is plausible that CoQ10 can enhance mitochondrial function and provide clinical benefit to patients with polyglutamine-related SCAs.
CoQ10 exposure was associated with both objective (SARA) and subjective (UHDRS-IV) assessments at baseline, but did not modify SCA disease progression in our longitudinal analyses. There was no apparent difference in baseline features, such as age of onset and CAG repeat, between CoQ10 users and nonusers, suggesting that the associations noted in our analyses were not likely attributed to any genetic or inherited difference. CoQ10 may require a longer period of exposure to show clinical benefit in SCA1, 2, and 3. Another possibility is that CoQ10 only brings symptomatic relief and therefore the rate of disease progression is not modified by CoQ10 exposure. A future clinical trial is warranted to confirm the benefit of CoQ10 in SCA.
The study has several unique features. First, SCA is a rare disease and the CRC-SCA established a relatively large cohort of SCA1, 2, 3, and 6 with information collected in a standardized way, allowing us to observe the clinical course of a rare disease with respect to different drug exposures at a population level. This is the only study, to our knowledge, to look at the medication exposures and disease progression in a well-characterized cohort of SCAs. Second, in addition to SARA, the study also included UHDRS-IV, PHQ-9, and other indicators to follow disease progression so that not only motor symptoms, but also other aspects of functional status can be comprehensively assessed in SCAs. Third, most of our participants have information on CAG repeat number, which is considered the major determinant for disease onset and progression in SCAs.2,24 After adjusting for the pathological CAG repeat number, the effect of drug exposure can be examined in a less-biased way.
The study has many limitations. Although the comparison between CoQ10 users and nonusers was made, many confounders, such as indication for CoQ10, physician preference for prescribing CoQ10, and patient motivation of using antioxidants, remained unknown to us. Second, this 2-year follow-up study may not be long enough to examine disease-modifying effects of certain drugs. The average length of exposure to CoQ10 before study enrollment among CoQ10 users in our cohorts is approximately 3 years. Therefore, the association between medication use and disease progression may change if the CRC-SCA study can be extended further. Many candidate medications were included in the study, but not similarly distributed; CoQ10 was the most frequently used one, followed by statins, whereas other drugs were rarely given. We are not certain whether the significant drug effects found in the study were simply the result of higher statistical power. Nevertheless, the cohort size and follow-up time of CRC-SCA study could be the best possible data we have at the national level thus far; the potential benefit of drug exposure deserves attention given that there is no effectively disease-modifying treatment for SCAs.
In sum, we found that CoQ10 exposure may be associated with better clinical status in SCA1 and 3. These associations existed only at baseline, but did not replicate during the 2-year observation. Given the disease rarity and relentless progression, a clinical trial may more rigorously determine the effect of CoQ10 in SCAs.
Acknowledgments
Funding agencies: This work was supported by the American Academy of Neurology Clinical Research Training Fellowship, Parkinson Disease Foundation, the National Institute of Neurological Disorders and Stroke (K08 NS083738), the Louis V. Gerstner Jr. Scholarship, the American Parkinson's Disease Association, and the Rare Disease Clinical Research Network (RDCRN) (RC1NS068897).
Footnotes
Relevant conflicts of interest: Nothing to report.
financial disclosures: Full financial disclosures and author roles may be found in the online version of this article.
References
- 1.Dürr A. Autosomal dominant cerebellar ataxias: polyglutamine expansions and beyond. Lancet Neurol. 2010;9:885–894. doi: 10.1016/S1474-4422(10)70183-6. [DOI] [PubMed] [Google Scholar]
- 2.Jacobi H, Bauer P, Giunti P, et al. The natural history of spinocerebellar ataxia type 1, 2, 3, and 6: a 2-year follow-up study. Neurology. 2011;77:1035–1041. doi: 10.1212/WNL.0b013e31822e7ca0. [DOI] [PMC free article] [PubMed] [Google Scholar]
- 3.Schmitz-Hübsch T, Montcel du ST, Baliko L, et al. Scale for the assessment and rating of ataxia: development of a new clinical scale. Neurology. 2006;66:1717–1720. doi: 10.1212/01.wnl.0000219042.60538.92. [DOI] [PubMed] [Google Scholar]
- 4.Schmitz-Hubsch T, Fimmers R, Rakowicz M, et al. Responsiveness of different rating instruments in spinocerebellar ataxia patients. Neurology. 2010;74:678–684. doi: 10.1212/WNL.0b013e3181d1a6c9. [DOI] [PubMed] [Google Scholar]
- 5.Sanchez I, Xu CJ, Juo P, Kakizaka A, Blenis J, Yuan J. Caspase-8 is required for cell death induced by expanded polyglutamine repeats. Neuron. 1999;22:623–633. doi: 10.1016/s0896-6273(00)80716-3. [DOI] [PubMed] [Google Scholar]
- 6.Chou AH, Yeh TH, Kuo YL, et al. Polyglutamine-expanded ataxin-3 activates mitochondrial apoptotic pathway by upregulating Bax and downregulating Bcl-xL. Neurobiol Dis. 2006;21:333–345. doi: 10.1016/j.nbd.2005.07.011. [DOI] [PubMed] [Google Scholar]
- 7.Wang HL, Yeh TH, Chou AH, et al. Polyglutamine-expanded ataxin-7 activates mitochondrial apoptotic pathway of cerebellar neurons by upregulating Bax and downregulating Bcl-x(L) Cell Signal. 2006;18:541–552. doi: 10.1016/j.cellsig.2005.05.024. [DOI] [PubMed] [Google Scholar]
- 8.Chou AH, Lin AC, Hong KY, et al. p53 activation mediates polyglutamine-expanded ataxin-3 upregulation of Bax expression in cerebellar and pontine nuclei neurons. Neuroch Int. 2011;58:145–152. doi: 10.1016/j.neuint.2010.11.005. [DOI] [PubMed] [Google Scholar]
- 9.Artuch R, Brea-Calvo G, Briones P, et al. Cerebellar ataxia with coenzyme Q10 deficiency: diagnosis and follow-up after coenzyme Q10 supplementation. J Neurol Sci. 2006;246:153–158. doi: 10.1016/j.jns.2006.01.021. [DOI] [PubMed] [Google Scholar]
- 10.Pineda M, Montero R, Aracil A, et al. Coenzyme Q(10)-responsive ataxia: 2-year-treatment follow-up. Mov Disord. 2010;25:1262–1268. doi: 10.1002/mds.23129. [DOI] [PubMed] [Google Scholar]
- 11.Dueñas AM, Goold R, Giunti P. Molecular pathogenesis of spinocerebellar ataxias. Brain. 2006;129:1357–1370. doi: 10.1093/brain/awl081. [DOI] [PubMed] [Google Scholar]
- 12.Underwood BR, Rubinsztein DC. Spinocerebellar ataxias caused by polyglutamine expansions: a review of therapeutic strategies. Cerebellum. 2008;7:215–221. doi: 10.1007/s12311-008-0026-z. [DOI] [PubMed] [Google Scholar]
- 13.Wang Q, Yan J, Chen X, et al. Statins: multiple neuroprotective mechanisms in neurodegenerative diseases. Exp Neurol. 2011;230:27–34. doi: 10.1016/j.expneurol.2010.04.006. [DOI] [PubMed] [Google Scholar]
- 14.Pac-Soo C, Lloyd DG, Vizcaychipi MP, Ma D. Statins: the role in the treatment and prevention of Alzheimer's neurodegeneration. J Alzheimers Dis. 2011;27:1–10. doi: 10.3233/JAD-2011-110524. [DOI] [PubMed] [Google Scholar]
- 15.Lee YC, Lin CH, Wu RM, et al. Discontinuation of statin therapy associates with Parkinson disease: a population-based study. Neurology. 2013;81:410–416. doi: 10.1212/WNL.0b013e31829d873c. [DOI] [PubMed] [Google Scholar]
- 16.Karasinska JM, Hayden MR. Cholesterol metabolism in Huntington disease. Nat Rev Neurol. 2011;7:561–572. doi: 10.1038/nrneurol.2011.132. [DOI] [PubMed] [Google Scholar]
- 17.Behl C, Moosmann B. Antioxidant neuroprotection in Alzheimer's disease as preventive and therapeutic approach. Free Radic Biol Med. 2002;33:182–191. doi: 10.1016/s0891-5849(02)00883-3. [DOI] [PubMed] [Google Scholar]
- 18.Anheim M, Tranchant C, Koenig M. The autosomal recessive cerebellar ataxias. New Engl J Med. 2012;366:636–646. doi: 10.1056/NEJMra1006610. [DOI] [PubMed] [Google Scholar]
- 19.Zesiewicz TA, Greenstein PE, Sullivan KL, et al. A randomized trial of varenicline (Chantix) for the treatment of spinocerebellar ataxia type 3. Neurology. 2012;78:545–550. doi: 10.1212/WNL.0b013e318247cc7a. [DOI] [PubMed] [Google Scholar]
- 20.Ristori G, Romano S, Visconti A, et al. Riluzole in cerebellar ataxia: a randomized, double-blind, placebo-controlled pilot trial. Neurology. 2010;74:839–845. doi: 10.1212/WNL.0b013e3181d31e23. [DOI] [PubMed] [Google Scholar]
- 21.Schmitz-Hübsch T, Coudert M, Tezenas du Montcel S, et al. Depression comorbidity in spinocerebellar ataxia. Mov Disord. 2011;26:870–876. doi: 10.1002/mds.23698. [DOI] [PubMed] [Google Scholar]
- 22.Schachter M. Chemical, pharmacokinetic and pharmacodynamic properties of statins: an update. Fundam Clin Pharmacol. 2005;19:117–125. doi: 10.1111/j.1472-8206.2004.00299.x. [DOI] [PubMed] [Google Scholar]
- 23.Littarru GP, Langsjoen P. Coenzyme Q10 and statins: biochemical and clinical implications. Mitochondrion. 2007;7(Suppl):S168–S174. doi: 10.1016/j.mito.2007.03.002. [DOI] [PubMed] [Google Scholar]
- 24.Schöls L, Amoiridis G, Büttner T, Przuntek H, Epplen JT, Riess O. Autosomal dominant cerebellar ataxia: phenotypic differences in genetically defined subtypes? Ann Neurol. 1997;42:924–932. doi: 10.1002/ana.410420615. [DOI] [PubMed] [Google Scholar]
- 25.de Castilhos RM, Furtado GV, Gheno TC, et al. Spinocerebellar ataxias in brazil-frequencies and modulating effects of related genes. Cerebellum. 2014;13:17–28. doi: 10.1007/s12311-013-0510-y. [DOI] [PubMed] [Google Scholar]
- 26.Ashizawa T, Figueroa KP, Perlman SL, et al. Clinical characteristics of patients with spinocerebellar ataxias 1, 2, 3 and 6 in the US; a prospective observational study. Orphanet J Rare Dis. 2013;8:177. doi: 10.1186/1750-1172-8-177. [DOI] [PMC free article] [PubMed] [Google Scholar]
- 27.Wang HL, Chou AH, Lin AC, Chen SY, Weng YH, Yeh TH. Polyglutamine-expanded ataxin-7 upregulates Bax expression by activating p53 in cerebellar and inferior olivary neurons. Exp Neurol. 2010;224:486–494. doi: 10.1016/j.expneurol.2010.05.011. [DOI] [PubMed] [Google Scholar]
- 28.Simon DK, Zheng K, Velázquez L, et al. Mitochondrial complex I gene variant associated with early age at onset in spinocerebellar ataxia type 2. Arch Neurol. 2007;64:1042–1044. doi: 10.1001/archneur.64.7.1042. [DOI] [PubMed] [Google Scholar]