Abstract
Purpose
To compare in vitro T1ρ measurements in agarose phantoms and articular cartilage specimens using a 2D multi-slice spiral and 3D MAPSS MRI sequences.
Materials and Methods
Six phantoms (agarose concentration: 2%, 3%, 4%; n=2 each) and ten axially-sliced patellar specimens from five cadaveric donors were scanned at 3T. T1ρ weighted images were acquired using a 2D spiral and 3D MAPSS sequence. Regions of interest were analyzed to measure T1ρ values centrally within phantoms to evaluate effects of pulse sequence and agarose concentration. In patellar specimens, ROI’s were analyzed to measure T1ρ values with respect to anatomic location (the medial and lateral facets, and the median ridge in deep and superficial halves of the cartilage) as well as location that exhibited magic angle effect in proton density weighted images) to evaluate the effects of pulse sequence, anatomical location and magic angle.
Results
In phantoms, T1ρ values were similar (p=0.9) between sequences but decreased significantly (p<0.001) from ~55 to ~29 ms, with increasing agarose concentration from 2% to 4%. In cartilage specimens, T1ρ values were also similar between sequences (p=0.3) but were significantly higher (p<0.001) in the superficial layer (95~120 ms) compared to the deep layer (45~75 ms).
Conclusion
T1ρ measurements of human patellar cartilage specimens and agarose phantoms using 2D spiral and 3D MAPSS sequences gave similar values. Lower T1ρ values of higher concentration phantoms, and deeper layer of cartilage where proteoglycan concentration is higher than superficial layer, suggests sensitivity of our methods to concentration of macromolecules in biological tissues.
INTRODUCTION
There has been a growing awareness that osteoarthritis (OA) is a major public health issue, responsible for significant decreases in quality of life, decreases in workforce productivity and the growing expenditure of health care dollars for treatment. Despite the near epidemic proportion of this disease, the pathogenesis remains poorly understood. To this end, techniques that allow for the non-invasive detection of early changes in OA, including biochemical alteration in articular cartilage that may occur without changes in its gross morphology, have been emphasized in the literature. Furthermore, the ability for quantitative evaluation allowing these techniques to serve as scientific outcome measures is desirable.
In the musculoskeletal system, the need for early detection of structural alteration of tissue is manifest in the concept of biochemical MR evaluation, and has been implemented for collagen and proteoglycan assessment. In the latter, T1ρ relaxation time measurements and mapping of the T1ρ values is a promising technique that is increasingly used to assess the proteoglycan distribution of human tissues such as articular cartilage [1–5]. In cartilage, increase in T1ρ values have been observed with enzymatic removal of proteoglycan [6] as well as osteoarthritis [7]. Therefore, T1ρ measurements could be useful in detecting the early stages of tissue degeneration before gross tissue loss.
There are several sequences for measuring T1ρ in human articular cartilage, each with unique advantages better suited to the particular aim of the examination. After T1ρ-preparation, images can be acquired using a 2D multi-slice spiral [8] or 3D magnetization prepared partitioned k-space spoiled gradient-echo snapshots (MAPSS) [9, 10]. The 2D sequence allows higher spatial resolution and a superior signal-to-noise ratio. However, scanning time is remarkably longer if more than one slice has to be acquired, and the sequence may suffer from indirect saturation and magnetization transfer effect. 3D MAPSS sequence allows faster volume acquisition and at a cost of lower signal-to-noise ratio. Additionally, there is a possibility that T1ρ image contrast can be affected by T1 influence due to the short repetition time [11] used in the sequence.
Magic angle effect is a well-documented phenomenon in which MR images of orderly structures exhibit angle (relative to the main magnetic field, B0)-dependent signal intensity variations. For example, signal intensity of a tendon is at a minimum when the fibrillar orientation of the tendon is parallel to B0 (0 degrees), reaches the maximum at angle of 55 or 135 degrees to B0, and has a local minima at 90 degrees to B0 [12]. Since the same tissue can exhibit different signal intensity depending on its orientation within the scanner, understanding of the magic angle effect is important for proper diagnosis of MR images. The magic angle effect also results in similar angle-dependent variations in T2 properties of tendon [12–14] and articular cartilage [15]. T1ρ properties may also be subjected to the same phenomenon, but this has yet to be investigated in depth.
It would be useful to compare the two sequences to determine if T1ρ values are sequence-dependent, prior to clinical implementation. Thus, the main purpose of our study was to compare T1ρ-measurements using a 2D multi-slice spiral and 3D MAPSS technique in agarose phantoms and human articular cartilage.
MATERIALS AND METHODS
Sample Preparation
Preparation of Agarose Phantoms
The agarose phantoms consisted of 4 ml of agarose gel (Agarose Type I - low electroendosmosis (EEO), Sigma-Aldrich Co., St. Louis MO, USA) produced according to the usage instructions provided by the manufacturer and placed in a 15ml plastic centrifuge tube (CentriStar, Corning Life Sciences, Lowell, MA, USA). The agarose powder was sprinkled into a 50 ml flask (Pyrex Vista No. 70980) filled with distilled water while stirring to prevent clumping. Then, the solution was brought to a boil and allowed to boil for 10 minutes stirring continuously, until the agarose powder dissolved completely. Then hot distilled water was added to return the contents to the original weight. Finally, the mixture was allowed to cool to 50–55°C and filled in the centrifuge tubes. The phantoms had an agarose concentration of the 2%, 3%, and 4%, respectively, and were scanned at room temperature.
Preparation of Cadaveric Cartilage Samples
The institutional review board exempted our cadaveric study and informed consents were not required. Five non-embalmed cadaveric patella specimens (Figure 1) were harvested and used according to institutional guidelines. Immediately after removal, all specimens were stored in a freezer at −70°C. The specimens were cut at 5 mm slice thickness in the axial plane using a precision saw with diamond blade (IsoMet Low Speed Saw, Buehler Ltd., Lake Bluff, IL). From each specimen the two central axial slices of the patella were selected for a total of 10 slices of osteochondral samples. Then, the chips were mounted in a 20 ml syringe filled with perfluorocarbon. Before scanning the specimens were allowed to thaw for at least 24 hours and stored in a refrigerator at 5°C. Scanning was performed at room temperature.
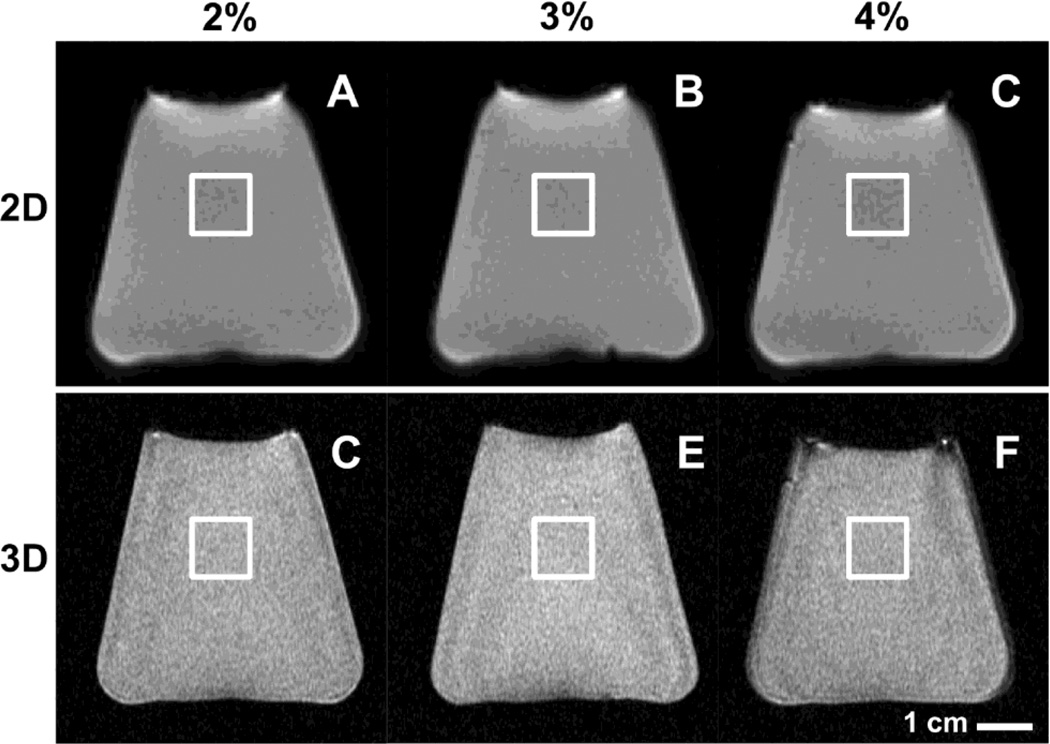
Fig. 1.
MR images of agarose phantoms obtained using 2D spiral (A, B, C) and 3D MAPSS (D, E, F) sequences. Phantoms were created by dissolving agarose powder in deionized water at concentrations of 2% (A, C), 3% (B, D) or 4% (C, E) by weight. For analysis, rectangular regions of interest in near the center of the image were created as shown.
MR Imaging
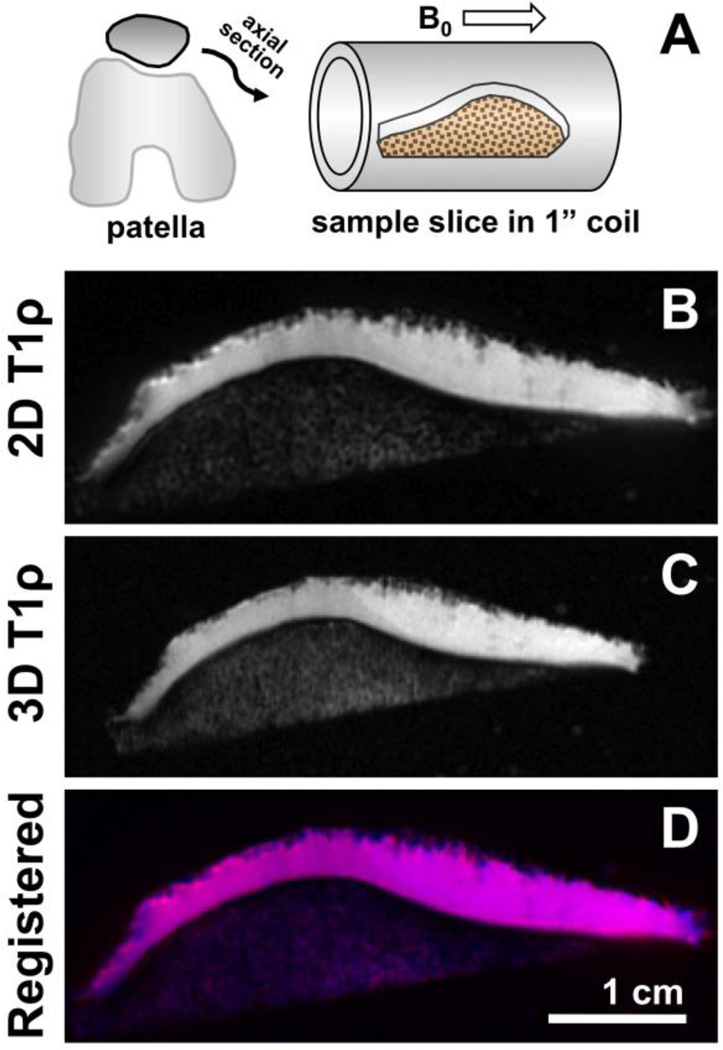
MRI was performed with a 3T MRI system (Signa HDx, GE Healthcare, Waukesha, WI, USA). For agarose phantoms, sample flasks were placed one at a time into a 6” GE quadrature knee coil and imaged (Figure 1) sagittally through the center of the flask. For patellar samples, a single-channel, transmit and receive, custom-built quadrature birdcage coil by Probe TEK (San Diego, CA) with an inner diameter of 2.5 cm (1 inch) and a length of 10 cm was used. Each sample was placed inside the coil with its mediolateral axis (long axis) parallel to the main magnetic field B0 (Figure 2A).
Fig. 2.
For MR imaging of cartilage samples, axially-sliced specimens were placed into 1“ diameter birdcage coil and imaged using 2D spiral and 3D MAPSS sequences (A). The 2D (B) and 3D (C) T1ρ images were spatially-registered using custom Matlab routine. A composite image shows 2D image in red, 3D image in blue, and the overlapping region in cyan (D).
In order to compare the two sequences, mean signal-to-noise ratio (SNR) and mean signal-to-noise efficiency (SNRE) were calculated. For the calculation of SNRE the following formula was used:
Three sequences were used to image each sample in its cut plane (axial). First, a proton density weighted and fat suppressed (PDFS) fast spin echo sequence was used to obtain an anatomic image: repetition time (TR) = 2300 ms; echo time (TE) = 18 ms; slice thickness = 1 mm, field of view (FOV) = 5 cm, matrix size = 512 × 512, echo train length = 7, number of excitations (NEX) = 2. Two T1ρ sequences were then performed: a 2D multi-slice spiral (TR = 1500 ms; TE = 5.8 ms; spin lock frequency = 500 Hz, 6 spin lock times (TSL) = 0, 10, 20, 40, 60, and 80 ms; NEX = 2; 1024 points per spiral arm × 85 arms; slice thickness = 2.4 mm; FOV = 5 cm; flip angle = 90°; BW = ±125k Hz, scanning time = 27 min) and a 3D MAPSS sequences (TR = 19.3ms; TE = 3.4ms; spin lock frequency = 500Hz; TSL = 0ms, 20ms, 40ms, 80ms; views per partition = 64; T1 recovery time = 800 ms; NEX = 2; matrix = 256×256; slice thickness = 2.4 mm; FOV = 6 cm; BW = ±41kHz; scanning time = 35 min) technique. All images were saved in a PACS system, exported and saved in DICOM format.
Image Analysis and T1ρ Measurement
Agarose Phantoms
Rectangular regions of interest, ~1 cm2 in area, were placed near the center of the MR image of each phantom (Figure 1). To determine T1ρ values within each ROI, signal intensity of all voxels were averaged and then fit using a nonlinear least square fitting routine (Matlab R2008a, MathWorks, Natick, MA) to the following equation:
where SI is the averaged signal intensity values, TSL is the spin lock times, and S0 and T1ρ are the parameters to be determined.
Cartilage Samples
In order to place ROI accurately in comparable regions in both 2D (Figure 2B) and 3D (Figure 2C) MR images, spatial registration was first performed using a custom routine in Matlab. Dicom images from each set (obtained at spin lock time of 0 ms) were imported and processed (a Canny filter) to determine the boundary of articular cartilage. The boundary images were compared visually to select control points (to provide initial guesses), cross-correlated [16] to locally register control points, and determine a transform matrix assuming rigid-body translation, rotation, and scaling. Using the transformation matrix, all 3D images were transformed to match that of 2D images (Figure 2D).
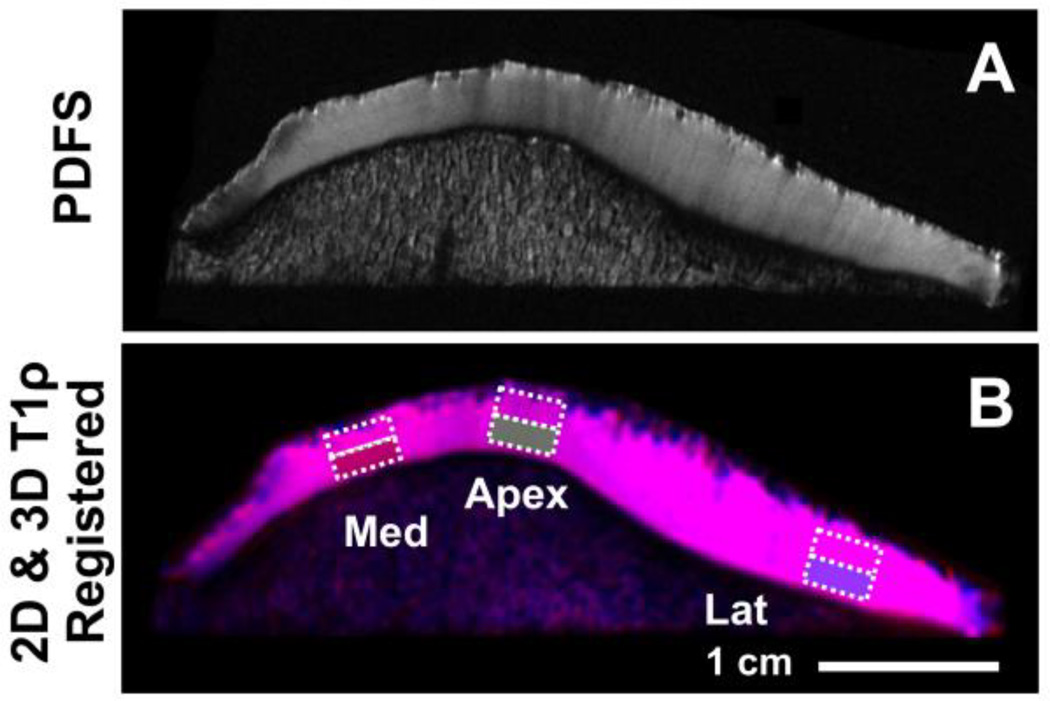
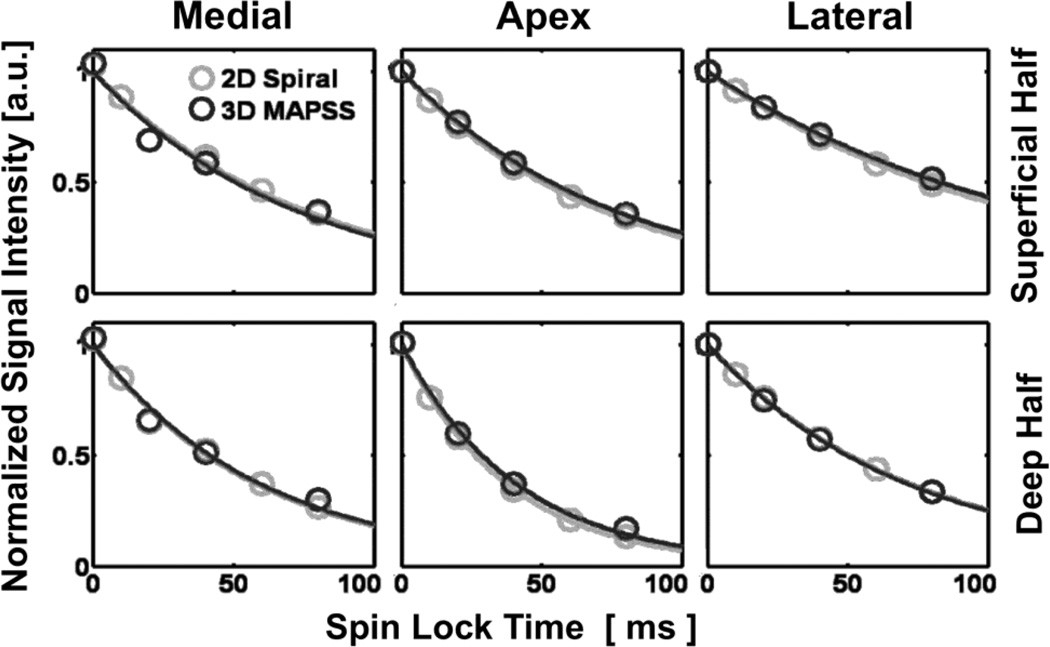
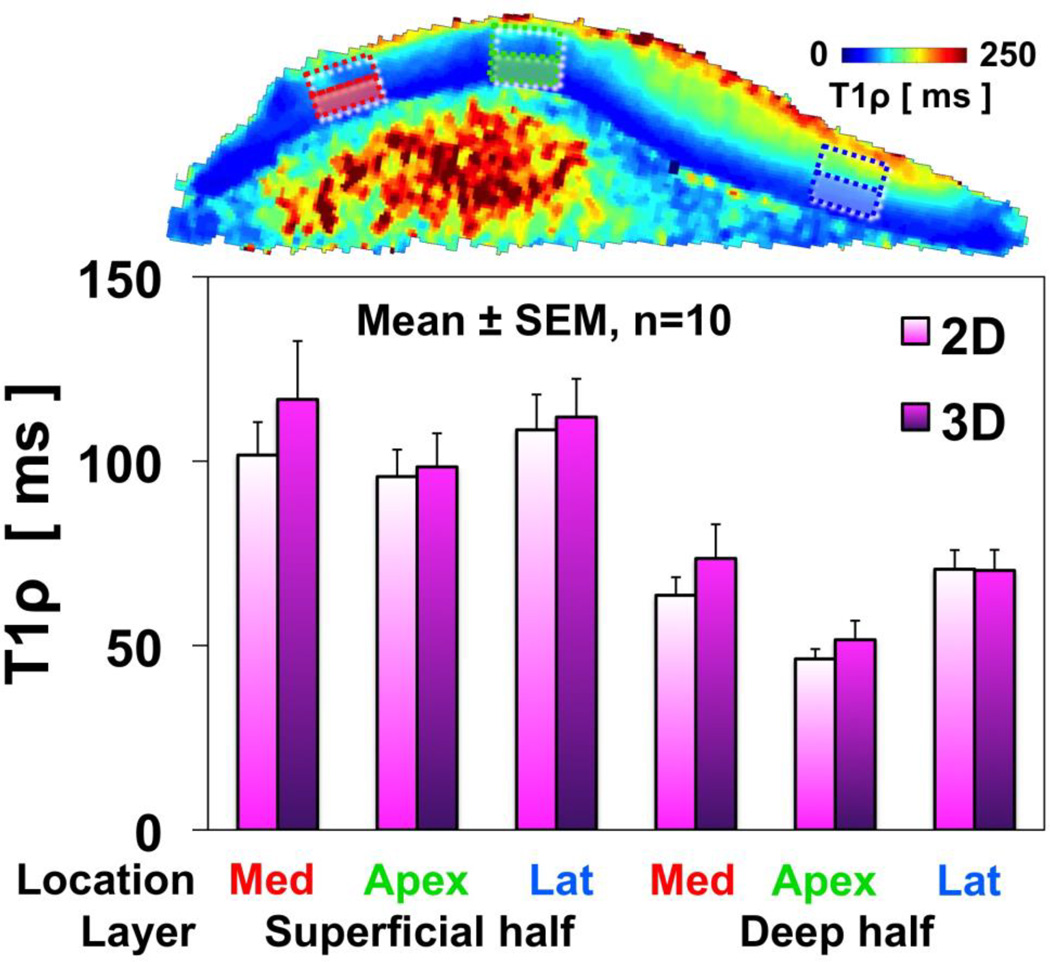
ROI were selected in 3 regions of patellar samples, one in each of the medial facet, the median ridge, and the lateral facet. Specifically, these regions were chosen based on the presence of magic angle effect in PDFS images (Figure 3A) certain sub-regions of the medial and lateral facets almost always exhibited brighter signal than adjacent regions; in contrast, the median ridge exhibited lower signal than the facets. A musculoskeletal radiologist (initials blinded with 10 years of experience) identified and marked such sub-regions. Based on this, rectangular ROIs 4 mm wide by full thickness (excluding the superficial- and deep-most 10% to avoid signal void of the bone and artifacts due to surface air bubbles, if any) were placed semi-automatically with user input (Figure 3B). The ROIs were further divided transversely in half, to separate superficial and deep layers, for a total of 6 ROIs per sample. T1ρ value for each ROI was determined by using the same method (i.e., mono-exponential fitting, Figure 4) described above for the phantom measurements.
Fig. 3.
For placement of regions of interest (ROI), proton density-weighted fast spin echo images were evaluated by a radiologist (initials blinded) to determine three regions (in medial and lateral facets, and the apex) showing strong magic angle effect (A), and rectangular ROI, 4 mm wide by ~full thickness divided into superficial and deep halves, were then placed in the selected regions on 2D and 3D T1ρ MR images (B).
Fig. 4.
Mono-exponential fitting in all regions of interest in cartilage T1ρ images was good regardless of the pulse sequence, anatomic region, or the tissue layer.
Statistics
Agarose Phantoms
To determine the effect of 2D or 3D sequence on the phantoms’ T1ρ values, paired t-test was used with significant α=0.05 (Systat 10, Systat Software, Chicago, IL).
Cartilage Samples
To determine the effect imaging sequence (2D or 3D), cartilage layer (superficial or deep half), and magic angle/anatomic region (~55° to Bo/medial facet, ~90°/apex, ~135°/lateral facet) on the T1ρ values articular cartilage, a 3-way repeated measures ANOVA was performed with significant α=0.05. To determine degree of agreement between 2D and 3D results, intraclass correlation and Bland-Altman plot analyses were performed.
RESULTS
Acquisitions using the 2D sequence had a mean SNR of 41.332 and a mean SNRE of 4.815. Mean SNR using the 3D sequence was 32.531, and SNRE was 5.364.
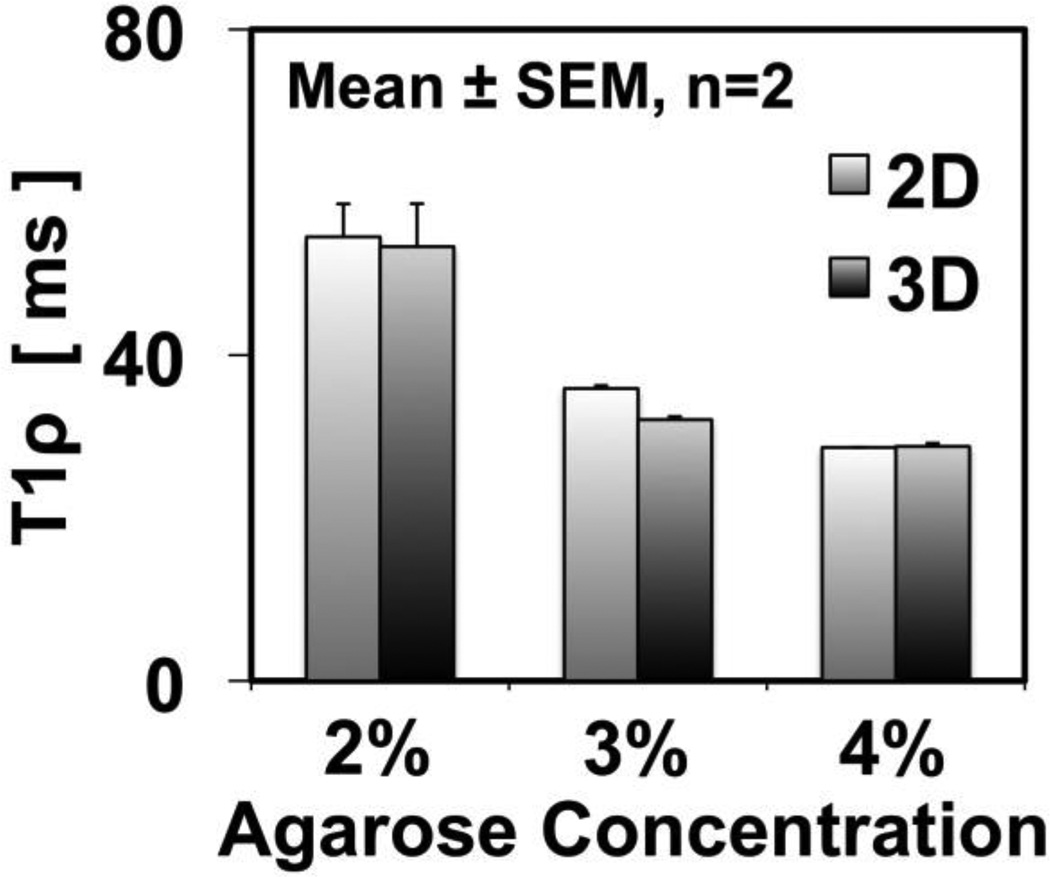
T1ρ values (Figure 5) of the agarose phantoms varied with concentration (p<0.001) but not with the sequence used (p=0.9). For both 2D and 3D sequences, T1ρ values decreased from ~55 to ~29 ms, with increasing agarose concentration from 2% to 4%. For all concentrations, T1ρ values were similar; for example, 2% phantoms had average values of 54.5 ± 4.0 and 53.3 ± 5.3 ms using 2D and 3D sequences, respectively.
Fig. 5.
T1ρ measurements in agarose phantoms showed no difference between the 2D and 3D pulse sequences. T1ρ values were lower when the concentration of agarose was higher in the phantom.
T1ρ values (Figure 6) of cartilage samples varied between superficial and deep layers (p<0.001) but not between sequences (p=0.3). For both 2D and 3D sequences, T1ρ values in the superficial layer were 95~120 ms, while those in the deep layer were marked lower, at 45~75 ms. There was a trend (p=0.15) of lower T1ρ values in the median ridge location (where the majority of collagen fibrils are positioned ~90° to the main magnetic field), compared to locations on the medial and lateral facets where the collagen fibrils are positioned ~55° and ~135° to the main magnetic field. This trend was more prominent in the deep layer; for both 2D and 3D sequences, apex region had T1ρ value of 45~50 ms, whereas the regions from the medial and lateral facets had values of 70~75 ms.
Fig. 6.
T1ρ measurements in cartilage specimens showed no difference between the 2D and 3D pulse sequences. T1ρ values were lower in the deep layer than the superficial layer, where proteoglycan concentration is relatively low. There was a trend of lower T1ρ values in the apex region of the patella, but higher values in the medial and lateral facets, suggesting a possible magic angle effect.
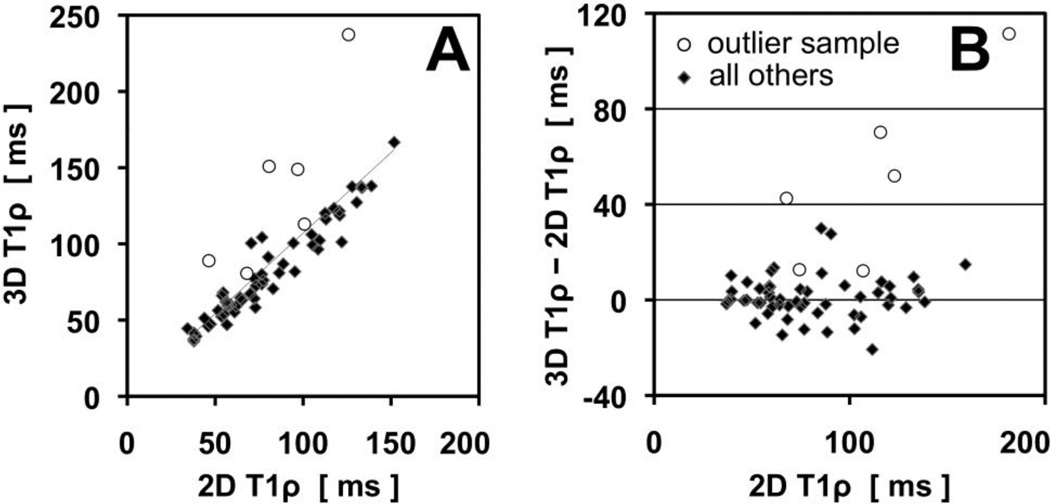
Intraclass correlation analysis (Figure 7A) showed strong correlation (cronbach’s alpha=0.91, intraclass correlation coefficient=0.93) between 3D and 2D T1ρ values. Most of the data (diamond) shows strong agreement and no bias, while one outlier sample (open circle) tended to have higher 3D T1ρ values. Without the outlier data, the correlation coefficients increase to ~0.97. Bland Altman plot (Figure 7B) showed that, for most of the data, the residual was centered about zero and thus there was no bias of the 3D sequence to give higher T1ρ values than the 2D sequence. The residual values were typically <15 ms.
Fig. 7.
Intraclass correlation (A) and Bland-Altman plot (B) of 3D and 2D T1ρ values. Most of the data (diamond) shows strong agreement and no bias, while one outlier sample (open circle) tended to have higher 3D T1ρ values.
DISCUSSION
Our study represents the first study to compare effects of 2D spiral and 3D MAPSS sequences on quantitative T1ρ properties of human articular cartilage.
The 2D spiral sequence had a higher SNR but lower SNRE compared to the 3D MAPSS sequence. Therefore, the 2D spiral sequence should be better suitable for T1ρ quantification. However, the 2D spiral sequence is lower in resolution and the SNR is not very much higher than in the 3D MAPSS sequence.
Our results demonstrated that T1ρ values of agarose phantoms (Figure 5) and articular cartilage (Figure 6) were not different regardless of the pulse sequence used, and were not confounded with other factors such as tissue layer (superficial or deep) or anatomic location (medial and lateral facets, and apex of patella). This was further confirmed in intraclass correlation analysis (Figure 7A) and Bland Altman plot (Figure 7B), which suggested repeatability of the measurements and the lack of bias. Thus the 2D and 3D sequences evaluated in our study may be used interchangeably and yield similar quantitative measures of articular cartilage.
The variation of T1ρ values with agarose concentration (Figure 5) and between superficial and deep half layers of cartilage (Figure 6) are consistent with past works and may reflect sensitivity of T1ρ parameter to biochemical composition of the sample. In the study by Li et al. [17], T1ρ values of agarose phantoms decreased from 78 ms to 45 ms (42% decrease) as the concentration of agarose increased from 2% to 4%. In our study, a similar decrease of ~47% (55 ms to 29 ms for 2% to 4% agarose phantoms, respectively) was found. The discrepancy in the actual values may be due to a number of factors, including the difference in the field strength and imaging parameters such as spin locking frequency. The dependence of T1ρ values to agarose concentration is an evidence that T1ρ sequences are sensitive to spin-lattice energy exchange between water and large molecules, such as agarose or proteoglycans in articular cartilage. The high and low values of T1ρ in the superficial and deep layers of cartilage, respectively, are consistent with this finding, since the glycosaminoglycan (a main component of proteoglycan) concentration in the superficial layer is about half of that in the deep layer [18], as well as past T1ρ studies [19, 20].
Regional variations in T1ρ may be due to magic angle effect as well as intrinsic anatomic variations in MR properties. Although they failed to reach statistical significance, the trend of higher T1ρ values in the medial and lateral facets of patella (where the radially-oriented collagen fibrils were at the “magic angle” with B0) compared to the median ridge region (oriented orthogonal to B0) suggested that T1ρ values may be affected by the magic angle effect [12, 13, 21]. It is possible that the effect may be confounded with other factors such as intrinsic anatomic variations, as well as degeneration-related changes in MR properties.
From the standpoint of clinical application the 3D MAPSS sequence may be useful for global joint evaluation to look at compartmental changes in cartilage for instance in the setting of meniscectomy (to see effects in cartilage), or in the setting of therapy monitoring (follow potential response to viscosupplementation and so on). The 2D method may be nicely suited to follow a single chondral lesion, or focus of chondral repair where evaluation of the entire joint may not be needed. In addition, 2D spiral sequence is probably better when only a few slices are needed because the 3D MAPSS sequence works best when there are a relatively large number of slices so that the segmented elliptic-centric acquisition strategy can be effective. While 3D is better when volumetric coverage is needed. 2D spiral suffers from slice-profile problem, image blurring due to long readout window, and most importantly much more sensitive to eddy currents.
There are some limitations of our study that should be mentioned. We presented the results of an in vitro cadaveric study; results may be different in vivo due to any number of reasons such as different hardware (coil) requirement, tissue temperature, and the presence of surrounding tissues. Although our image registration yielded optimal results to overlap 2D and 3D images, minor regions of misregistration remained. However, given relatively large size of ROI used, this may not have been a problem for the majority of samples (at least one sample, open circle in Figure 7, seemed to have a problem due to misregistration and/or poor selection of slice from 3D data). Cadaveric samples were from donors with relatively advanced age, and showed mild to moderate gross degeneration, which may partially explain relatively high values of T1ρ (~50 to 120 ms) compared to values found (~40 to 50 ms) in some studies [9, 22], but not others (~80 to 160 ms) [19].
In conclusion, T1ρ measurements of human patellar cartilage specimens and agarose phantoms using 2D multi-slice spiral and 3D MAPSS sequences gave similar values and may both be used to obtain similar quantitative results. Lower T1ρ values of higher concentration phantoms, as well as deeper layers of cartilage where proteoglycan concentration is higher than superficial layer, suggests sensitivity of T1ρ MR imaging to concentration of macromolecules in biological tissues. The sequences evaluated in our study may be affected by the magic angle effect, but this remains to be evaluated further. T1ρ measurements may be useful in detecting the early stages of cartilage degeneration, and ultimately, providing surrogate measures of important matrix constituents before morphologic changes.
Acknowledgment
Our special thanks go to Prof. Xiaojuan Li, MD, of the Department of Radiology, University of California San Francisco for her support concerning agarose phantom measurements. This investigation was supported by the Swiss National Science Foundation and the Swiss Radiological Society.
References
- 1.Akella SV, Regatte RR, Gougoutas AJ, et al. Proteoglycan-induced changes in T1rho-relaxation of articular cartilage at 4T. Magn Reson Med. 2001;46:419–423. doi: 10.1002/mrm.1208. [DOI] [PubMed] [Google Scholar]
- 2.Duvvuri U, Reddy R, Patel SD, Kaufman JH, Kneeland JB, Leigh JS. T1rho-relaxation in articular cartilage: effects of enzymatic degradation. Magn Reson Med. 1997;38:863–867. doi: 10.1002/mrm.1910380602. [DOI] [PubMed] [Google Scholar]
- 3.Regatte RR, Akella SV, Borthakur A, Kneeland JB, Reddy R. In vivo proton MR three-dimensional T1rho mapping of human articular cartilage: initial experience. Radiology. 2003;229:269–274. doi: 10.1148/radiol.2291021041. [DOI] [PubMed] [Google Scholar]
- 4.Wheaton AJ, Borthakur A, Kneeland JB, Regatte RR, Akella SV, Reddy R. In vivo quantification of T1rho using a multislice spin-lock pulse sequence. Magn Reson Med. 2004;52:1453–1458. doi: 10.1002/mrm.20268. [DOI] [PubMed] [Google Scholar]
- 5.Wheaton AJ, Dodge GR, Elliott DM, Nicoll SB, Reddy R. Quantification of cartilage biomechanical and biochemical properties via T1rho magnetic resonance imaging. Magn Reson Med. 2005;54:1087–1093. doi: 10.1002/mrm.20678. [DOI] [PubMed] [Google Scholar]
- 6.Regatte RR, Akella SV, Borthakur A, Kneeland JB, Reddy R. Proteoglycan depletion-induced changes in transverse relaxation maps of cartilage: comparison of T2 and T1rho. Acad Radiol. 2002;9:1388–1394. doi: 10.1016/s1076-6332(03)80666-9. [DOI] [PubMed] [Google Scholar]
- 7.Regatte RR, Akella SV, Wheaton AJ, et al. 3D-T1rho-relaxation mapping of articular cartilage: in vivo assessment of early degenerative changes in symptomatic osteoarthritic subjects. Acad Radiol. 2004;11:741–749. doi: 10.1016/j.acra.2004.03.051. [DOI] [PubMed] [Google Scholar]
- 8.Han ET, Busse RF, Li X. ISMRM. Miami Beach, FL, USA: 2005. 3D segmented elliptic-centric spoiled gradient echo imaging for the in vivo quantification of cartilage T1rho; p. 473. [Google Scholar]
- 9.Li X, Benjamin Ma C, Link TM, et al. In vivo T(1rho) and T(2) mapping of articular cartilage in osteoarthritis of the knee using 3 T MRI. Osteoarthritis Cartilage. 2007;15:789–797. doi: 10.1016/j.joca.2007.01.011. [DOI] [PMC free article] [PubMed] [Google Scholar]
- 10.Li X, Han ET, Ma CB, Link TM, Newitt DC, Majumdar S. In vivo 3T spiral imaging based multi-slice T(1rho) mapping of knee cartilage in osteoarthritis. Magn Reson Med. 2005;54:929–936. doi: 10.1002/mrm.20609. [DOI] [PubMed] [Google Scholar]
- 11.Borthakur A, Hulvershorn J, Gualtieri E, et al. A pulse sequence for rapid in vivo spin-locked MRI. J Magn Reson Imaging. 2006;23:591–596. doi: 10.1002/jmri.20537. [DOI] [PMC free article] [PubMed] [Google Scholar]
- 12.Fullerton GD, Cameron IL, Ord VA. Orientation of tendons in the magnetic field and its effect on T2 relaxation times. Radiology. 1985;155:433–435. doi: 10.1148/radiology.155.2.3983395. [DOI] [PubMed] [Google Scholar]
- 13.Du J, Chiang AJ, Chung CB, et al. Orientational analysis of the Achilles tendon and enthesis using an ultrashort echo time spectroscopic imaging sequence. Magn Reson Imaging. 2009 doi: 10.1016/j.mri.2009.06.002. [DOI] [PubMed] [Google Scholar]
- 14.Du J, Pak BC, Znamirowski R, et al. Magic angle effect in magnetic resonance imaging of the Achilles tendon and enthesis. Magn Reson Imaging. 2009;27:557–564. doi: 10.1016/j.mri.2008.09.003. [DOI] [PubMed] [Google Scholar]
- 15.Xia Y. Relaxation anisotropy in cartilage by NMR microscopy (muMRI) at 14-microm resolution. Magn Reson Med. 1998;39:941–949. doi: 10.1002/mrm.1910390612. [DOI] [PubMed] [Google Scholar]
- 16.Chu TC, Ranson WF, Sutton MA, Peters WH. Applications of digital image correlation techniques to experimental mechanics. Exp Mech. 1985;25:232–244. [Google Scholar]
- 17.Li X, Han ET, Newitt D, Majumdar S. T1rho relaxation quantification using spiral imaging: a preliminary study. Conf Proc IEEE Eng Med Biol Soc. 2004;2:1032–1035. doi: 10.1109/IEMBS.2004.1403339. [DOI] [PubMed] [Google Scholar]
- 18.Maroudas A, Muir H, Wingham J. The correlation of fixed negative charge with glycosaminoglycan content of human articular cartilage. Biochim Biophys Acta. 1969;177:492–500. doi: 10.1016/0304-4165(69)90311-0. [DOI] [PubMed] [Google Scholar]
- 19.Regatte RR, Akella SV, Lonner JH, Kneeland JB, Reddy R. T1rho relaxation mapping in human osteoarthritis (OA) cartilage: comparison of T1rho with T2. J Magn Reson Imaging. 2006;23:547–553. doi: 10.1002/jmri.20536. [DOI] [PubMed] [Google Scholar]
- 20.Menezes NM, Gray ML, Hartke JR, Burstein D. T2 and T1rho MRI in articular cartilage systems. Magn Reson Med. 2004;51:503–509. doi: 10.1002/mrm.10710. [DOI] [PubMed] [Google Scholar]
- 21.Mlynarik V, Szomolanyi P, Toffanin R, Vittur F, Trattnig S. Transverse relaxation mechanisms in articular cartilage. J Magn Reson. 2004;169:300–307. doi: 10.1016/j.jmr.2004.05.003. [DOI] [PubMed] [Google Scholar]
- 22.Pakin SK, Schweitzer ME, Regatte RR. 3D-T1rho quantitation of patellar cartilage at 3.0T. J Magn Reson Imaging. 2006;24:1357–1363. doi: 10.1002/jmri.20733. [DOI] [PubMed] [Google Scholar]


