

Supplemental Digital Content is available in the text.
Key Words: health utility, health preference, time trade-off, EQ-5D-5L, value set
Abstract
Background:
The 5-level version of the EQ-5D (EQ-5D-5L) was recently developed. A number of preference-based scoring systems are being developed for several countries around the world.
Objective:
To develop a value set for the EQ-5D-5L based on societal preferences in Canada.
Methods:
We used age, sex, and education quota sampling from the general population from 4 cities across Canada. Composite time trade-off (cTTO) and traditional time trade-off (tTTO) were used as the main elicitation technique. A total of 86 EQ-5D-5L health states grouped into 10 blocks were valued using cTTO, whereas a subset of 18 severe states was also valued using tTTO. Participants meeting predefined inconsistency criteria were excluded from the analyses. For the value set development, we used tTTO and positive cTTO values, while censoring negative and zero cTTO values at zero. Models with the main effects presented using linear terms combined with various additional terms were estimated. The preferred model was selected based primarily on logically ordered coefficients, and secondly model fit.
Results:
Of the 1209 participants who completed the interview, 136 met criteria that excluded them from the primary analyses. The demographics and socioeconomic status of the remaining 1073 participants were similar to the Canadian general population. The preferred model has 5 linear terms for the main effects, a term for level 4 or 5 for each dimension, and a term for the squared total number of level 4 or 5 beyond the first. For this preferred model, the health utilities ranged from −0.148 for the worst (55555) to 0.949 for the best (11111) EQ-5D-5L states.
Conclusions:
This is the first TTO-based value set of the EQ-5D-5L for Canada. It can be used to support the health utility estimation in economic evaluations for reimbursement decision making in Canada.
Canada was one of the first countries that required economic evaluation to inform drug and health technology reimbursement decision making in the 1990s.1,2 The latest economic evaluation guidelines by the Canadian Agency for Drugs and Technologies in Health (CADTH) recommend that preference-based measures be used to capture the meaningful change in health-related quality of life among alternative treatments.3
Preference-based measures are typically comprised of 2 components: a descriptive system that is used to define health states and a scoring algorithm to assign health utility to those health states (also known as “value set”). A few established preference-based measures such as the Health Utility Index, the Short Form 6D, and the EuroQol 5D (EQ-5D) are identified in the CADTH guidelines, with no explicit preference among these measures. Instead, the CADTH guidelines state that “a representative sample of the general public, suitably informed, is the preferred source for preferences.”3
The EQ-5D is a prominent example of preference-based measures developed by the EuroQol Group.4 It has been suggested to be the most widely used preference-based measures in the world.5,6 The EQ-5D consists of 5 dimensions: mobility (MO), self-care (SC), usual activities (UA), pain/discomfort (PD), and anxiety/depression (AD). In the original version, each dimension has 3 response options for no (level 1), some (level 2), and extreme problems (level 3).4 A unique health state can be described using a 5-digit vector formed according to the responses to the 5 questions. For example, no problems in MO, SC, and UA, but some problem in PD and extreme problem in AD can be referred to as “11123.” To improve the descriptive richness and discriminatory power of the EQ-5D, a new version was recently developed, keeping its original 5 dimensions, but expanding the response options from 3 to 5 levels (hereafter referred as the EQ-5D-5L) to reflect no, slight, moderate, severe, and extreme problems.7 The EQ-5D-5L now defines a total of 3125 health states compared with only 243 from the 3-level version. The EQ-5D-5L descriptive system has been formally translated and validated into Canadian English and French. Although a value set exists for the 3-level version,8 no values exist in Canada for the 5-level version. The primary objective of this study (the Canadian EQ-5D-5L Valuation Study) was to develop a value set for this instrument for Canada.
METHODS
Study Overview
This study was a multicenter, population-based study, using face-to-face interviews with assistance of the EuroQol Valuation Technology (EQ-VT), a computerized survey software recently developed by the EuroQol Group.9 According to a multicountry pilot study, it was determined that the recommended total sample size for using the EQ-VT is 1000 per country and the total number of health states included for time trade-off (TTO) is 86, allowing for the estimation of 50 parameters with acceptable precision.9 We used a quota sampling to select a sample representative in terms of age, sex, and education status from the wider Canadian general population. Participant recruitment was conducted primarily through random dialing of published landline telephone numbers within each of the recruitment areas and supplemented by publically posted recruitment flyers. English-speaking participants were recruited from the greater metropolitan areas of Hamilton, Vancouver, and Edmonton, 3 populous cities located in Ontario (east), British Columbia (west), and Alberta (central west, a prairie province) in Canada, respectively, whereas French-speaking participants were recruited in Montreal.
Interview Process
The first module of the EQ-VT asked the participants to complete the EQ-5D-5L according to their own health status and provide their age and sex. Each participant was then familiarized with the tasks and the on-screen elements by going through a practice example with the interviewer. The second module was the composite TTO (cTTO) tasks10 for 1 randomly assigned block of 10 health states presented in a random order. The last module of the EQ-VT was the Canada-specific demographic questions. The evidence and experience in using cTTO to value health states were limited at the time of designing this valuation study. Therefore, we also used traditional TTO (tTTO) to supplement the EQ-VT as tTTO has been the primary technique in the EQ-5D value set development. After the completion of the EQ-VT, each participant was asked to also complete a tTTO task for 2 severe health states selected from the 10 states previously valued with the cTTO.
Preference Elicitation Techniques
cTTO and tTTO are identical in valuing health states better than dead, but differ in how they value worse than dead states. For health states better than dead, it presents 2 options: 10 years in full health (life A) or 10 years in an impaired health state (ie, a state with any problem in any dimension) (life B). No specific definition or elaboration of the term “full health” was provided in the EQ-VT. Although the 10 years in life B is fixed, the number of years in life A is varied according to the participant’s previous choice. If the participant prefers life A, the number of years in life A will be changed to zero. Then if life B is preferred, the number of years in life A will be changed to 5 years and so on until an indifferent point is reached. If participants still prefer life A when the number of years in life A is zero (meaning life B is considered worse than dead), cTTO then uses a lead time TTO (LT-TTO) with 10 years in full health attached to both life A and life B. Therefore the LT-TTO starts with life A being 10 years in full health followed by death and life B being 10 years in full health followed by 10 years in the impaired state and then death. The participant continues to trade-off the 10 years lead time in life A to avoid living in life B using the same iterative process until an indifferent point is reached. If an indifferent point is reached at 0 years in life A (ie, the additional 10 years in full health are traded off), the final TTO value is calculated at −1, the lowest possible values from the cTTO. For states worse than dead, tTTO presents a choice between life A, which is living in the impaired state for 5 years followed by 5 years in full health and then death, and life B, which is immediate death. The number of years living in the impaired state varied according to previous response. For example, if life A is preferred to life B, then life A will be changed to 6 years in the impaired state followed by 4 years in full health and then death, so on and so forth, until the participant indicates there is no difference between life A and life B.
Health State Selection
The 86 health states included 5 very mild states with only 1 dimension at level 2 (ie, 21111, 12111, 11211, 11121, and 11112) and the worst state 55555.9 The remaining 80 health states were selected to cover a wide range of severity. The 86 health states were grouped into 10 blocks with 10 health states per block.9 One very mild state and the worst state (55555) were included in every block. Of the 10 health states in each block, 2 most severe health states (including 55555) were selected for tTTO by the study team, with 55555 being selected as 1 of the 2 severe states in 3 blocks (as 55555 was valued by all participants in the cTTO). Thus, the number of unique health states is 20−2=18 in tTTO. These states were 24445, 24553, 34155, 34515, 35245, 43555, 44345, 44553, 45413, 52455, 53244, 53412, 54153, 54342, 55225, 55233, 55424, and 55555.
Participant Exclusion Criteria
We excluded the participants with inconsistent responses. If a health state is better in at least 1 of its constituent dimensions and no worse in the remaining dimensions than another health state, the former dominates the latter (eg, 21111 vs. 31111). It is reasonable to assume that a rational person should prefer the former to the latter state. We used this principle of dominance to identify inconsistent responses.
Nonetheless, given the complexity of the TTO tasks, it was expected that some participants might exhibit some minor inconsistencies in responses. We therefore used the majority rule for exclusion due to inconsistent responses beyond simple dominance of any health state. One of the 5 very mild health states (ie, 21111, 12111, 11211, 11121, and 11112) and 55555 were included in every block. Across the 10 blocks, the number of health states that are dominated by the very mild health state varied from 5 to 8. If a participant met any of the following criteria, all TTO responses from that participant were excluded from the data analysis. The criteria were: (a) giving the same or a lower score for the very mild health state compared with 55555; and (b) giving the same or a lower score for the very mild health state compared with the majority of the health states that are dominated by the very mild health state within the same block. The definition of “majority” used here was 3 of 5/6 health states or 4 of 7/8 health states that are dominated by the very mild health state in the same block. As a result, a total of 136 participants met the exclusion criteria.
Statistical Analyses
Sample Characteristics
Descriptive statistics were used to characterize the included and excluded samples in the analysis. These samples were compared on demographics and health status measures using t tests for interval data and χ2 or Fisher exact tests for nominal data.
Preference Data
We hoped that the cTTO can overcome limitations of the tTTO in eliciting worse than dead health states, while maintaining the comparability in eliciting better than dead states with the tTTO, a primary technique used in previous 3-level EQ-5D valuation studies.9 However, some concerns arose with the cTTO in which clustering around zero and the void in the negative side had been consistently observed in data from a few countries.11–14 In our preliminary descriptive analyses, a head-to-head comparison between cTTO and tTTO valuations of selected severe health states revealed that the cTTO values are consistently higher than the tTTO values. When the cTTO uses the LT-TTO to value health states perceived as worse than dead, a 10-year in full health is attached to both life A (top of the screen) and life B (bottom of the screen). However, the participants were more likely attracted by the 10-year full health in life A than that in life B.15 As a result, they were more likely to reach an indifferent point simply due to the attachment of the 10-year lead time, which could shift the value toward the positive end of the health utility scale.16 This observation indicates that the validity of the cTTO in measuring states worse than dead might be questionable. Therefore, we decided to use all tTTO values available and positive cTTO values in the model, whereas censoring negative and zero cTTO values at zero.
Model Development
The goal was to use the observed preferences for the selected health states defined by the EQ-5D-5L descriptive system to predict health utilities for all health states. Different specifications were evaluated in the model development. The models can be generally described as follows:
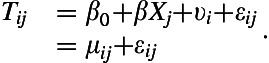 |
Where Tij is participant i’s TTO value for health state j (could come from cTTO or tTTO), X a row vector of 20 dummy variables representing level 2 to 5 for each of the 5 dimensions in health state j valued by participant i (eg, MO2, MO3, …), vi a term for random effects representing the extent to which the intercept of the ith participant deviated from the overall intercept, εij the error term, and μij the expected value of Tij. The error term was assumed to be normally distributed with zero mean and SE σ. The likelihood function was the normal probability density function for positive cTTO values or any tTTO value. When cTTO values were ≤0, the likelihood function was a cumulative normal distribution function. The contribution to the log likelihood function of subject i valuing health state j in the left censored data can be written as follows:
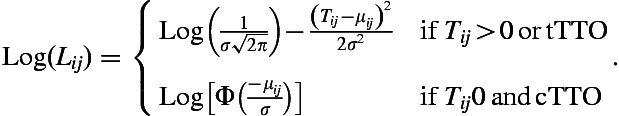 |
A sensitivity analysis was conducted by including all participants and by censoring only negative values at zero. The modeling took into account censoring and random effects and was performed using Proc NLMIXED in SAS 9.3 (SAS Institute Inc., Cary, NC).
Dependent Variable
For states better than dead, both tTTO and cTTO values were calculated using the formula x/10. For states worse than dead, cTTO values were calculated using (x−10)/10, whereas tTTO values were calculated using −x/(10−x), where x was the number of years in full health in life A at which participants indicated there was no difference between the life A and life B (0≤x≤10). Given the smallest increment was 0.5 years in the tTTO tasks, the smallest possible negative value was −19. As has been the practice in the past,17,18 a linear transformation was applied by dividing the calculated negative TTO values by 19 to have them bounded at −1. The cTTO and the tTTO values (with the above-mentioned transformation whenever applicable) were used as the dependent variable in the model.
Independent Variables
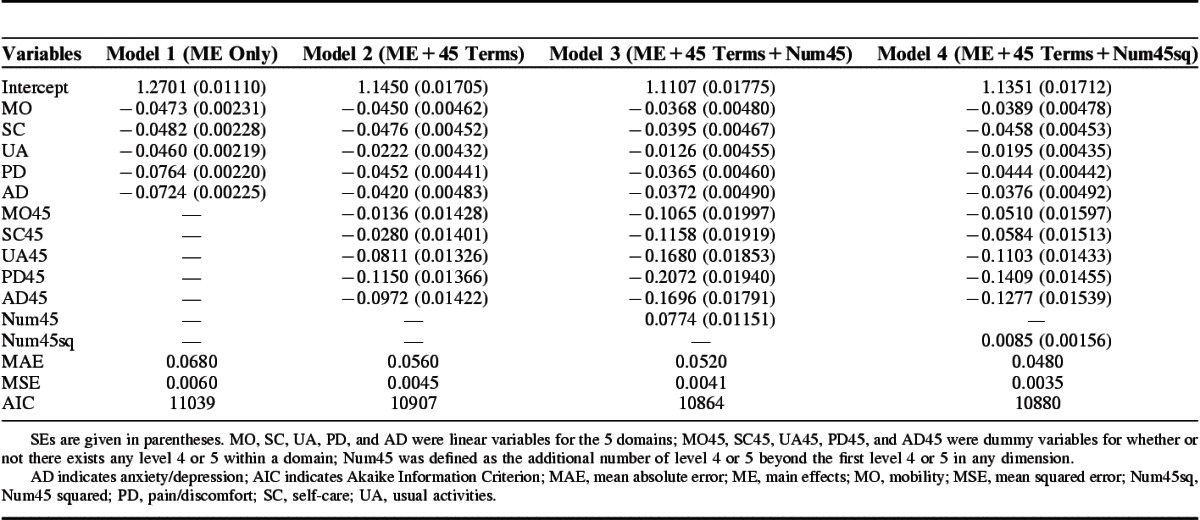
There is no established theoretical or conceptual framework on how to represent the EQ-5D health states in the modeling, and various approaches have been used for different 3-level value sets in the past. A vector of variables representing the main effects based on its descriptive system was a common start. The main effects were usually presented by using the shift between levels within each dimension. Therefore, 4 dummy variables for each dimension were defined to represent the difference between each impaired level and no impairment. For example, MO2 measures the difference between level 2 and 1, MO3 the difference between level 3 and 1, and so on, for the MO dimension. We therefore first explored a model with the main effects presented by 20 dummy variables. However, in this model, the coefficient for level 4 was lower than that for level 5 for at least 1 dimension (ie, resulted in logical inconsistency). Also the decrements associated with higher levels (ie, levels 4 and 5) were disproportionally larger than those with lower levels (eg, levels 2 and 3). We then assessed the main effect model with 1 linear term for each dimension. In addition, a few terms accounting for nonlinear effect at the higher levels were considered. Those terms included whether or not there existed any level 4 or 5 in any dimension (ie, the N45 term), the additional number of level 4 or 5 beyond the first level 4 or 5 in any dimension (ie, Num45), or any level 4 or 5 within each dimension (ie, MO45, SC45, UA45, PD45, and AD45). Despite the addition of these terms, the model still suffered from logical inconsistency in the parameter estimates for level 4 and 5 in the UA dimension. As a result, an alternative model with the main effects represented by 5 linear terms for each dimension, namely, MO, SC, UA, PD, and AD, each taking a value from 1 to 5, was estimated. The same set of above-mentioned nonlinear terms was also explored together with these linear terms.
Model Selection Criteria
A set of criteria was prespecified to select a preferred model. The first criterion was the face validity, for which the model should generate logically consistent health utilities for all EQ-5D-5L health states, such that if 1 health state dominates another health state, the value for the former should be higher than that of the latter. The second criteria were the goodness-of-fit measured by prediction errors and Akaike Information Criterion (AIC), in the order described below. If all other criteria were equal, the most parsimonious model was selected.
Prediction error is an indicator of the difference between predicted values and observed values.
Two types of prediction errors were used: mean absolute error (MAE) and mean squared error (MSE). As the purpose of the modeling was to predict health utilities for all health states, a leave-a-state-out cross validation approach was used by excluding each health state in turn from estimating the coefficients and then calculating the MAE and the MSE in predicting that omitted health state. As the negative cTTO values were considered censored in the modeling, it was not possible to calculate MAEs and MSEs for all 86 health states. Only the 18 health states that were valued using the tTTO can be used in calculating MAEs and MSEs. In addition, 4 mild health states (ie, 11122, 11212, 11221, 21111) with only positive cTTO values observed (ie, censoring zero or negative values would have no impact on these health states) were included in calculating MAEs and MSEs; again, smaller MAE/MSE are preferred. AIC was compared with take into account the balance between the model fit and the complexity of the model; a lower AIC is preferred.
RESULTS
Demographics
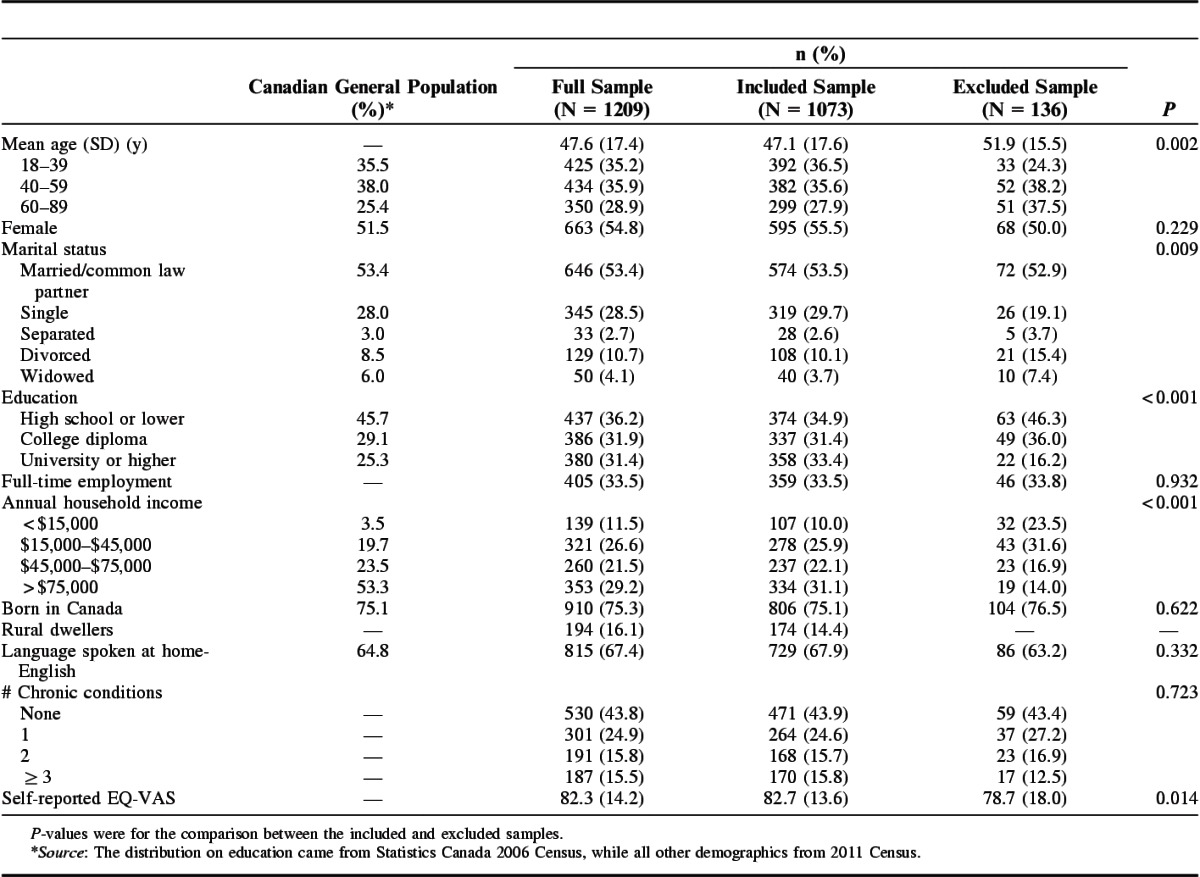
A total of 1209 participants completed the valuation study interview. Of the 1209 participants, 136 met the criteria and were excluded from the primary analyses. The mean (SD) age for the remaining 1073 participants was 47.1 (SD, 17.6) years, with 55.5% female, 53.5% married or having common law partner, and 33.5% full-time employed (Table 1). The mean EQ-visual analog scale score for the included sample was 82.7 (SD, 13.6). The demographics of the included sample by the study site are shown in Table A1. The characteristics of the included sample were similar to the Canadian general population in terms of age, sex, marital status, employment, born in Canada, and language spoken at home. Compared with the general population, the included sample was more educated, but had lower incomes. Compared with the included sample, the excluded sample was more likely to be older, divorced or widowed, have lower education, lower household income, and lower self-reported EQ-visual analog scale score (Table 1). We compared 3 education level groups in terms of the observed health state: high school or lower, college, and university or higher. There was no clear pattern across the states and most of the differences were not statistically significant.
TABLE 1.
Demographics of the Participants in the Canadian Valuation Study
Modeling Analyses
We found the cTTO values distributed more toward the positive side of the scale (Fig. 1). In contrast, there were more negative values for selected health states valued using tTTO (Fig. 1). Of the 10730 cTTO values, 2786 (25.96%) were nonpositive. The main effects model with only 1 linear term for each dimension is presented in Table 2. Given that the impact varied between the dimension levels, this model was not considered a reasonable reflection of the data. The utility decrement associated with level 4 or 5 was disproportionally higher than that associated with the lower levels. Five additional terms accounting for this larger impact (ie, MO45, SC45, UA45, PD45, AD45, collectively referred as the “45 terms”) were therefore added to the main effects model (model 2), improving fit by all the measures. However, the 5 individual terms for being at level 4 or 5 might overestimate the disutility (ie, the utility decrement associated with all dimensions at level 4 or 5 might be smaller than the sum of the utility decrement associated each level 4 or 5). Therefore, the Num45 term was added, as the 5 individual 45 terms might overestimate the overall utility decrement (model 3). This Num45 term also implied a linear relationship between the magnitude of the overestimate and the number of dimensions at level 4 or 5. It is reasonable to expect there might be a diminishing marginal effect on the magnitude of the overestimate from the five 45 terms. We therefore replaced Num45 with Num45sq in model 4, which further, albeit slightly, improved the model fit. We considered the Num45sq as a factor to correct the overestimate on utility decrement by individual 45 terms. A number of models with alternative functional forms were also tested, including terms for level 2, level 3, “55555,” and various combinations of these terms.
FIGURE 1.
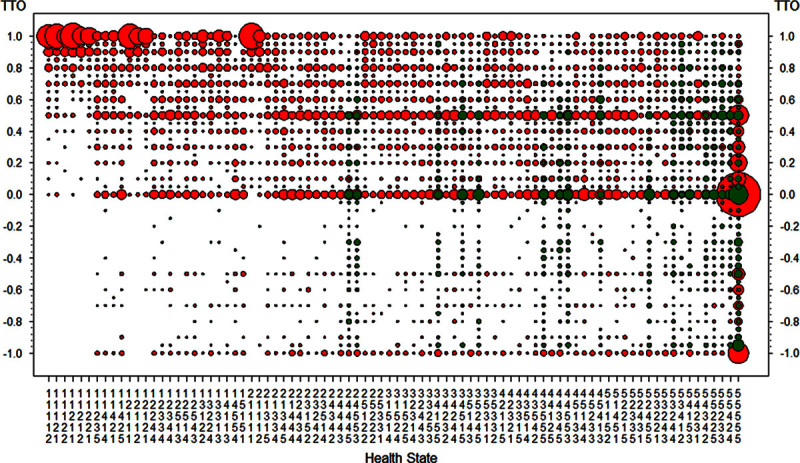
Distribution of observed tTTO and cTTO values for the 86 health states. Red circle represents observed cTTO score, whereas green circle represents observed tTTO score. The size of the circle corresponds to the frequency of the observed score. cTTO indicates composite TTO; tTTO, traditional TTO; TTO, time trade-off.
TABLE 2.
Coefficient Estimates for the Models With the Main Effects Presented in Linear Terms
Preferred Model
According to our selection criteria, model 4, with the linear terms for the main effects, a 4/5 term for each dimension, and Num45sq met our criteria of the face validity and had the best fit. Figure 2 displays the scatterplots of observed TTO values against predicted values for the 22 health states that contributed to the MAE estimation. The observed cTTO values that were not included in the MAE estimation due to censoring were also plotted for comparison only. The preferred model still had the smallest MAE in the sensitivity analyses with censoring the negative values only and including all participants. The value set produced by each model included in the sensitivity analyses is shown in Figure 3 (the corresponding coefficient estimates are showed in Table A2). For the preferred model, the health utilities range from −0.148 for the worst EQ-5D-5L state 55555 to 0.949 for the best EQ-5D-5L state 11111. An example demonstrating how to use the coefficients of the preferred model to calculate the health utilities for EQ-5D-5L health states can be found in Table A3 in the Appendix. The full value set of the EQ-5D-5L can be accessed at http://www.phenomresearch.ca or through the online supplementary file (Supplemental Digital Content 1, http://links.lww.com/MLR/B39).
FIGURE 2.
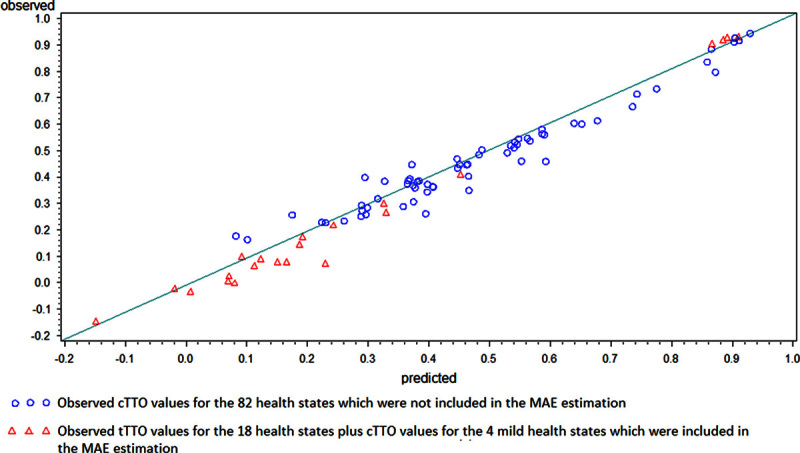
Predicted utilities versus observed utilities for the 86 health states. The green reference line represents perfect prediction for observation. cTTO indicates composite TTO; MAE, mean absolute error; tTTO, traditional TTO; TTO, time trade-off.
FIGURE 3.
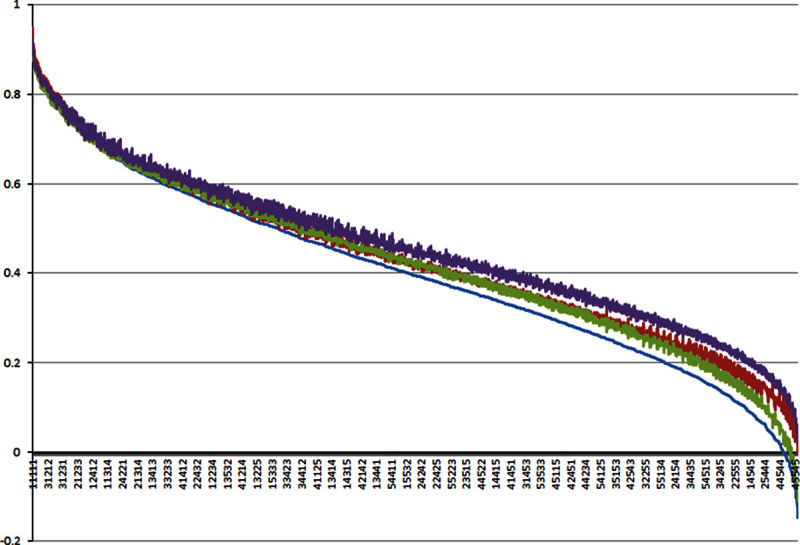
Sensitivity analyses on the inclusion criteria and censoring. Blue line: “the preferred model” that includes participants meeting the inclusion criteria and censoring nonpositive cTTO values at zero. Green line: including all participants and censoring nonpositive cTTO values at zero. Brown line: including participants meeting the inclusion criteria and censoring only negative cTTO values at zero. Purple line: including all participants and censoring only negative cTTO values at zero. cTTO indicates composite time trade-off.
DISCUSSION
We developed the first population-based value set of the EQ-5D-5L for Canada. This study included a large community-based sample of English and French speakers, which reasonably represented the general Canadian population. It thus broadly reflects the societal preferences of the Canadian population to EQ-5D-5L health states elicited using the TTO technique.
The design of the Canadian EQ-5D-5L Valuation Study was characterized by the protocol implemented through the EQ-VT. The EQ-VT was intended to standardize the elicitation of value sets around the world, thus allowing for more valid international comparisons. Owing to the uncertainty around using the cTTO in valuing the EQ-5D-5L, we chose to also incorporate the tTTO as an add-on module in our study. The unexpected impact of the transition from the tTTO to the LT-TTO in the EQ-VT on the distribution of preference responses was consistently observed across a few countries where the EQ-VT was used in the valuation study.11–14 As a remedy for the maldistribution, we incorporated censoring for negative cTTO values in our modeling. Thus, we believe our preferred model selected for generating a TTO-based value set is a better approach given the characteristics of the data and our current knowledge in the modeling techniques.
The upper anchor point, full health, in the health utility scale is set at 1. Previous EQ-5D valuation studies usually used “11111” as the anchoring state to elicit preferences and assigned the value of 1 to it. Because of the lack of a definition of full health, it is debatable whether no problems in any of the 5 dimensions can be considered as “full health.” Instead, in the EQ-VT, “full health” is used as the anchoring state. As we used the linear terms for the main effects in the preferred model, the value for “11111” can theoretically be extrapolated at 0.949. This value for “11111” implies that a status with no problems in the 5 dimensions is not equal to “full health.” In other words, people may define full health as being beyond just having no problems in these 5 dimensions (eg, no problem in running vs. walking).
There are a few limitations in this study. Firstly, the final sample of the participants included in the analyses has a good representation of the Canadian general population in terms of age, sex, marital status (except for those divorced or widowed), employment, born in Canada, and language spoken at home, but not on education. People with less than high school education were underrepresented, despite extensive efforts in recruiting. To evaluate the potential bias, we compared the values for each health state between participants with different levels of education (high school or lower, college, and university of higher). There is no clear pattern in the health state values and most of the differences were not statistically significant. Compared with the general Canadian population, our sample also had more participants with annual household income of <$15,000 and fewer with the income of >$75,000. Further, the 136 participants who were excluded from the value set models were older, less healthy, and had lower socioeconomic status. In the sensitivity analyses, the values predicted by a model on all participants are higher but with lower precision than those by a model on only those meeting the inclusion criteria. This highlights the importance of having a representative sample of the target population in the value set development. Otherwise the value set might not reflect the true societal preference, which will subsequently affect its validity in supporting reimbursement decision making. Second, the alternative models we have tried in our analyses by no means are exhaustive. Also our modeling approach primarily adopted additive utility functions, which considered only the interactions between severe levels of each dimension and across all 5 dimensions. Other interactions were not examined in the modeling exercise. Finally, once censoring was applied to any observation for a health state, that health state had to be excluded from the MAE calculation. As a result, the preferred model was selected in favor of maximizing the prediction precision for those (less severe) health states included in the MAE calculation.
CONCLUSIONS
We present the first TTO-based value set of the EQ-5D-5L for Canada. Its development hinged on our current knowledge on modeling techniques, as well as our extensive exploration of the observed TTO valuations. We believe that the preferred model appropriately reflects the characteristics of the observed preferences from the Canadian general population. This value set can be used to support health utility estimation in economic evaluations for reimbursement decision making in Canada.
Supplementary Material
Footnotes
Supplemental Digital Content is available for this article. Direct URL citations appear in the printed text and are provided in the HTML and PDF versions of this article on the journal's Website, www.lww-medicalcare.com.
The Canadian EQ-5D-5L Valuation Study Group: Principal Investigators: Drs F. Xie (McMaster University) and J.A. Johnson (University of Alberta); Coinvestigators: Drs N. Bansback, S. Bryan (University of British Columbia), A. Ohinmaa (University of Alberta), L. Poissant (University of Montreal), E. Pullenayegum (Hospital for Sick Children); Research Coordinator: Kathy Gaebel (McMaster University); Research Assistants: Samantha Pollard and Lidia Engel (University of British Columbia); Serena Humphries and Fatima Al Sayah (University of Alberta), Touria Addou (University of Montreal).
Supported by an operating grant from the Canadian Institutes for Health Research (#MOP 111076) and funding support from the EuroQol Foundation.
F.X. and E.P. are supported by Canadian Institutes of Health Research New Investigator Awards (2012–2017). J.A.J. is a Senior Health Scholar with Alberta Innovates Health Solutions. The remaining authors declare no conflict of interest.
REFERENCES
- 1.Canadian Co-ordinating Office for Health Technology Assessment (CCOHTA). Guidelines for Economic Evaluation of Pharmaceuticals. Ottawa, Canada: CCOHTA; 1997. [DOI] [PubMed] [Google Scholar]
- 2.Ontario Ministry of Health and Long-Term Care. Ontario Guidelines for Economic Analysis of Pharmaceutical Products. Ontario: Ministry of Health; 1994. [Google Scholar]
- 3.Canadian Agency for Drugs and Technologies in Health. Guidelines for the Economic Evaluation of Health Technologies: Canada, 3rd ed Ottawa: Canadian Agency for Drugs and Technologies in Health; 2006. [Google Scholar]
- 4.Brooks R. EuroQol: the current state of play. Health Policy. 1996;37:53–72. [DOI] [PubMed] [Google Scholar]
- 5.Brauer CA, Rosen AB, Greenberg D, et al. Trends in the measurement of health utilities in published cost-utility analyses. Value Health. 2006;9:213–218. [DOI] [PubMed] [Google Scholar]
- 6.Prosser L, WIttenberg E. Trends in utility elicitation methods: Is there still a role for direct elicitation? In: 32nd Annual Meeting of Society for Medical Decision Making, Toronto, 2010.
- 7.Herdman M, Gudex C, Lloyd A, et al. Development and preliminary testing of the new five-level version of EQ-5D (EQ-5D-5L). Qual Life Res. 2011;20:1727–1736. [DOI] [PMC free article] [PubMed] [Google Scholar]
- 8.Bansback N, Tsuchiya A, Brazier J, et al. Canadian valuation of EQ-5D health states: preliminary value set and considerations for future valuation studies. PLoS One. 2012;7:e31115. [DOI] [PMC free article] [PubMed] [Google Scholar]
- 9.Oppe M, Devlin NJ, van HB, et al. A program of methodological research to arrive at the new international EQ-5D-5L valuation protocol. Value Health. 2014;17:445–453. [DOI] [PubMed] [Google Scholar]
- 10.Janssen BM, Oppe M, Versteegh MM, et al. Introducing the composite time trade-off: a test of feasibility and face validity. Eur J Health Econ. 2013;14(suppl 1):S5–13. [DOI] [PMC free article] [PubMed] [Google Scholar]
- 11.Devlin N, Shah KK, Mulhern B, et al. An EQ-5D-5L value set for England. The EuroQol Group 30th Plenary Meeting. September 12, 2013.
- 12.Ramos-Goni J, Pinto-Prades J, Cabases JM, et al. Spanish EQ-5D-5L Valuation project: dealing with inconsistencies of C-TTO responses. The EuroQol Group 30th Plenary Meeting. September 12, 2013.
- 13.Versteegh M, Krabbe P, Evers S, et al. A Dutch tariff for the EQ-5D-5L. The EuroQol Group 30th Plenary Meeting. September 12, 2013.
- 14.Xie F, Pullenayegum E, Bansback N, et al. The Canadian EQ-5D-5L Valuation Study: An Exploratory Analysis. The EuroQol Group 30th Plenary Meeting. September 12, 2013.
- 15.Al Sayah F, Mladenovic A, Gaebel K, et al. How Dead Is Dead? Findings From Interviewing Participants From the Canadian EQVT Valuation Test Retest Study. The EuroQol Group 31th Plenary Meeting. September 25, 2014.
- 16.Xie F, Pullenayegum E, Gaebel K, et al. Was composite TTO a worse-than-dead proposition? The EuroQol Group Plenary Meeting. 2014.
- 17.Dolan P. Modeling valuations for EuroQol health states. Med Care. 1997;35:1095–1108. [DOI] [PubMed] [Google Scholar]
- 18.Shaw JW, Johnson JA, Coons SJ. US valuation of the EQ-5D health states: development and testing of the D1 valuation model. Med Care. 2005;43:203–220. [DOI] [PubMed] [Google Scholar]
Associated Data
This section collects any data citations, data availability statements, or supplementary materials included in this article.