Abstract
Several studies have demonstrated the potential of cross-polarization optical coherence tomography (CP-OCT) to quantify the severity of early caries lesions (tooth decay) on tooth surfaces. The purpose of this study is to show that 2D images of the lesion depth and the integrated reflectivity can be used to accurately represent the severity of early lesions. Simulated early lesions of varying severity were produced on tooth samples using simulated lesion models. Methods were developed to convert the 3D CP-OCT images of the samples to 2D images of the lesion depth and lesion integrated reflectivity. Calculated lesion depths from OCT were compared with lesion depths measured from histological sections examined using polarized light microscopy. The 2D images of the lesion depth and integrated reflectivity are well suited for visualization of early demineralization.
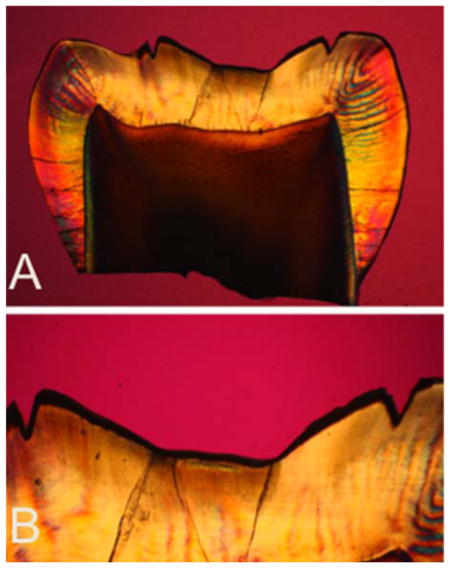
Polarized light micrographs (PLM) of one of the histological sections from a tooth exposed to demineralization for 48 hrs. (A) PLM image of entire thin section (B) magnified PLM image of region of interest.
Keywords: caries detection, dentistry, optical coherence tomography, polarization
1. Introduction
New methods are needed for the nondestructive measurement of tooth demineralization and remineralization to monitor the progression of incipient caries lesions (tooth decay) for effective nonsurgical intervention and to evaluate the performance of anticaries treatments such as chemical treatments or laser irradiation. A nondestructive, quantitative method of monitoring demineralization and remineralization “in vivo” with high sensitivity would be invaluable for use in short-term clinical trials for various anticaries agents such as fluoride dentifrices and antimicrobials, particularly in high risk areas of the tooth such as the pits and fissures of the occlusal surfaces. Optical coherence tomography (OCT) is uniquely capable of this task since it provides a measure of the reflectivity from each layer of the lesion, and is able to resolve the formation of remineralized zones of increased mineral density and reduced light scattering. OCT is not only valuable as a nondestructive tool for the assessment of anticaries agents in vivo but is also valuable for in vitro studies as well since it does not require thin sectioning, and it can be carried out rapidly. Several studies both in vitro and in vivo have shown that cross polarization is advantageous for quantifying the severity of demineralization on tooth surfaces [1–8]. OCT typically produces vast volumes of data and methods are needed for analysis that are amenable to automation.
In the cross-polarization image, the reflectivity from lesion areas can be directly integrated to represent the severity of demineralization. Methods have also been applied using conventional OCT systems but the strong surface reflection from the tooth surface greatly interferes, making direct integration of the reflectivity from the lesion problematic.
Amaechi et al. [9] demonstrated that the loss of penetration depth in conventional OCT images correlated well with the mineral loss measured with microradiography for shallow artificial lesions on smooth surfaces. Although this approach provided good results for shallow lesions on flat surfaces, there are several issues with using the loss of light penetration as a measure of lesion severity. In order to utilize loss of OCT signal intensity one must arbitrarily choose a distance from the surface to serve as a cutoff point, based on an arbitrary intensity loss. This is feasible for smooth surfaces with uniform artificial lesions of known depth, but is not possible for highly convoluted surfaces, irregular lesion geometry or for lesions with significant structural characteristic of natural lesions. Moreover, OCT provides measurements of the reflectivity from each layer in the tissue. Since the reflectivity increases markedly with increases in light scattering, the lesion is most likely to cause an increase in signal rather than a loss in signal especially for natural lesions, and one cannot assume that the underlying enamel is sound.
Other groups have looked at fitting the profile of the a-scans in OCT images to represent the extent of demineralization or to calculate attenuation coefficients [10–12]. Unfortunately, natural and simulated caries lesions typically do not have a uniform composition. Cross-sectional profiles of caries lesions, both natural and simulated, show that lesions are not uniform and typically have a surface zone of higher mineral content above the lesion body [13]. The evolution of the OCT signal intensity with increasing depth or a-scan shape is complex and is dependent on the lesion geometry as well as the characteristics/performance of the OCT system. Lesions have been observed to both completely block or attenuate penetration of the signal or cause an apparent increase of penetration. In fact, this can lead to contradictory interpretations of photon propagation in the lesion. Popescu et al. [10] concluded that increasing demineralization in the lesion actually decreased the total scattering in the lesion, because the rate of decline of the a-scan intensity decreased in natural smooth surface lesions compared to sound enamel. The authors attributed this phenomenon to the different scattering behavior of pores in the lesion but this interpretation is not supported by any modeling or experimental measurements and it contradicts previous angularly resolved light scattering measurements in sound and demineralized enamel in the near-IR which shows a 2–3 fold increase in light scattering with demineralization [14]. It is also interesting to point out that two methods discussed above are completely contradictory approaches to monitoring lesion severity. In the first approach of Amaechi et al. [9], increased attenuation of the a-scan indicates increasing lesion severity while in the second approach [10] decreased attenuation of the a-scan indicates increasing lesion severity. The opposing interpretations of a-scan profiles, or the rate of a-scan decline, clearly suggest that the a-scan profile is unreliable as an indicator of lesion severity.
Since areas of demineralization appear with increased reflectivity in the OCT images, the most obvious approach is to directly measure the reflectivity from the lesion area and use that as a measure of lesion severity. However, the high refractive indices of dental hard tissues, produces a strong surface reflection at the tooth surface. Utilizing high-resolution OCT systems with axial depth resolution of less than 10 μm, does not prevent the strong surface reflection from dominating the reflectivity at greater depths from the surface. The axial resolution is defined as the point at which the peak intensity of the Gaussian shaped coherence function drops by 3 dB in intensity. However, the strong surface reflection may be 30–40 dB higher than the reflectivity originating from deeper layers in the lesion, which can prevent the resolution of any information from those layers because the intensity of the tail of the Gaussian peak can exceed and mask the signal from those layers. In the cross-polarization image, the reflection from the tooth surface is reduced by 20–30 dB so that the specular reflectance at the surface does not interfere as significantly with the underlying layers. Moreover, the reflectivity from sound enamel is suppressed near the tooth surface and there is higher contrast between sound and demineralized enamel in the cross polarization image.
One can also attempt to reduce the reflection from the tooth surface by deliberately imaging the sample at an angle, or by producing an artificial displacement by covering the surface with a thick layer of water or a high refractive index liquid with a refractive index similar to enamel. Imaging the sample at an angle is a simple and effective method of reducing the specular reflection of the surface, however, it is only effective for flat samples. Applying a liquid to the surface is more problematic since it is difficult to control the thickness of the layer and beading of the liquid causes distortion of the optical path length, distorting the image of the lesion. Moreover, the addition of a liquid profoundly influences the scattering behavior of the lesion, since light scattering is caused by the pores produced by loss of mineral. If the lesion is imbibed with a fluid of the same refractive index, it becomes transparent because the scattering resulting from the porosity of the lesion is lost without the refractive index mismatch between the mineral and the air/water boundary in the pore. The magnitude of scattering/reflectivity is also dependent on the hydration of the lesion and it is well known that blowing air onto a shallow lesion (white spot lesion) increases contrast for better visibility.
We have demonstrated in several studies that the lesion severity can be represented by the integrated reflectivity with depth in the cross-polarization OCT image. The integrated reflectivity ΔR (reflectivity (intensity units × μm)) is a measurement analogous to ΔZ (vol% × μm), Figure 3 [15, 16]. ΔZ, is used in microradiography which is the gold standard for measuring mineral loss, it is the integrated mineral loss over the lesion depth, volume percent mineral x microns [17]. Microradiography requires destruction of the samples and cannot be used in vivo.
Figure 3.
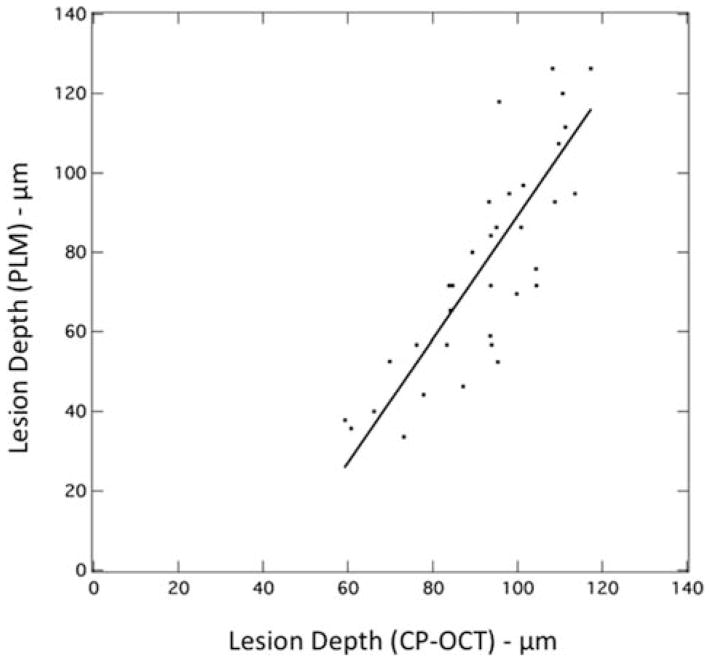
(A) Plot of lesion depth determined from the cross-polarization image with a user defined cutoff point (1/e2) vs. depth determined using (PLM). A linear fit to the data is also shown.
In addition, three years ago we completed the first study employing PS-OCT to monitor demineralization in vivo [18]. In that study, small areas of demineralization were produced on tooth buccal surfaces by placing orthodontic bands to accumulate plaque. In addition, small incisions were cut in the grooves of the occlusal surfaces to trap plaque in those areas to produce occlusal demineralization. Tooth surfaces were scanned in vivo using PS-OCT before band/incision placement and after one month. Teeth were extracted, serial sectioned and analyzed using polarized light microscopy (PLM) and transverse microradiography (TMR) for comparison with the PS-OCT images. Lesions were formed after one month and there was a significant increase in the integrated reflectivity with depth (ΔR) calculated from the cross-polarization OCT images in lesion areas on both buccal and occlusal surfaces along with a corresponding increase in the integrated mineral loss (ΔZ) measured with TMR (gold standard). This study demonstrated that CP-OCT can be used in vivo to monitor demineralization on tooth surfaces; even in the convoluted topography of the occlusal surfaces. The wetting of tooth surfaces by saliva appeared to improve the performance of PS-OCT by reducing the surface reflectivity.
The measurement of lesion depth poses a challenge in OCT, because cutoff points have to be chosen to define the lesion depth. This is difficult because of the high dynamic range of the reflectivity. For example, as described earlier, for a system having an axial resolution in enamel of 10 μm, the intensity from a reference mirror will fall off by 3 dB after 10 μm. If the lesion has a reflectivity that is 10–20 dB greater than the reflectivity of the underlying sound enamel, then the depth at which the reflectivity falls off to the level of the sound enamel will exceed that considerably. This problem also applies to defining the beginning of the lesion at the sample surface as well. One cannot simply choose the value at which the peak intensity falls by 3 dB because the reflectivity varies throughout the breadth of the lesion, i.e., it is not a single peak. The signal fall off is very complicated because the light is exponentially attenuated while propagating into the sample and also exponentially attenuated upon exiting the sample. Lesions typically appear deeper in OCT images than they actually are and algorithms are needed to select the appropriate cutoff points. Cutoff intensity values such as the depth at which there is a 1/e2 decrease in intensity can be chosen which appears to work somewhat effectively on enamel [19] but can overestimate the lesion depth. Another promising method is to use edge detection algorithms to find the lesion edges and set the 1/e2 cutoff based on those edges [20].
The large volume of data typically produced in a full 3D OCT image precludes manual methods of analysis. Moreover, the visual presentation of 3D volumetric data may be challenging. We have demonstrated that automated algorithms can be developed to calculate the lesion depth from cross-polarization OCT images and then integrate over that depth to calculate the lesion severity [19, 20]. The purpose of this study is to develop methods to convert the 3D CP-OCT images of the samples to 2D images of the lesion depth and integrated reflectivity, to aid visualization of the lesions and better represent the lesion severity on both smooth and convoluted tooth surfaces. Moreover, such images are convenient for comparison with other 2D imaging methods such as fluorescence, and visible and near-IR reflectance imaging.
2. Experimental
2.1 Samples and lesion preparation
Ten enamel blocks (~2 × 10 mm) were prepared from extracted bovine incisors acquired from a slaughterhouse and mounted on delrin blocks. Each enamel sample was partitioned into six regions or windows (two sound and four demineralization areas) by etching 140 μm wide incisions spaced 1.4 mm apart across each of the enamel blocks using a laser. Incisions were etched using a CO2 laser (Impact 2500, GSI Lumonics Rugby, UK) operating at a wavelength of 9.3 μm, pulse duration of 15 μs and a pulse repetition rate of 5 Hz. A water spray was used, and the incident fluence was 170 J/cm2 with a spot size of 150 μm. The high fluence was used to demarcate the laser-irradiated area. A thin layer of acid resistant varnish, red nail polish, Revlon (New York, NY) was applied to protect the sound enamel control area on each end of the block. Samples were exposed to a pH cycling model in which they were placed in a demineralization solution for 6 hrs followed by a remineralization solution for 17 hrs each day [1]. This model better simulates the natural process of lesion generation that takes place in the oral environment. The demineralization solution was composed of a 40 ml aliquot of 2.0 mmol/L calcium, 2.0 mmol/L phosphate, and 0.075 mol/L acetate at pH 4.7. The remineralization solution was composed of a 40 ml aliquot of 1.5 mmol/L calcium, 0.9 mmol/L phosphate, 150 mmol/L potassium chloride, and 20 mmol/L cacodylate at pH 7.0. pH cycling was repeated for intervals of 3, 6, 9, 12 day periods for each window.
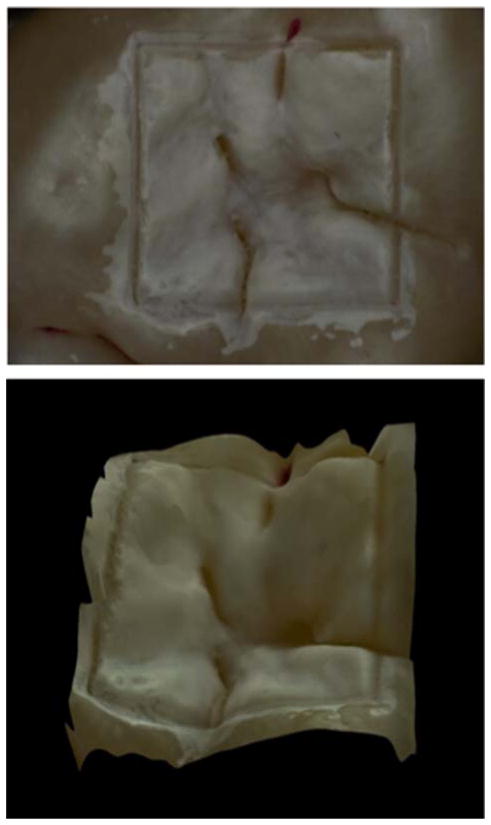
Human teeth with non-carious occlusal surfaces were collected with the approval of the Committee on Human Research (CHR) and sterilized with gamma radiation. Tooth occlusal surfaces were air abraded with 50 μm glass beads for twenty seconds to remove all the stain and debris from the fissures and remove the outermost fluoride rich layers of enamel, in order to facilitate the demineralization of those surfaces. Next, teeth were mounted in black orthodontic acrylic blocks. Samples were stored in a moist environment of 0.1% thymol to maintain tissue hydration and prevent bacterial growth. Incisions 50 μm deep were cut using the CO2 laser described above to produce 4 × 4 mm windows on the occlusal surface of each tooth. The laser incisions also inhibit decay in the laser area due to thermal modification of the enamel and are therefore very effective in providing a separation between the sound and demineralized areas. The channels cut by the laser also serve as reference points for optical coherence tomography and for serial sectioning and are sufficiently narrow that they do not interfere with calculations of the image contrast. The enamel surrounding the 4 × 4 mm windows created by the laser was covered with red fingernail polish (Revlon, New York, NY). The varnish was removed using acetone after the lesions were generated. We chose not to use a clear varnish as was done in an earlier study [21] because it was difficult to ensure complete coverage over the irregular tooth surfaces. Artificial lesions were created within the 4 × 4 mm windows by immersing each tooth into a 50 ml aliquot of a Ca/PO4/acetate solution containing 2.0 mmol/L calcium, 2.0 mmol/L phosphate, and 0.075 mol/L acetate maintained at pH 4.5 and a temperature of 37 °C for either 24 or 48 hours. This well proven model produces subsurface lesions approximately 50–150 μm deep with intact surfaces [2–4, 22, 23]. In Figure 1, a depth composition 2-D image and a 3-D image taken with a Keyence VHX-1000 digital microscope (Keyence America, Elmwood peak, NJ) are shown for a sample after 24 hr of demineralization. This new type of microscope allows acquisition of either high depth of field images similar to scanning electron microscopy or 3D images of the surface tomography that are well suited for imaging tooth occlusal surfaces.
Figure 1.
Images of one the samples used in this study taken with the Keyence VHX-1000E digital microscope (Itasca, IL). (Top) Depth composition image of the 4 × 4 mm window in the occlusal surface of a human tooth after 24 hrs demineralization. (Bottom) 3D image of the same 4 × 4 mm window.
2.2 Polarization sensitive optical coherence tomography (PS-OCT System)
An all-fiber-based optical coherence domain reflectometry (OCDR) system was used with polarization maintaining (PM) optical fiber, high-speed piezoelectric fiber-stretchers and two balanced InGaAs receivers that was designed and fabricated by Opti-phase, Inc., Van Nuys, CA. The two-channel system was integrated with a broadband superluminescent diode (SLD) Denselight (Jessup, MD) and a high-speed XY-scanning system (ESP 300 controller and 850G-HS stages, National Instruments, Austin, TX) for in vitro optical tomography. This system is based on a polarization-sensitive Michelson white light interferometer. The high power (15 mW) polarized SLD source, emitted near-IR light at a center wavelength of 1317 nm with a spectral bandwidth full-width at half-maximum (FWHM) of 84 nm and it was aligned using polarization controller to deliver 15 mW into the slow axis of the PM fiber (interferometer source arm). This light was split into the reference and sample arms of the Michelson interferometer by a 50/50 PM-fiber coupler. The sample arm was coupled to an AR-coated fiber-collimator to produce a 6 mm in diameter, collimated beam. That beam was focused onto the sample surface using a 20 mm focal length AR-coated planoconvex lens. This configuration provided a lateral resolution of approximately 20 μm and an axial resolution of 10 μm in air with a signal to noise ratio of greater than 40–50 dB. The PS-OCT system is completely controlled using Labview software (National Instruments, Austin, TX). Reflectivity values per pixel are presented as linear intensity units (IU). IU units are detector volts divided by 32 μV.
PS-OCT scans for the bovine enamel blocks were 280 × 60 × 2000 pixels with each of the 280 b-scans placed 50 μm apart for a volume of 14 mm × 3 mm × 5.74 mm in air. Scans for the occlusal surfaces were 175 × 110 × 2000 pixels with each of the 175 b-scans spaced 50 μm apart for a volume of 8.75 mm × 5.5 mm × 5.74 mm in air. Samples were stored in water and 0.1% thymol and scanned with the surface dry.
2.3 Image analysis
Raw OCT data was analyzed using a custom written program in Labview (National Instruments, Austin, TX). Co-polarization and cross-polarization (CP-OCT) OCT images were acquired for each sample, however only the cross-polarization images were processed and analyzed. For speckle noise reduction, signals not exceeding four standard deviations from the mean background noise floor were reduced to the mean background value and a Gaussian blur smoothing algorithm was applied using a 5 × 5 pixel convolution kernel [3, 4]. In the edge-detection approach, the enamel edge and the lower lesion boundary were determined by applying an edge locator [3, 4]. The program first locates the maximum of each a-scan, and differentiates the a-scan maximum as either demineralized or sound using the signal-to-noise ratio as a threshold. The depth of the lesion is next calculated by locating the upper and lower lesion boundaries, by identifying the first pixels that fall under the threshold of e−2 of the maximum value. The distance per pixel conversion factor was obtained experimentally by system calibration. A linear relationship was established between the OCT lesion depth and the histological depths measured using polarized light microscopy (PLM). Based on this relationship, a linear correction was applied to the lesion depth calculated from OCT (Corrected Data = 1.55 – OCT pixel depth – 66.2).
Each a-scan of the CP-OCT images was reduced to single values representing the mean reflectivity per pixel, the integrated reflectivity over a fixed depth, the calculated lesion depth, and the integrated reflectivity over the calculated image depth. The mean reflectivity per pixel was calculated by dividing the sum of each a-scan in linear intensity units (IU) by the number of pixels in each a-scan. The integrated reflectivity (ΔR) was calculated by integrating the reflectivity in IU units over either a fixed depth in microns (150 μm for bovine enamel blocks and 250 μm for the 24 hr and 48 hr lesions in tooth occlusal surfaces) or the lesion depth calculated as described above.
3. Results and discussion
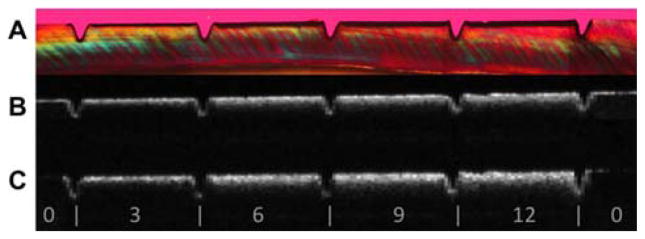
The bovine enamel samples exposed to pH cycling yielded lesions with intact surfaces, i.e. subsurface lesions. Lesion depths varied from 40 μm to 110 μm after 3, 6, 9 or 12-days of pH cycling. Figure 2 shows OCT b-scans of both the parallel and perpendicular polarization states (B, C) and the corresponding polarized light microscope image (A) of a thin section cut from that sample. Note how there is minimal reflectivity from the sound areas in the cross-polarization image vs. the co-polarization image. The lesion depth in both the PLM and CP-OCT images increases monotonically with increasing periods of pH cycling.
Figure 2.
Comparison of PS-OCT b-scans for both linear polarizations with a histological section viewed under polarized light (A) PLM image of thin section (B) Co-polarization OCT b-scan image (C) Cross-polarization b-scan image. The individual windows located between the laser incisions marked with the white bars are indicated for 0, 3, 6, 9 and 12 days of exposure to pH cycling.
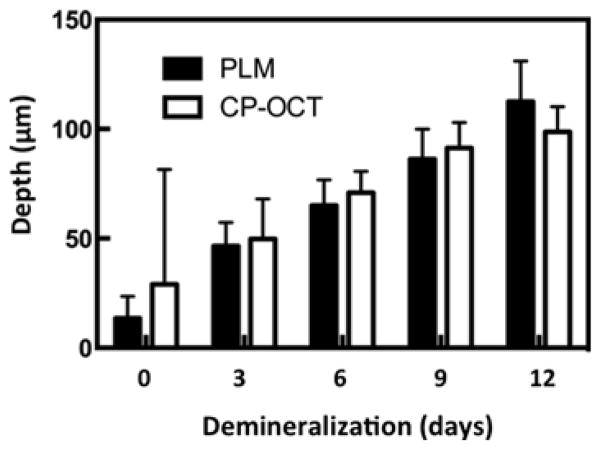
An accurate determination of the lesion depth is the most challenging task in analysis of the CP-OCT images. In order to determine the lesion depth in the CP-OCT image, the depth at which the signal intensity falls by (1/e2) from the peak value was used as an initial estimate. This choice results in an overestimate of the actual lesion depth for lesions less than 100 μm deep. Figure 3 shows a plot of the lesion depths estimated from the CP-OCT images using the (1/e2) cutoff point vs. the lesion depth measured using polarized light microscopy. Linear regression shows a strong linear correlation (R2 = 0.69) between the two methods. The depth determination also relies on accurate knowledge of the refractive index, and a refractive value of 1.63 was used to represent sound enamel. However, the refractive index of the demineralized enamel is lower due to the loss of mineral density and the lower refractive index of the lesion is expected to lead to underestimation of the lesion depth. This error is expected to increase with increasing lesion depth. We adjusted the lesion depths determined using CP-OCT using the linear relationship between the PLM and CP-OCT lesion depths from Figure 3. Depths in microns were adjusted by multiplying by 1.55 and subtracting by 66.2. The adjusted depths and the depths measured using PLM are plotted in Figure 4 for comparison. Note that the mean lesion depth for the sound window is not zero for either CP-OCT or PLM. It is difficult to differentiate edge shadowing effects resulting from surface topography in PLM images from demineralization close to the sample surface, namely the sample edge appears to be 10–20 μm thick. This problem with PLM is more pronounced for occlusal surfaces where there is a great deal of curvature (Figures 8 and 9). The higher mean lesion depth and corresponding high standard deviation for CP-OCT was caused by a single sample. One of the sound windows yielded a very high lesion depth producing the high standard deviation for the sound window in Figure 4. Close examination of the OCT scans from the sample showed that there was strong reflectivity from the sound window on the upper half of the window. From the CP-OCT scans it appears that demineralization may have occurred beneath part of the protected window. Unfortunately, this could not be independently confirmed. Since only one intact PLM slice survived sectioning without fracture and that appeared “clean” with no artifact or demineralization visible on the sound windows. Without definitive histological confirmation, we decided not to reject this sample. If that single outlier is rejected the adjusted mean lesion depth for the remaining 9 samples assessed with CP-OCT is −1.75 (±15). Note this is negative because the depth correction involves a subtraction.
Figure 4.
Bar graph comparing the mean ± s.d. of the adjusted lesion depths calculated using CP-OCT and those calculated from polarized light microscopy for the ten bovine enamel samples.
Figure 8.
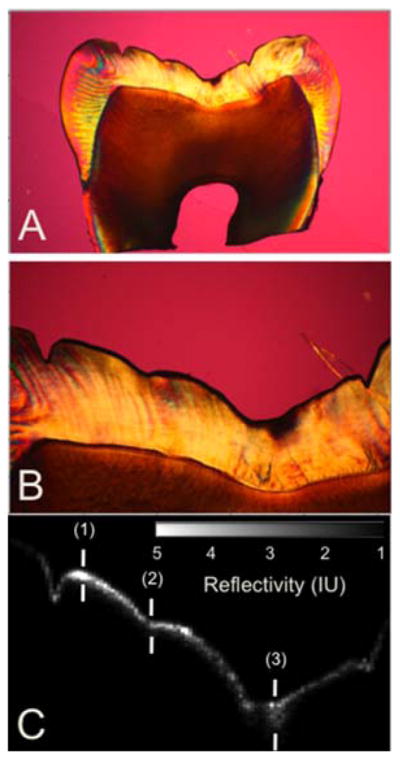
Comparison of a CP-OCT b-scan image taken across the 4 × 4 mm window in the occlusal surface of one of the 24 hr tooth samples with a histological section viewed under polarized light. (A) PLM image of entire thin section (B) magnified PLM image of region of interest (C) matching cross-polarization b-scan image of region of interest. The depths represented by the three marks (1–3) are: (1) 50 μm with PLM and 57 μm with OCT, (2) 72 μm with PLM and 52 μm with OCT, (3) 283 μm with PLM and 237 μm with OCT.
Figure 9.
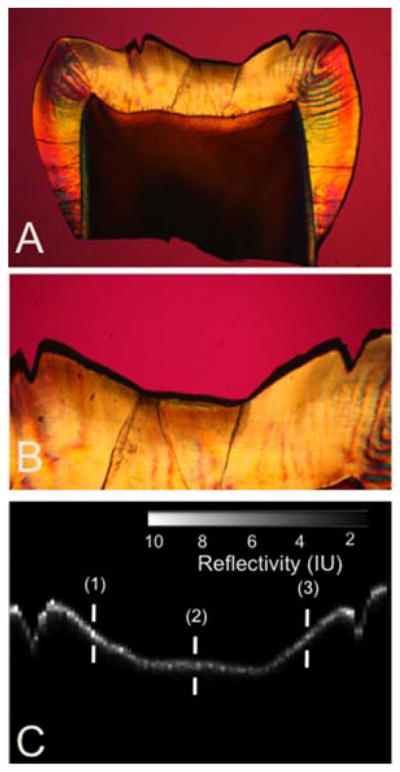
Comparison of a CP-OCT b-scan image taken across the 4 × 4 mm window in the occlusal surface of one of the 48 hr tooth samples with a histological section viewed under polarized light. (A) PLM image of entire thin section (B) magnified PLM image of region of interest (C) matching cross-polarization b-scan image of region of interest. The depths represented by the three marks (1–3) are: (1) 108 μm with PLM and 83 μm with OCT, (2) 94 μm with PLM and 77 μm with OCT, (3) 153 μm with PLM and 121 μm with OCT.
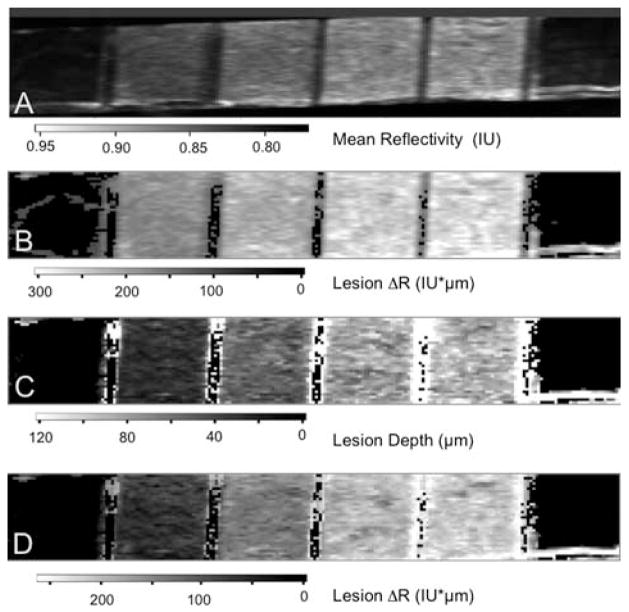
The CP-OCT images for the ten bovine enamel blocks 280 × 60 × 2000 pixels representing a volume of 14 mm × 3 mm × 5.74 mm in air (3.59 in enamel) were processed as described in section 2.3 with the applied depth correction to generate 2D images in various formats. Figure 5 shows four images of one of the bovine enamel blocks with six windows. The first image (A) represents the mean reflectivity and this was calculated by taking the mean value of all the pixels in each of the a-scans. The limitation of this approach is that each pixel includes all the intensity from pixels outside the lesion. The second image (B) represents the reflectivity integrated over a fixed depth and this was calculated by integrating the reflectivity in each a-scan from the sample surface to a fixed depth of 150 μm. A depth of 150 μm was chosen based on the assumption that none of the lesions should be deeper than 150 μm. This less sophisticated approach was utilized in our earlier studies [1, 24]. The reflectivity of sound enamel is not zero, therefore in this approach the contribution of the pixels between the actual lesion depth and 150 μm in each a-scan inflates the integrated reflectivity of the lesion. In the third image (C), each pixel represents the value of the calculated lesion depth. The last image (D) of Figure 5 shows the integrated reflectivity over the calculated image depth and best represents the lesion severity in a single 2D image.
Figure 5.
Two dimensional images of one of the bovine enamel samples are shown including (A) the image contrast ratio, (B) the reflectivity integrated over a fixed depth of 150 μm, (C) the calculated lesion depth and (D) the reflectivity integrated over the calculated lesion depth. Values are shown in the grayscale bars below each image.
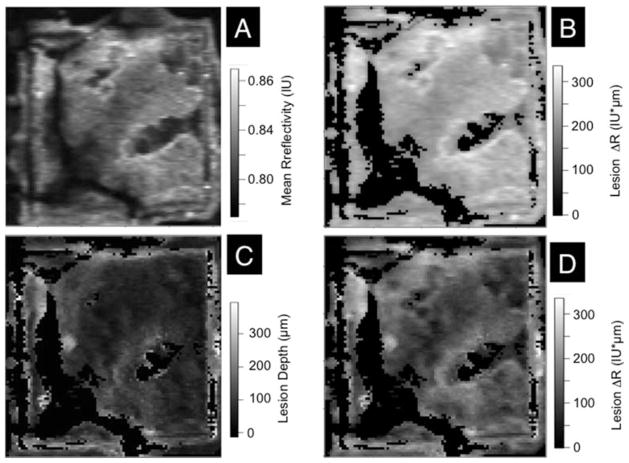
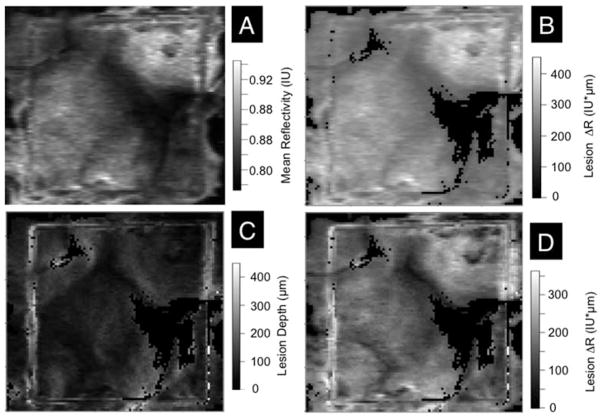
The same approach utilized to analyze the bovine enamel blocks was applied to analyze the simulated lesions produced in the 4 × 4 mm windows on the occlusal surfaces of human teeth (Figure 1). The same algorithms were applied and the same linear correction was applied to the depths calculated for the CP-OCT images which were (175 × 110 × 2000 pixels) for a volume of 8.75 mm × 5.5 mm × 5.74 mm. Figures 6 and 7 show images of the 4 × 4 mm windows on samples exposed to the demineralization solution for 24 and 48 hours, respectively. Four images are shown, including the mean reflectivity, the reflectivity integrated over a depth of 250 μm, the calculated lesion depth and the reflectivity integrated over the calculated lesion depth. These images show considerable variation in the lesion severity over the 4 × 4 mm window. It is difficult to produce uniform lesions in the occlusal surfaces due to the varying angle of the enamel prisms, high fluoride content in the outer enamel layers and the presence of prismless enamel [13]. The demineralization viewed under visible light appear quite uniform (Figure 1) indicating that visible light reflectance measurements do not represent the varying severity of the lesions.
Figure 6.
Two dimensional images of the occlusal surface of one of the teeth after 24 hrs are shown including (A) the image contrast ratio, (B) the reflectivity integrated over a fixed depth of 250 μm, (C) the calculated lesion depth and (D) the reflectivity integrated over the calculated lesion depth. Values are shown in the grayscale bars to the right of each image.
Figure 7.
Two dimensional images of the occlusal surface of one of the teeth after 48 hrs are shown including (A) the image contrast ratio, (B) the reflectivity integrated over a fixed depth of 250 μm, (C) the calculated lesion depth and (D) the reflectivity integrated over the calculated lesion depth. Values are shown in the grayscale bars to the right of each image.
The 24 hr and 48 hr demineralization samples were sectioned to confirm that the lesion depths determined using our algorithm with CP-OCT compare reasonably with the depths shown by polarized light histology. Figures 8 and 9 show PLM images from 24 hr and 48 hr samples along with b-scan CP-OCT images matched to that section. The variation in the lesion depth in the PLM images, higher near the laser incisions and shallower in the center are mirrored in the OCT images. The depth of demineralization is indicated at three points in the image. The depths indicated by PLM are consistently higher due to edge effects in the slice resulting from the steep sloping topography of the occlusal surface. The sound edges are 29 μm thick on the left side of the sample and 54 μm on the right side. Therefore the 30 μm difference in depth between the two methods can be easily explained by the sample curvature. There is a very deep lesion area on this sample (3rd mark). This may be a very small pre-existing lesion or an area more susceptible to demineralization.
The lesions in the 48 hr sample are proportionally deeper (Figure 9). The sound edges are 74 μm on the left side and 28 μm on the right side so the agreement is quite reasonable.
Images of the reflectivity integrated over the calculated lesion depth are well suited for monitoring the development of caries lesions in vivo or in vitro. This measure is directly comparable to the gold standard for demineralization, ΔZ, the integrated mineral loss over the lesion depth, volume percent mineral x microns and in the past we have labeled it ΔR, with units of intensity x microns. Direct measurements of ΔZ require the use of microradiography and tooth destruction making the method unsuitable for use in vivo, therefore the use of a surrogate nondestructive measurement such as ΔR, is extremely valuable. A good example of the utility of this approach is provided in the following description of one of our ongoing clinical studies.
We recently completed an in vivo study employing CP-OCT to monitor the development of demineralization peripheral to orthodontic brackets. Small lesions commonly appear around orthodontic brackets, particularly cervical to the bracket between the base of the bracket and the gums since it is difficult to keep this area free of plaque. In our study, volumetric 6 mm × 6 mm × 6 mm cross polarization tomographic images were acquired of the bracket and the area surrounding it. These images were rapidly and automatically converted to images of the reflectivity integrated over the calculated lesion depth, ΔR. Using these 2D images, we were able to successfully monitor in vivo and quantify an increase in the severity of demineralization between the base of the bracket and the gum line over time.
Presentation of the OCT images in the calculated depth and ΔR formats is also advantageous for comparison with other optical imaging methods such as reflectance imaging and florescence imaging. The intensity in these images represents either the reflectivity integrated over the depth or the loss in intensity over depth. Comparison of such images with OCT images can show how the image contrast changes with both lesion severity and lesion depth.
4. Conclusion
Different approaches have been proposed over the past decade to quantify the severity of demineralization from conventional and cross-polarization OCT images. The use of the cross-polarization OCT images allows direct integration of the reflectivity from lesion areas minimizing the interference from the strong surface reflection from the tooth surface. This greatly facilitates automated analysis which is required to handle the great wealth of data contained in OCT images In this paper, we demonstrate that 2D images of the calculated lesion depth and the reflectivity integrated over the calculated lesion depth are well suited for representing the severity of demineralization. This approach is quite valuable for monitoring lesions severity both in vivo and in vitro and for comparing the inhibition of demineralization by various anti-caries agents.
Acknowledgments
The authors acknowledge the support of NIH grant R01-DE17869.
Footnotes
Author biographies: Please see Supporting Information online.
References
- 1.Fried D, Xie J, Shafi S, Featherstone JD, Breunig TM, Le C. J Biomed Opt. 2002;7(4):618–627. doi: 10.1117/1.1509752. [DOI] [PubMed] [Google Scholar]
- 2.Jones RS, Darling CL, Featherstone JD, Fried D. Caries Res. 2006;40(2):81–89. doi: 10.1159/000091052. [DOI] [PubMed] [Google Scholar]
- 3.Kang H, Jiao JJ, Lee C, Le MH, Darling CL, Fried D. IEEE J Sel Top Quantum Electron. 2010;16(4):870–876. doi: 10.1109/JSTQE.2009.2033610. [DOI] [PMC free article] [PubMed] [Google Scholar]
- 4.Le MH, Darling CL, Fried D. Lasers Surg Med. 2010;42(1):62–68. doi: 10.1002/lsm.20862. [DOI] [PMC free article] [PubMed] [Google Scholar]
- 5.Everett MJ, Colston BW, Sathyam US, Silva LBD, Fried D, Featherstone JDB. SPIE Proc. 1999;3593:177–183. [Google Scholar]
- 6.Feldchtein FI, Gelikonov GV, Gelikonov VM, Iksanov RR, Kuranov RV, Sergeev AM, Gladkova ND, Ourutina MN, Warren JA, Reitze DH. Opt Express. 1998;3(3):239–251. doi: 10.1364/oe.3.000239. [DOI] [PubMed] [Google Scholar]
- 7.Dicht S, Baumgartner A, Hitzenberger CK, Sattmann H, Robi B, Moritz A, Sperr W, Fercher AF. SPIE Proc. 1999;3593:169–176. [Google Scholar]
- 8.Baumgartner A, Dicht S, Hitzenberger CK, Sattmann H, Robi B, Moritz A, Sperr W, Fercher AF. Caries Res. 2000;34:59–69. doi: 10.1159/000016571. [DOI] [PubMed] [Google Scholar]
- 9.Amaechi BT, Higham SM, Podoleanu AG, Rogers JA, Jackson DA. J Oral Rehabil. 2001;28(12):1092–1093. doi: 10.1046/j.1365-2842.2001.00840.x. [DOI] [PubMed] [Google Scholar]
- 10.Popescu DP, Sowa MG, Hewko MD, Choo-Smith LP. J Biomed Opt. 2008;13(5):054053. doi: 10.1117/1.2992129. [DOI] [PMC free article] [PubMed] [Google Scholar]
- 11.Mujat C, van der Veen MH, Ruben JL, ten Bosch JJ, Dogariu A. Appl Opt. 2003;42(16):2979–2986. doi: 10.1364/ao.42.002979. [DOI] [PubMed] [Google Scholar]
- 12.Mandurah MM, Sadr A, Shimada Y, Kitasako Y, Nakashima S, Bakhsh TA, Tagami J, Sumi Y. J Biomed Opt. 2013;18(4):046006. doi: 10.1117/1.JBO.18.4.046006. [DOI] [PubMed] [Google Scholar]
- 13.Fejerskov O, Kidd E, editors. Dental Caries: The Disease and its Clinical Management. Blackwell; Oxford: 2003. [Google Scholar]
- 14.Darling CL, Huynh GD, Fried D. J Biomed Opt. 2006;11(3):34023. doi: 10.1117/1.2204603. [DOI] [PubMed] [Google Scholar]
- 15.Jones RS, Darling CL, Featherstone JDB, Fried D. Caries Res. 2004;40(2):81–89. doi: 10.1159/000091052. [DOI] [PubMed] [Google Scholar]
- 16.Ngaotheppitak P, Darling CL, Fried D. Lasers Surg Med. 2005;37(1):78–88. doi: 10.1002/lsm.20169. [DOI] [PubMed] [Google Scholar]
- 17.de Josselin de Jong E, van der Linden AH, Borsboom PCF, ten Bosch JJ. Caries Res. 1988;22:153–159. doi: 10.1159/000261098. [DOI] [PubMed] [Google Scholar]
- 18.Louie T, Lee C, Hsu D, Hirasuna K, Manesh S, Staninec M, Darling CL, Fried D. Lasers Surg Med. 2010;42(10):738–745. doi: 10.1002/lsm.21013. [DOI] [PMC free article] [PubMed] [Google Scholar]
- 19.Can AM, Darling CL, Ho CM, Fried D. Lasers Surg Med. 2008;40:342–349. doi: 10.1002/lsm.20633. [DOI] [PubMed] [Google Scholar]
- 20.Le MH, Darling CL, Fried D. SPIE Proc. 2009;7162:1–7. doi: 10.1117/12.816867. [DOI] [PMC free article] [PubMed] [Google Scholar]
- 21.Wu J, Fried D. Lasers Surg Med. 2009;41(3):208–213. doi: 10.1002/lsm.20746. [DOI] [PMC free article] [PubMed] [Google Scholar]
- 22.Featherstone JDB, Glena R, Shariati M, Shields CP. J Dent Res. 1990;69:620–625. doi: 10.1177/00220345900690S121. [DOI] [PubMed] [Google Scholar]
- 23.Jones RS, Fried D. J Dent Res. 2006;85(9):804–808. doi: 10.1177/154405910608500905. [DOI] [PMC free article] [PubMed] [Google Scholar]
- 24.Ngaotheppitak P, Darling CL, Fried D. Lasers Surg Med. 2005;37(1):78–88. doi: 10.1002/lsm.20169. [DOI] [PubMed] [Google Scholar]


