Abstract
In this report we discuss the effect of radiofrequency field (RF) inhomogeneity on cross-polarization (CP) under magic-angle spinning (MAS) by reviewing the dependence of the CP-detected signal intensity as a function of the position in the sample space. We introduce a power-function model to quantify the position-dependent RF-amplitude profile. The applicability of this model is experimentally verified by nutation spectra obtained by direct signal detection, as well as by CPMAS signal detection, in two commercial MAS probes with different degrees of RF inhomogeneity. A conclusion is that substantial sections of a totally filled rotor, even in a probe with rather good homogeneity, do not contribute at all to the detected spectra. The consequence is that in CPMAS-based recoupling experiments, such as the CP-with-variable-contact-time (CPVC), spatial selectivity of the Hartmann-Hahn matching condition overcomes complications that could be caused by RF inhomogeneity permitting determination of accurate spectral parameters even in cases with high inhomogeneity.
Keywords: cross polarization, magic angle spinning, CPMAS, RF inhomogeneity, dipolar recoupling
Graphical Abstract
INTRODUCTION
The introduction in 1976 by Schaefer and Stejskal [1] of cross-polarization under magic-angle spinning (CPMAS) has enabled NMR spectroscopists to study a wide range of samples in the solid state by combining spin-magnetization enhancement of low-γ nuclei through CP with resolution enhancement through MAS. Without this seminal development solid-state NMR would not have had the broad impact on the applications to analysis of a wide range materials in different branches of chemistry, physics, biological sciences, materials sciences, engineering, and others [2]. At first this experiment was viewed with skepticism because MAS decouples the heteronuclear dipolar interaction that is instrumental in the CP-based magnetization transfer. While in static samples the CP was known to be effective, [3] provided the RF amplitudes ν1H and ν1X of the protons and the accepting X nuclei are matched to meet the Hartmann-Hahn condition ν1H = ν1X [4], this was not expected to work under MAS until Stejskal, Schaefer and Waugh soon demonstrated that CPMAS, when performed under the right conditions, does reinstate the desired heteronuclear dipolar coupling [5]. The required condition for an X nucleus having a single proton in its vicinity at an MAS frequency of νR is that the difference of the RF amplitudes must meet one of the MAS-adapted Hartmann-Hahn conditions ν1H − ν1X = nνR (n = ±1 or ±2). In samples where interaction with multiple protons is involved, conditions like n = 0, ±3, also become effective in CPMAS [5]. This CPMAS approach can be considered to be the first of a range of ‘recoupling’ experiments developed over the years. One important example is REDOR, introduced by Gullion and Schaefer [6] and another one, relevant to the current discussion, is CPMAS under Hartmann-Hahn conditions that relate to the sum of the two RF amplitudes, i.e., ν1H + ν1X = nνR (n = ±1 or ±2) [7]. Because of the nature of the Hamiltonians involved in these processes [8, 9] the RF-difference condition is referred to as zero-quantum-CP or ZQ-CP and the RF-sum condition as double-quantum-CP or DQ-CP.
The inhomogeneity of the RF amplitudes in most NMR coils makes it impossible to meet the Hartmann-Hahn condition everywhere in the sample space simultaneously, thereby limiting the ability of CPMAS to optimize the signal enhancement. Several methods were developed to widen the workable RF-amplitude ranges beyond the narrow Hartmann-Hahn conditions, such as synchronous phase reversals of the two RF fields [8–11], amplitude modulations of one of the RF fields [12–14], adiabatic frequency sweep [15], adiabatic amplitude modulation [16, 17], and the now universally applied method of ramped-amplitude of one of the RF fields [18]. As far as we know, the major objective of all of these approaches is to maximize the ultimate signal intensity of the to-be-detected nuclei [19, 20]. However, there are experiments where CPMAS is an essential part of the pulse sequence such that the results are not only controlled by the intended spin dynamics caused by the pulse sequence but also by the detection level produced by the cross-polarization stage. While in the literature this complexity is frequently mentioned and the effects of imperfect RF amplitudes are often investigated and even explicitly incorporated in lineshape simulations [21–23], we are not aware of a publication aimed at a detailed quantitative understanding of experimentally measured spectra by considering it to be the combination of the sub-spectra originating at different sample positions. With the current work our attempt is to address this issue by investigating the effect of RF distributions on experimental results of cross-polarization with varying contact time (CPVC), a powerful method for measuring the magnitude of heteronuclear dipolar interaction between a proton and a neighboring nucleus [24, 25]. The following section describes the main characteristics of these experiments, after which lineshape distortions caused by RF amplitude mismatch are surveyed. Since the overall influence of a position-dependent mismatch can only be evaluated if we have a realistic model of the RF inhomogeneity profile across the sample space, we next concentrate on formulating an analytical expression for such a model and on determining its numerical parameters in actual MAS probes by analyzing nutation spectra. Experimental nutation spectra are used to determine the RF profiles of the triple-resonance solenoid coils of a 3.2-mm and a 1.6-mm probe. This is followed by an analysis of how this model controls the CPMAS detection efficiency at different sample locations and our predictions are verified by experimental nutation spectra. Finally, these findings are extended to simulations investigating the effects of RF inhomogeneity on CPVC, serving as an example that CPMAS not only has the benefits of signal enhancement and molecular structure determination but also of suppressing unwanted signal contributions.
EXPERIMENTAL
Materials
Natural abundance adamantane, [U-15N]-labeled N-acetyl-valine (NAV), [U-13C,15N]-labeled L-alanine and [U-13C,15N]-labeled N-formyl-Met-Leu-Phe (MLF) were purchased from Cambridge Isotope Laboratories and used without any further purification. The powder samples were packed into either 1.6 mm or 3.2 mm Varian rotors for subsequent NMR experiments.
Pulse Sequences
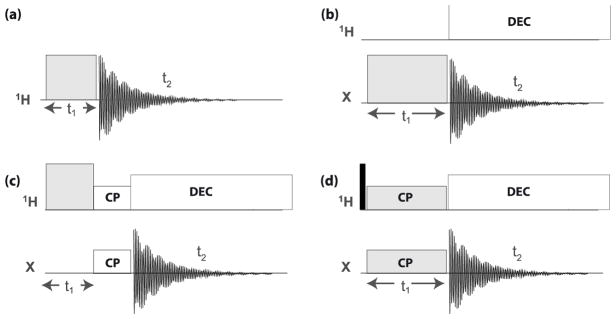
Figure 1 gives a schematic overview of the pulse programs under consideration. The direct-detection nutation spectra (Figure 1a and 1b) are used by us as the source of information about the important features of the RF profile. When the nutation signal of the protons is detected via cross-polarization to a neighboring X nucleus (13C or 15N), the spin dynamics controlling the CP-process modifies the line shape of the nutation spectrum reflecting the sample-position dependence of the CPMAS efficiency (Figure 1c). The CPVC experiment (Figure 1d) was successfully applied to the measurements of dipolar coupling constants (DCC) of 1H-X interactions in a variety of samples [23–27]. It requires Hartmann-Hahn matching of the RF amplitudes of 1H and X (specified below).
Figure 1.
The pulse sequences discussed in this report. (a) direct-detection 1H nutation, (b) direct-detection heteronuclear (X) nutation with 1H decoupling during the acquisition period, (c) indirect CP-detected 1H nutation, and (d) 1H-13C CPVC spectroscopy. In all cases the t1-dependent signal is the source of the FT’d spectrum of interest, and (c) is with a fixed CP contact time. Not displayed in experiments (d) are multi-dimensional detection schemes that are often included to allow chemical-shift resolved observation of the t1-dependent signals.
NMR Spectroscopy
All NMR experiments were carried out on a Varian 14.1 T InfinityPlus solid-state NMR spectrometer, operating at a Larmor frequency of 599.8 MHz for 1H, 150.8 MHz for 13C, and 60.8 MHz for 15N. A Varian 3.2 mm HXY TXI probe and a Varian 1.6 mm HXY fast-MAS probe were used. All nutation NMR spectra were recorded at a MAS frequency of 20 kHz, and all CPVC dipolar spectra were recorded at 40 kHz; the frequency was controlled to within ±5 Hz.
For NMR experiments on the 3.2 mm HXY probe, the typical 90° pulse length was 2.9 μs (1H), 3.6 μs (13C) and 4.9 μs (15N). The 1H and 13C direct-detection nutation spectra were carried out on water or adamantane, using the pulse sequences shown in Fig. 1a and 1b, respectively. The recycle delay was 10 s. 2D nutation spectra were recorded with a total 128 t1 increments and dwell time of 3 μs. 1H→13C CP detected 1H nutation spectra were performed on alanine with a contact time of 1.0 ms and a recycle delay of 5 s. During the 1H→13C CP transfer, an RF field irradiation with constant amplitude of 70 kHz was applied on 1H; either linearly ramped or constant-amplitude RF field applied on 13C was optimized experimentally to achieve the first-order Hartmann-Hahn matching conditions. In both linear-ramp and flat CP detected 1H nutation spectra, a total 128 t1 increments were recorded with a dwell time of 3 μs.
For NMR experiments on the Varian 1.6 mm TXI probe, the typical 90° pulse length was 2.0 μs (1H), 3.2 μs (13C) and 4.0 μs (15N). The 1H and 13C direct-detection nutation spectra were carried out on adamantane with 128 t1 increments and a dwell time of 3 μs, and the recycle delay was 10 s. 1H→15N CP detected 1H nutation spectra were performed on NAV with a CP contact time of 1.5 ms, a 4 μs dwell time, and a recycle delay of 5 s. Experimentally optimized linear-ramp RF field was applied on 15N while a constant-amplitude rf field was applied on 1H during the CP transfer. 1H→13C CP detected 1H nutation spectra were performed on MLF with a contact time of 1.0 ms, a 3 μs dwell time, and a recycle delay of 5 s. During the 1H→13C CP transfer, an RF field irradiation with constant-amplitude of 90 kHz was applied on 1H; the RF field applied on 13C was optimized experimentally to achieve the first-order Hartmann-Hahn matching conditions. In both linear-ramp and flat CP detected 1H nutation spectra, a total 128 t1 increments were recorded. 2D 1H-13C CPVC spectra were recorded on MLF spun at a MAS frequency of 40 kHz. Zero-quantum (ZQ) CP matching condition was optimized, and the first-order Hartmann-Hahn matches were found, where the constant-amplitude fields were 100 kHz and 60 kHz for 1H and 13C, respectively. RF field matched and manually mismatched CPVC experiments were performed, with respective rf fields of v1H − v1C = 40, 46, or 34 kHz. A total of 48 t1 increments with dwell time of 25 μs were used to record each CPVC spectrum.
Numerical Simulations
Two Fortran-95 simulation programs were written to calculate nutation spectra and CPVC spectra. The RF inhomogeneity was implemented by summation of sub-spectra originating from small sample sections, taking into account a position-dependent RF-amplitude profile. We avoided summation over the distribution in RF-amplitude space, an approach that makes it difficult to deal with the distribution singularity (see below).
RESULTS AND DISCUSSION
CPVC SPECTRA UNDER RF MISMATCH
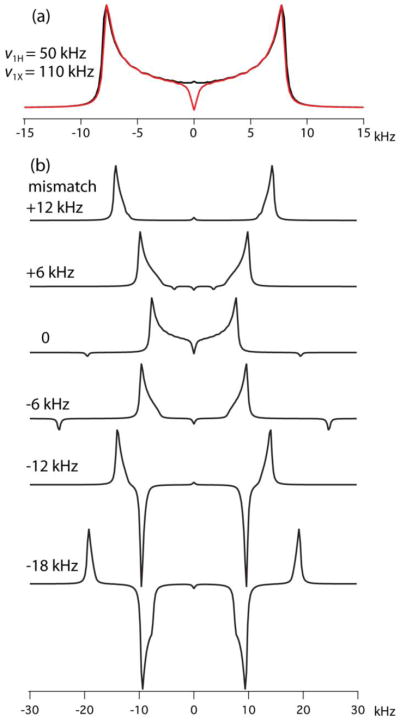
As an example of the effects of RF-amplitude imperfections on CPVC spectra we consider an 1H13C spin pair with a typical rigid-limit dipolar coupling constant (DCC) of 22.5 kHz. Following recently made recommendations [23], we choose a relatively high MAS frequency of νR = 60 kHz and RF amplitudes for 1H and 13C of ν1H = 50, ν1X = 110 kHz, matching the ν1H − ν1X = nνR Hartmann-Hahn condition of n = −1 for ZQ-CP. Figure 2a shows the powder-integrated simulated CPVC spectrum together with the FT of a time-domain signal evaluated by the average-Hamiltonian derived analytical expression [9]
Figure 2.
Simulated CPVC lineshapes for a 1H13C spin pair with a DCC of 22.5 kHz, spinning at 60 kHz. a) The RF amplitudes, indicated in kHz, are ZQ-CP Hartmann-Hahn matched and the full QM calculated spectrum (red) is compared with the spectrum evaluated with the analytical expression (black), Equation (1). b) ν1H and ν1X simultaneously deviate from their matched values by 20%, 10%, 0%, −10%, −20%, −30%, leading to the listed Hartmann-Hahn mismatches in kHz.
| (1) |
where τ is the CP contact time, and the νCP frequency is
| (2) |
D being the DCC and β the angle between the rotor axis and the CH vector. Clearly, the average-Hamiltonian expression predicts the actual spin evolution perfectly. If the experiment is performed with an inhomogeneous RF field, and if, for example, we assume that the two RF amplitudes have identical local fractional deviations that range from 20% to −30% of the matched amplitudes, we are dealing with RF-amplitude combinations listed near the corresponding simulated CPVC spectra in Figure 2b. We see that even a relatively small Hartmann-Hahn mismatch leads to severe lineshape distortions. In addition, we see negative signals in the low-amplitude region. These are the results of near matching of the Hartmann-Hahn condition of double-quantum or DQ-CP (ν1H + ν1X = nνR, n = 2), the signal of which is known to have a sign opposite to the ZQ-CP signal [7]. The spectra shown in Fig. 2b were simulated by the integration of the Liouville-von Neumann equation including the full Hamiltonian. They turn out to be close to lineshapes calculated by extensions of the analytical expressions of Equations (1, 2) covering Hartmann-Hahn mismatch [9, 27] and including both ZQ- and DQ-CP contributions, [28]
| (3) |
where
| (4) |
and
| (5) |
Disregarding the oscillating cosine term, the signal intensity of a crystallite with effective dipolar-interaction frequency νn depends, in the vicinity of a matched condition, on the mismatch Δ = ν1H ± ν1X + nνR as a Lorentzian with a half width of νn. Equation (5) explains why with a mismatch of Δ the peak positions in Figure 2b shift from the ideal to , a distortion that with a growing mismatch starts out slowly (a 1 kHz shift when Δ = 4 kHz) and then has the peak position close to Δ, nearly independent of D.
RF INHOMOGENEITY PROFILE
The RF field in the sample spaces of many MAS probes has an inhomogeneity that can be larger than 50%, and even when the sample space is restricted to a central coil region, an inhomogeneity of 20% may be experienced. In view of the spectral distortions shown in Figure 2, one wonders how reliable an analysis of experimental spectra under the assumption of perfect matching can possibly be. Here we show that the inhomogeneity does not affect the accuracy of the spectral analysis to an unacceptable level. This fortunate outcome is, to a large extent, the result of the sample-position dependence of the efficiency of the 1H→X CP, which in CPVC experiments has an essential impact on the signal formation.
To numerically analyze the effects of RF inhomogeneity, we choose a simplified RF profile model motivated by the position dependence of the calculated axial magnetic field in a cylinder (a single-winding “scroll coil”) of length 2L and radius r carrying a homogeneous circular electrical current. This field is evaluated by application of the Biot-Savart law, which predicts that the axial field at a distance z from the center of a circular current loop is given by
| (6) |
Integration over the cylinder length yields the field profile along the cylinder axis [29],
| (7) |
where z is now the distance from the cylinder center. When comparing the curves we found that between the cylinder edges they almost exactly follow a model given by
| (8) |
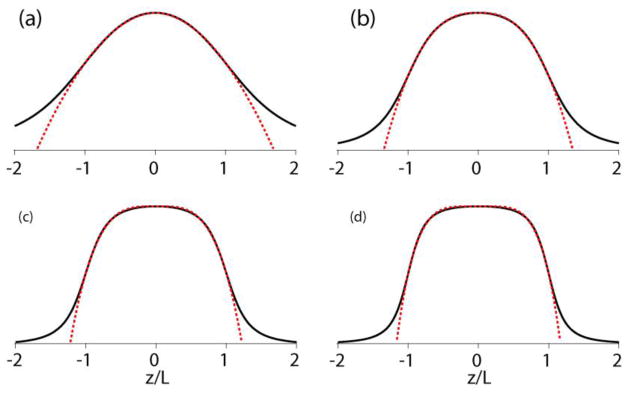
where λ is the fraction to which the field drops from the center to the edges, i.e., from z/L= 0 to 1. The model parameters depend on the length/diameter ratio or L/r, as can be seen in the examples shown in Figure 3a–d. There is a good chance that this power-function model has been thought of in the past but it is not known to us.
Figure 3.
Axial magnetic-field-amplitude profiles (black solid line) in circular cylinders carrying a homogeneous circular current compared with the power-function model (red dotted line). In (a) ~ (d): diameter/length ratios are L/r = 1, 2, 3, 4, matching exponents are ε = 1.9, 2.6, 3.6, 4.6, and edge-field/center-field ratios are λ = 0.63, 0.54, 0.52, 0.51, respectively.
Beyond the edges the model deviates far from the actual gradually decaying field strength. To let a model include these decaying wings, one can choose a Gaussian position dependence, as is often done to represent the RF profile in actual solenoids [19, 20]. As seen in Figure S1 in the Supporting Information this indeed fits Equation (7) quite well when L/r is about 1 but for longer cylinders the Gaussian model is less adequate. λ being approximately 0.5 in long cylinders (see caption of Figure 3) can be understood by considering B at the center to be the sum of the fields produced at the edges of two long cylinders meeting in the middle. And letting the field in a long cylinder stay almost constant over a long section around the center until it eventually drops by about 50% near the edges is perfectly reflected by a power function with large ε.
In solenoids the RF profile is not exactly the same, not only because the cylinder is replaced by a wire, but also due to high-frequency effects. It has been found by Maxwell’s equation analysis [30] that when the frequency is so high that 10% of its wave length is shorter than the length of the coil wire, the field profile deviates significantly from that of a zero-frequency current, thereby rendering it less homogeneous[19, 30]. In our case the coil-wire lengths are somewhere between 4 and 9 cm whereas the wavelengths of the 1H, 13C, and 15N RF frequencies are 0.5, 2, and 5 m. It is expected to cause an RF field deviation at the proton frequency but not at the other two. Another high-frequency effect is that an unbalanced electronic circuit surrounding the coil leads to an asymmetric RF profile[19, 30].
Despite these possible deviations, the profile model used in the following analysis is defined by RF amplitudes and at the center and the edges of the sample space and by an exponent ε, such that the RF amplitude at position p is given by the power function
| (9) |
where p runs from −1 to 1 along the sample length. This model refers to the sample length and not to the solenoid geometry but it disregards the sections of the RF profile that slowly decay beyond the edges of the coil. As will be shown below, the contributions to the spectra originating from those sections of eventual sample space are totally negligible. We further disregard the rather weak dependence of the amplitude on the radial position. More importantly, we do not include the possibility of an asymmetric RF profile with respect to the central position, which is encountered in electronically unbalanced probes [19]. Obviously, we could include such profiles in our investigations, but we believe that the important features characterizing the signal detection of CPVC spectra are sufficiently demonstrated by the symmetric model. Furthermore, the actually analyzed inhomogeneities are those of profiles of two of our own probes that were found to be very close to being symmetric (see below).
Experimental support for the power-function model is found in the graphic displays of position-dependent features of RF coils in several publications [19, 31–33], which, when numerically analyzed, show that over a wide position range they follow the model of Equation (9) with ε close to 2.0 [31–33] or 2.4 [19]. The center portion of the Gaussian model [19], down to a 50% drop, agrees with ε = 1.6 of our current model. The homogeneity of coils can be improved by rearranging the configuration of the windings [34, 35]. A noteworthy example is the proton XC cross-coil and its surrounding low-frequency solenoid designed by Doty et al. [36], where the profiles of both the mean transverse field of XC and the axial field of the solenoid closely follow the ε = 2.8 model. At this stage we leave cross-coil configurations out of consideration to prevent having to define an RF profile in multi-dimensional space.
The distribution R(ν1) in RF-amplitude space is, thanks to the symmetry of our model, in a straightforward manner related to the profile in the sample space through R(ν1) ∝ |dp/dν1|, giving
| (10) |
When ε = 2, the distribution curve has the same shape as the familiar static spectrum of a CSA tensor with principal components δ//< δ⊥, i.e., , δ//< δ< δ⊥, having its sharp singularity at δ = δ⊥, which in practice is rounded by line broadening. Instead of showing examples of distribution curves for a range of ε values, we plot in Figure 4 the resulting direct-detection-nutation spectra, produced by simulations described in the following section and turning out to be proportional to ν1R(ν1). The figure indicates that such nutation spectra can quite clearly distinguish between different ε values. In practice, the parameters ε and of the power-function model can quite easily be derived from an experimental direct-detection nutation spectrum by comparing it with ν1R(ν1) curves evaluated according to Equation (10) and convoluted with a line-broadening function.
Figure 4.
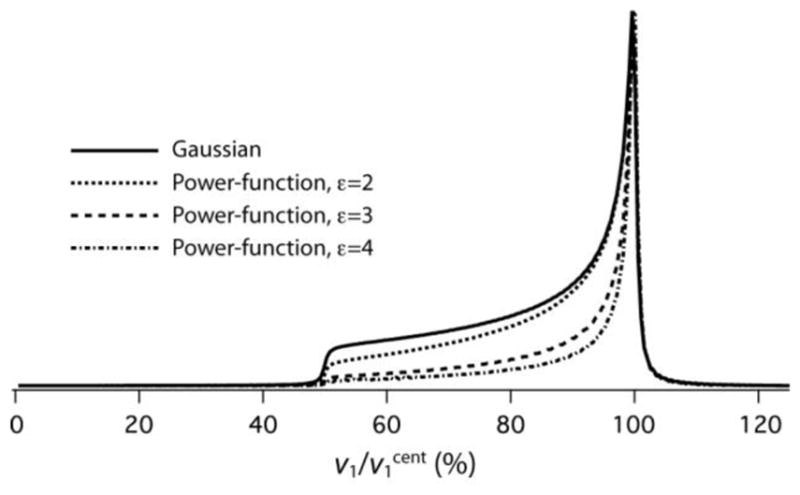
Direct-detection nutation spectra simulated for RF profiles having a ratio of 0.5 for the Gaussian model (blue) and for the power-function model with ε = 2 (red), ε = 3 (green) and ε = 4 (purple).
DIRECT-DETECTION NUTATION SPECTRA
Several methods have been used to determine the RF inhomogeneity profile across the sample space in an NMR coil [20]. One relies on solving Maxwell equations representing the actual conductor confirmation [30, 36]. Another approach uses the location-dependent resonance-frequency shift of the probe caused by the placement of a narrow metal conductor in the coil [19, 37, 38]. Some have mapped the RF profile by measuring either the signal intensity [31] or the nutation frequency [19, 32, 33] of a small sample placed at different locations in the probe. As indicated above, nutation spectra provide direct information on the RF distribution in frequency space [23, 34, 39]. A 2D nutation measurement while applying a strong magnetic field gradient along the length of the fully loaded sample space yields a direct impression of the RF dependence on the position.
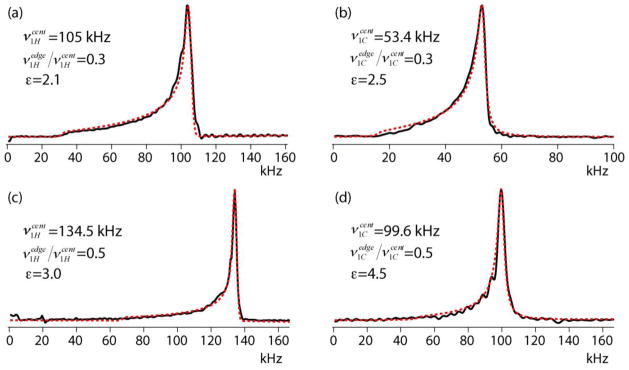
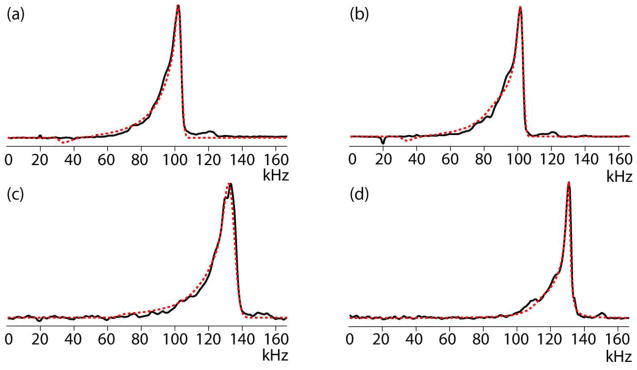
In the current study we extracted the RF profiles of two MAS probes from measured nutation spectra without application of a gradient (Figures 1a and 1b). The two probes, both having proton resonances of 600 MHz, are a Varian 3.2 mm HXY TXI probe and a Varian 1.6 mm HXY fast-MAS probe. The sample space lengths (10 mm in the 3.2 probe and 8 mm in the 1.6 mm probe) were fully filled with water or adamantine, and 1H as well as 13C nutation spectra with direct signal detection (Figure 1a) were measured. Following sine-FT, the spectra were compared with nutation spectra simulated based on the power-function model of Equation (9). In those simulations the local RF amplitude ν1(p) at a position p determines not only the nutation frequency but also the detected signal amplitude because it is assumed that the signal voltages induced in the coil by precessing magnetizations at different positions are proportional to the RF amplitudes at those positions [32]. Hence,
| (11) |
and the total signal is calculated by stepwise integration of all sample positions. The actual power ε and the ratio were considered to be the ones that best fit the experimental spectra. The results are shown in Figure 5.
Figure 5.
Direct-detection 1H (a, c) and 13C (b, d) nutation spectra of water (a) and adamantane (b–d) in the Varian 3.2 mm (a, b) and the Varian 1.6 mm (c, d) probes. Simulated spectra (red dashed line) are superposed on the experimental spectra (black solid line).
In the 3.2 mm probe the 1H nutation closely agrees with the symmetric power-function model having an exponent of 2.1 and extending to as low as 30% at the edges. If the profile had not been symmetric, the cut off at 30% would have been less defined. In any case, the low ratio indicates that the sample space is longer than the solenoid (Peter Gor’kov, private communication). The low-frequency cut-off of the 13C nutation in this probe is not as well defined. It could be the result of an asymmetric profile but since the signal contribution from the edge regions of the sample are usually not significant, we simply assume it to be symmetric with a ratio equal that of the proton profile. The difference between the ε exponents of 1H and 13C indicates that at the proton frequency the RF profile is more inhomogeneous, in accordance with the high-frequency effect mentioned above.
In the 1.6 mm probe the ε power is definitely higher than in the 3.2 mm probe. It is at least 4.5 at the low 13C Larmor frequency, and 3.0 at the high 1H Larmor frequency. Due to the strong decay on the low-frequency side the ratio is not well defined but it is around 50%. Comparison of Figures 5c and d brings out a certain level of uncertainty encountered when fitting these spectra. Although the ε in Figure 5c is smaller than in 6d, the latter spectrum looks wider in contradiction to lineshape comparisons shown in Figure 4. This is caused by the apodization applied to the time-domain signal prior to FT, the size of which is prescribed by the line broadening of the high-frequency edge of the nutation spectrum, which is higher for 13C than for 1H. As is often the case, the RF amplitude at the proton Larmor frequency has a stronger dependence on the position than at a lower frequency. An interesting way of measuring the correlation between the two profiles is by performing a 2D nutation experiment where the nutations at the two frequencies are detected in two time domains [23].
The nutation simulations also provide values for two experimental quantities of practical significance. One is the S810/S90 ratio of the signals following 90° and 810° pulses, often used for quantization of the inhomogeneity. The other is the effective RF amplitude corresponding to the length of the effective 180° pulse, defined as the shortest pulse that excites a vanishing signal. Table 1 lists these results for a range of ε and values.
Table 1.
S 810/S90 ratios and the ratios of the effective and the central RF amplitudes calculated for power-function RF profiles specified by ε and values.
| ε |
|
S810/S90 |
|
||
|---|---|---|---|---|---|
| 2 | 0.7 | 0.44 | 0.91 | ||
| 0.5 | 0.41 | 0.86 | |||
| 0.3 | 0.38 | 0.84 | |||
|
| |||||
| 3 | 0.7 | 0.57 | 0.93 | ||
| 0.5 | 0.55 | 0.90 | |||
| 0.3 | 0.52 | 0.89 | |||
|
| |||||
| 4 | 0.7 | 0.65 | 0.95 | ||
| 0.5 | 0.64 | 0.93 | |||
| 0.3 | 0.61 | 0.91 | |||
The calculated S810/S90 ratio was measured in the 1.6 mm probe to be 0.56, in good agreement with the predicted 0.55. The ratio was also measured by adjusting the effective RF amplitude to 100 kHz by letting the signal following a 5 μs pulse be zero and by performing the nutation experiment with this RF setting. It turned out to be 0.88, not much different from the predicted 0.90. A similar finding was recently reported for an inhomogeneity characterization of a 1.6 mm Agilent fast-MAS probe [39]. In the 3.2 mm probe the predicted vs. measured S810/S90 and ratios are 0.40 vs. 0.50 and 0.846 vs. 0.83, respectively. The discrepancy of the S810/S90 ratio can be understood when inspecting Figure 5a and noticing the difference between the simulated and experimental spectra. Since it stretches over a wide frequency range, it is related to a short-duration contribution to the time-domain signal. When inspecting the time domain signals (not shown), we indeed see that the simulated and measured data points match very well over nearly the total time domain but that they differ in the initial period covering the 90° pulse width. It indicates that the S810/S90 ratio may not always be representing of the essential characteristics of the RF profile.
CP-DETECTION NUTATION SPECTRA
Knowing the profile parameters as extracted from the direct-nutation spectra, we have sufficient information to predict the effect of RF inhomogeneity on all kinds of NMR experiments. To check if such predictions can be trusted, we compared the simulations of CP-detected nutation spectra with experimental results. Figure 6 shows such spectra of 13C- and 15N-CP-detected 1H nutation in the 3.2 and 1.6 mm probes spinning at 20 kHz. Because of the relatively large wavelengths of the 13C and 15N frequencies, which as mentioned above prevent them from experiencing the high-frequency deviation, we assumed their RF profiles to be identical. The CP was performed either with no amplitude variation of the RF amplitude or with a −10% to +10% ramp of the X RF amplitude (X is 13C or 15N). To optimize the Hartmann-Hahn condition the following tuning procedure was followed in the experiment as well as in the simulations. The CP-RF amplitude of 1H was about 20 kHz higher than that of X and in preparation of the nutation, the RF of X was adjusted to optimize the CP-detected signal, following a 90° 1H-excitation pulse, while keeping the 1H RF constant. Since the difference of the two amplitudes is far more important than their exact individual values, we reenacted the signal optimization in our simulation by keeping fixed at the effective amplitude used in the experiment, while varying and simulating the resulting signal under all the appropriate inhomogeneity conditions. The effect of inhomogeneity on the 90°-pulse flip angle was taken into account. The simulations were performed for an isolated 1HX pair with typical DCC of 22.5 for 1H13C [24] and 10.4 kHz for the amide 1H15N [40]. Some of the 1H15N simulations were also performed with three additional protons located at typical peptide positions in the amide neighborhood and the results were very similar to the two-spin spectra. From now on we do not take extra protons into account. In general, the simulated nutation spectra under optimized RF conditions deviated slightly from the experimental lineshapes, but lowering by 1 or 2 kHz, thereby reducing the CP-detected signal by not more than 3%, led to the fitted spectra shown in the figure. The eventual amplitudes used in the simulations are listed in the figure caption. The difference in appearance between Figures 6c and d is in part due to a large Gaussian broadening of 4 Hz that needed to be applied in the simulation to reproduce the shape of the peak and the neighboring slope. Another more fundamental reason, to be explained below, is that the DCC of 15N is smaller than that of 13C. The results give confidence that the profile parameters derived from the direct-detection nutation spectra are reliable for sources for quantitative CP-detection analysis and, more importantly, that the power-function profile is a trustworthy model, at least in the probes under investigation.
Figure 6.
Measured (black solid line) and simulated (red dashed line) CP-detection nutation spectra at 20 kHz MAS obtained in the 3.2 mm probe (top) and in the 1.6 mm probe (bottom), by applying CP without a ramp (left) or with a ±10% ramp on the X channel (right). The detected molecular sites are 13Cα in alanine (a, b), 13Cα of Met in MLF (c), and 15N in NAV (d). In the simulations, and of the CP irradiation were 70 and 46 kHz (a), 70 and 45.5 kHz (b), 90 and 64 kHz (c), and 73 and 50 kHz (d), respectively. The CP contact time was 1 ms (a, b, c) or 1.5 ms (d).
Up to this point we were interested in the RF amplitudes during the CP process. Of great importance is also the average RF amplitude experienced during the excitation pulse with its increasing length. One often needs to know this effective amplitude when matching RF conditions in a pulse sequence of which the CP can be a component, for instance in REDOR [6, 39] or in RN-symmetry experiments [40–44]. A very simple example is adjusting the excitation pulse in a CPVC experiment to 90°. In practice a 1H RF power is regularly adjusted by varying the amplitude of the excitation pulse having the length of the desired 180° pulse until a zero CP-detected signal is obtained. In practice, it is advisable to repeat the adjustment with a 360° pulse and if it differs from the 180° result, to choose the average of the two. Our simulations program provides the value of the effective RF amplitude experienced under the specified profile settings. In the examples of Figure 6 the ratio ranges from 0.90 to 0.95 and the 180°- and 360°-based values differ by 1% or less. When evaluated at higher spinning speeds and with larger CP ramps this difference can become 4%.
The shape of the nutation spectra reflects the dependence of the CP-detection efficiency on the sample position. While this efficiency is reflected by the local signal intensity following a fixed contact time, a calculation of it results in a rugged position dependence because the local signal frequencies depend on the varying local RF amplitudes, as can be seen in Equations (3–5). To overcome this oscillatory behavior we determined the local CP-efficiency by equating it to the average of the minimum and maximum values of its cycle at the end of the contact time.
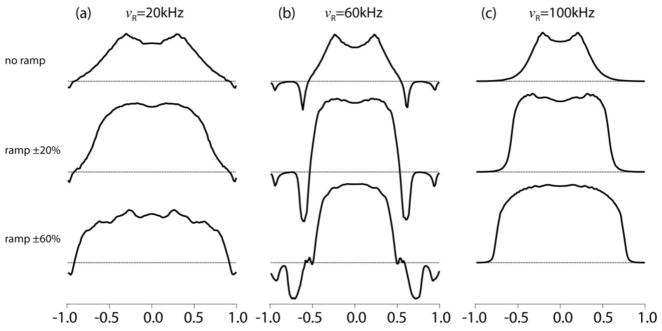
Figure 7 displays some examples of such detection profiles for different MAS rates and CP ramps, simulated for the 3.2-mm-probe RF profile. Although this probe cannot reach very high spinning speeds, we included 60 and 100 kHz in the survey as examples of what effect they have on CPMAS in rotors with an inhomogeneity of its nature. The plots represent the size of the local signal produced by the excitation pulse and CP-RF amplitudes, which are both position dependent. The 90°-excitation-pulse width corresponds to and the RF amplitudes are chosen for signal optimization. Their values are listed in the figure caption. The simulations were done for three MAS frequencies. At 20 and 60 kHz the RF was optimized for ZQ-CP and at 100 kHz was DQ-CP. In the top row the CP was performed without amplitude ramping. The maxima indicate where in the sample space the Hartmann-Hahn condition is perfectly matched: at p = ±0.32, ±0.23, and ±0.20, respectively. The widths of the curves show the space selectivity of the CP detection and how it narrows at higher spinning speeds, a behavior that can be understood in terms of Equations (3–5). For instance, if it is ZQ-CP with n = 1 and the effective dipolar frequency is ν±1, then the detection efficiency drops by 50% when the |ν1H − ν1X| difference diverges from the ideal value of νR towards νR + ν±1 ortowards νR − ν±1. Percentagewise this RF-difference range is narrower when νR is higher and, hence, the best-matched position range will be narrower. This also explains why the well-matched region is narrower when the ν±1-controlling DCC is smaller, leading to a narrower nutation spectrum for 15N than for 13C, as was seen in Figures 6c and d. This high-MAS narrowing is extremely important when a high level of homogeneity is required for a particular experiment. It also shows that at spinning speeds above 60 kHz, half of the sample in a fully filled rotor is essentially wasted because of its negligible contribution to the measured spectrum. Obviously, this situation is less severe in a probe with better homogeneity, as can be seen for the 1.6 mm probe in Figure S2 in the Supporting Information. The negative peaks in the 60 kHz profile in Figure 7 are the result of DQ-CP matching (ν1H + ν1X = nνR) at positions p = ±0.61 where n = 2, and ±0.94 where n = 1. In practice, it is difficult to avoid this DQ matching when doing ZQ-CP at high MAS frequencies, unless one can greatly increase the CP-RF amplitudes. At 20 kHz MAS there is also a small DQ-CP feature seen near the edges, showing up as a small negative peak at 35 kHz in the simulated nutation spectra in Figure 6a and b. It is not observed in the experimental spectra as a result of the deviation of the 13C direct-detection nutation spectrum from the model near the edges, seen in Figure 5b. In fact, the DQ detection profile at 100 kHz also has a negative sign but we plotted it as if it is positive.
Figure 7.
Position dependence of a CP-generated 13C signal intensity simulated assuming the RF inhomogeneity profile of the 3.2 mm probe for three MAS frequencies and three sizes of the 13C RF irradiation ramp. During the CP irradiation the amplitudes were 70 kHz at 20 kHz MAS, 110 kHz at 60 kHz MAS, and 40 kHz at 100 kHz MAS. For the 0%, ±20%, and ±60% ramps, was optimized for ZQ-CP at 20 kHz MAS to 47, 47, and 57 kHz; for ZQ-CP at 60 kHz MAS to 47, 47, and 61 kHz; and for DQ-CP at 100 kHz MAS to 62, 70, and 75 kHz, respectively. The DCC was 22.5 kHz and the CP contact time was 1 ms.
When one is more interested in the over-all signal intensity than in RF-amplitude perfection, ramping the amplitude during CP has the advantage of broadening the detection profile [18, 20], as can be seen in the second and third rows of Figure 7, where is ramped from −20% to +20% or from −60% to +60%. In the case of 60 kHz MAS the broadening is limited due to competition with DQ-CP. The intensities are also enhanced as a result of the adiabatic transfer induced by the RF ramp [16, 17]. At 20 kHz MAS an introduction of ±20% ramp does not have a large effect of the shape of the detection profile, which explains why the two CP-detection nutation spectra in Figure 6a and b, measured with 0% and ±10% ramps, are indistinguishable.
CPVC SPECTRA UNDER RF INHOMOGENEITY
The insights gained in the previous sections are now applied to an investigation of RF inhomogeneity on CPVC spectra. Many of our observations to be described were recently reported by Paluch et al. [23] but are here presented in a somewhat different context. It is recommended to perform CPVC measurements at MAS frequencies of at least 60 kHz and to let the proton RF amplitude be lower than that of the low-γ neighboring spin [23]. Therefore, we simulate here CPVC spectra of a 1H13C spin pair with a DCC of 22.5 kHz at 60 kHz MAS with a of 110 kHz and an optimized around 50 kHz. As required for CPVC, the CP is performed with no RF ramp. Although our 3.2 mm probe cannot attain such a high MAS frequency, it is nevertheless of interest to find out how the wide inhomogeneity of a probe with such RF profile will affect the CPVC spectrum. In this profile the detected signal is optimized by setting to 48 kHz, under which conditions the CP-detection profile is similar to that shown for 60 kHz in Figure 7. The resulting CPVC spectrum is shown in Figure 8a. In the center column of Figure 9 are plotted the spectrum contributions that originate from the four sample sections of equal length that make up one half of the total sample space, the four sections of the other half being identical because of the profile symmetry.
Figure 8.
Simulated 1H13C CPVC spectra for RF inhomogeneity of the 3.2 and 1.6 mm probes (red) plotted together with ideally Hartmann-Hahn matched spectra (blue). MAS frequency is 60 kHz, is 110 kHz and the optimized amplitudes are 48 and 50 kHz for the two probes, respectively. DCC = 22.5 kHz.
Figure 9.
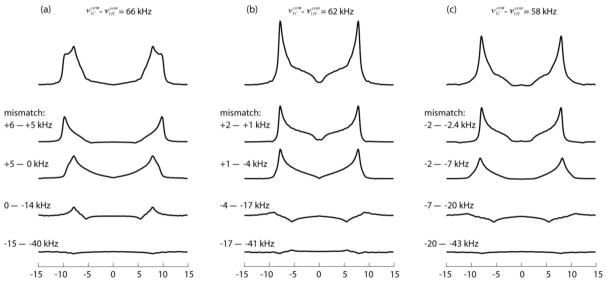
PVC spectra of a 1H13C-spin-pair in the RF inhomogeneity profile of the 3.2 mm probe, simulated for νR = 60 kHz, , and three values of the difference: 62 kHz being the optimized CP setting and the other two leading to a 25% reduced CP signal. On top are shown the total spectra and below them the subspectra originating in 1/8-length sample sections separated at p = 0, 0.25, 0.5, 0.75 and 1. The ranges of the Hartmann-Hahn mismatche, ν1C − ν1H − νR in kHz, covered by the sections are listed next to the subspectra.
The subspectra with p > 0.5 are seen to have a small intensity and are dominated by negative contributions corresponding to the negative peaks in the detection profile seen in Figure 7 due to DQ-CP matching. Disregarding their relatively small negative signal contributions, we see that the majority of the signal comes from the center region covering about half of the sample length. Between the center and p = ±0.5 the Hartmann-Hahn mismatch ranges from +2 to −4 kHz. Referring back to the mismatched spectra shown in Figure 2b we see that these mismatches barely affect the lineshapes. Hence, thanks to the Hartmann-Hahn selectivity of the CP dynamics the spectral distortions remain quite limited, as is evident in Fig. 8a, where the spectrum is plotted together with the spectrum to be expected under perfect homogeneous matching. When curve-fitted to an ideal spectrum shape, while disregarding the central region between −7 and 7 kHz, the best-fit results are DCC = 23.0 (instead of the actual 22.5) kHz with a Lorentzian line broadening of 0.7 kHz instead of the 0.5 kHz applied in the simulations. The fitting procedure also allows for an asymmetry parameter of the dipolar tensor but in this case it came out as small as 0.01. In other words, the large inhomogeneity of the 3.2 mm probe has hardly any effect, not only on the CPVC peak positions [23] but neither the entire lineshape. Also to be mentioned is that sample portions at positions where RF amplitude is weak, experience inefficient proton decoupling during detection, leading to broadening and further intensity reduction of their contribution to the observed peaks.
It must be noted that failing to adjust the RF amplitudes to optimized signal detection can still lead to spectral distortions. The left and right columns of Figure 9 show examples of the effects of non-optimized RF settings on CPVC spectra obtained in the inhomogeneity of the 3.2 mm probe. In both cases is improperly adjusted to the extent that the CP-signal intensity is diminished to about 25% below the optimized signal, i. e., to 66 or to 58 kHz. One sees that the lineshape distortion is large when the RF difference is increased but hardly noticeable when it is decreased. This can be understood when inspecting the subspectra in Figure 9 and taking notice of the local Hartmann-Hahn mismatch ranges indicated next to the plots. When the over-all mismatch is on the high side, the perfect matching is located away from the sample center and the mismatched central region, which has a large impact on the total signal, adds an array of subspectra having wider peak splittings (see Figure 2). On the other hand, with over-all mismatching on the high side, perfect matching is found nowhere in the sample space, but the distortions coming from the central region are very small. By fitting the distorted lineshapes to an ideal spectrum, one obtains an apparent DCC and a nonzero asymmetry parameter η, which reflects the lineshape widening beyond the main peaks. It is a way to quantify the distortion observations just made: When increasing the ν1C − ν1H difference from the optimal 62 kHz to 66 kHz, the fit results are DCC = 26.1 kHz, η = 0.32 instead of the actual DCC = 22.5 kHz, η = 0; whereas when decreasing the difference to 58 kHz, one gets a much less deviating result of DCC = 23.4 kHz, η = 0.02. These observations lead to the important practical advice that, when tuning up the spectrometer for CPVC and the optimized Hartmann-Hahn matching is not well defined, it is preferable to choose an RF amplitude setting with the difference on the small side.
As expected, the situation is even better in the less inhomogeneous 1.6 mm-probe profile, as can be seen in Figure 8b, where the spectrum affected by inhomogeneity agrees even better with the ideal spectra with the almost perfect fit results of DCC = 22.7 kHz, η = 0.00. But the Hartmann-Hahn mismatch effects are still similar to what we found for the 3.2 mm probe. Experimental evidence was obtained by CPVC measurements of the Cα sites of MLF in our 1.6 mm probe spinning at the near-highest attainable speed of 40 kHz. The effective 1H RF amplitude was 100 kHz and three spectra were measured with the 13C RF close to its optimized value and with its amplitude reduced or increased by 6 kHz. The results are shown in Figure 10 together with simulated lineshapes calculated for the 1.6 mm probe RF profile, with and with the three values of 48, 56, and 62 kHz for , chosen such that they closely fit the experimental spectra. In Figure S3 of the Supporting Information one can see how the different sample regions contribute to these spectra. Even with the current RF profile, having a higher degree of homogeneity than in the 3.2 mm probe, the quarter of the sample located near the edges is not detected by CPMAS. An interesting observation is that even with a large over-all mismatch, the sample region where the Hartmann-Hahn condition is matched contributes distinguishable peaks at the ideal frequencies, from which the DCC can directly be derived, as was reported by Paluch et al. [23]. However, when the dipolar tensor is asymmetric due to molecular motions, this will be more complicated. The peak at ±14 kHz in the 52 kHz RF-difference spectrum is also model independent because it is determined by the DCC and the Hartmann-Hahn mismatch at the center according to Equation (5). However, the height ratio of the peaks in that figure does depend on the details of the RF profile and we found that deviations from the model parameters of the 1.6 mm probe, e.g, changing the ε exponents by 0.5, give spectra that clearly deviate from the measured lineshape (not shown). This lineshape agreement is again evidence that our power-function model is a useful approach to quantization of the RF profile in a solenoid.
Figure 10.
Experimental CPVC spectra (red) of the Cα sites in MLF (the spectra of the three residues added together) measured in the 1.6 mm probe at 40 kHz with a 1H RF of 100 kHz and 13C RF of 54, 60, and 66 kHz, plotted together with corresponding simulated spectra (black) with DCC = 22.5 kHz, and the three differences of (a) 52 kHz, (b) 44 kHz, and (c) 38 kHz.
CONCLUSION
In conclusion, we have demonstrated that RF inhomogeneity across the sample could potentially have detrimental effect on the accuracy of the spectral parameters measured through various recoupling sequences. However, this problem is greatly alleviated when cross-polarization is utilized for signal generation, due to the spatial selectivity in the Hartmann-Hahn matching condition. As the result, most of the recoupling sequences when combined with cross polarization still yield reasonably accurate parameters even in the cases of high RF inhomogeneity. The simulations further indicate that the spectral contributions from portions of the sample located in the outlying regions of an inhomogeneous RF profile are both weak and distorted. From the practical standpoint, use of samples that are space-restricted within the MAS rotor to the homogeneous region of the coil is highly advantageous. Such approach is already widely used in the NMR community including our group. The length of the space restriction that best meets experimental requirements depends on the actual position-dependent RF-amplitude profile. Therefore, it is recommended to measure the direct-detection nutation spectra at the Larmor frequencies of interest to compare them with simulated model-dependent spectra. In our examples a power-function model proved to be applicable and we described a straightforward method of simulating the corresponding nutation spectra.
Supplementary Material
highlights.
The effect of RF inhomogeneity on CP under MAS is discussed.
A power-function model is introduced to quantify the position-dependent RF-amplitude profile.
The model is experimentally verified by direct-detect and CP nutation spectra.
Spatial selectivity in Hartmann-Hahn matching condition alleviates RF inhomogeneity in CPMAS.
Recoupling sequences combined with CP yield accurate parameters even in high RF inhomogeneity.
Acknowledgments
This work was supported by the National Institute of Health (NIH Grant-P50GM082251) and is a contribution from the Pittsburgh Center for HIV Protein Interactions. We acknowledge the support of the NSF CHE0959496 grant for acquisition of 850 MHz NMR spectrometer and of the NIGMS 1 P30 GM110758-01 grant for the support of core instrumentation infrastructure at the University of Delaware.
Footnotes
Publisher's Disclaimer: This is a PDF file of an unedited manuscript that has been accepted for publication. As a service to our customers we are providing this early version of the manuscript. The manuscript will undergo copyediting, typesetting, and review of the resulting proof before it is published in its final citable form. Please note that during the production process errors may be discovered which could affect the content, and all legal disclaimers that apply to the journal pertain.
References
- 1.Schaefer J, Stejskal EO. J Am Chem Soc. 1976;98:1031–1032. [Google Scholar]
- 2.Polenova T, Gupta R, Goldbourt A. Anal Chem. 2015;87:5458–5469. doi: 10.1021/ac504288u. [DOI] [PMC free article] [PubMed] [Google Scholar]
- 3.Pines A, Gibby MG, Waugh JS. J Chem Phys. 1973;59:569–590. [Google Scholar]
- 4.Hartmann SR, Hahn EL. Phys Rev. 1962;128:2042–2053. [Google Scholar]
- 5.Stejskal EO, Schaefer J, Waugh JS. J Magn Reson. 1977;28:105–112. [Google Scholar]
- 6.Gullion T, Schaefer J. J Magn Reson. 1989;81:196–200. doi: 10.1016/j.jmr.2011.08.012. [DOI] [PubMed] [Google Scholar]
- 7.Meier BH. Chem Phys Lett. 1992;188:201–207. [Google Scholar]
- 8.Levitt MH, Suter D, Ernst RR. J Chem Phys. 1986;84:4243–4255. [Google Scholar]
- 9.Wu X, Zilm KW. J Magn Reson, Ser A. 1993;104:154–165. [Google Scholar]
- 10.Zhang SM, Meier BH, Appelt S, Mehring M, Ernst RR. J Magn Reson, Ser A. 1993;101:60–66. [Google Scholar]
- 11.Zhang SM, Meier BH, Ernst RR. J Magn Reson, Ser A. 1994;108:30–37. [Google Scholar]
- 12.Hediger S, Meier BH, Ernst RR. Chem Phys Lett. 1993;213:627–635. [Google Scholar]
- 13.Peersen OB, Wu XL, Kustanovich I, Smith SO. J Magn Reson, Ser A. 1993;104:334–339. [Google Scholar]
- 14.Peersen OB, Wu XL, Smith SO. J Magn Reson, Ser A. 1994;106:127–131. [Google Scholar]
- 15.Hediger S, Meier BH, Kurur ND, Bodenhausen G, Ernst RR. Chem Phys Lett. 1994;223:283–288. [Google Scholar]
- 16.Zhang SM, Czekaj CL, Ford WT. J Magn Reson, Ser A. 1994;111:87–92. [Google Scholar]
- 17.Hediger S, Meier BH, Ernst RR. Chem Phys Lett. 1995;240:449–456. [Google Scholar]
- 18.Metz G, Wu XL, Smith SO. J Magn Reson, Ser A. 1994;110:219–227. [Google Scholar]
- 19.Paulson EK, Martin RW, Zilm KW. J Magn Reson. 2004;171:314–323. doi: 10.1016/j.jmr.2004.09.009. [DOI] [PubMed] [Google Scholar]
- 20.Suzuki K, Martineau C, Fink G, Steuernagel S, Taulelle F. Magn Reson Chem. 2012;50:159–168. doi: 10.1002/mrc.3798. [DOI] [PubMed] [Google Scholar]
- 21.Bak M, Rasmussen JT, Nielsen NC. J Magn Reson. 2000;147:296–330. doi: 10.1006/jmre.2000.2179. [DOI] [PubMed] [Google Scholar]
- 22.Brouwer DH, Ripmeester JA. J Magn Reson. 2007;185:173–178. doi: 10.1016/j.jmr.2006.12.003. [DOI] [PubMed] [Google Scholar]
- 23.Paluch P, Trébosc J, Nishiyama Y, Potrzebowski MJ, Malon M, Amoureux JP. J Magn Reson. 2015;252:67–77. doi: 10.1016/j.jmr.2015.01.002. [DOI] [PubMed] [Google Scholar]
- 24.Paluch P, Pawlak T, Amoureux JP, Potrzebowski MJ. J Magn Reson. 2013;233:56–63. doi: 10.1016/j.jmr.2013.05.005. [DOI] [PubMed] [Google Scholar]
- 25.Park SH, Yang C, Opella SJ, Mueller LJ. J Magn Reson. 2013;237:164–168. doi: 10.1016/j.jmr.2013.10.009. [DOI] [PMC free article] [PubMed] [Google Scholar]
- 26.Amoureux JP, Pruski M. Mol Phys. 2002;100:1595–1613. [Google Scholar]
- 27.Zhang RC, Damron J, Vosegaard T, Ramamoorthy A. J Magn Reson. 2015;250:37–44. doi: 10.1016/j.jmr.2014.10.013. [DOI] [PMC free article] [PubMed] [Google Scholar]
- 28.Marica F, Snider RF. Solid State Nucl Magn Reson. 2003;23:28–49. doi: 10.1016/S0926-2040(02)00013-9. [DOI] [PubMed] [Google Scholar]
- 29.Gor’kov PL, Chekmenev EY, Li CG, Cotten M, Buffy JJ, Traaseth NJ, Veglia G, Brey WW. J Magn Reson. 2007;185:77–93. doi: 10.1016/j.jmr.2006.11.008. [DOI] [PubMed] [Google Scholar]
- 30.Engelke F. Concepts Magn Reson. 2002;15:129–155. doi: 10.1002/cmr.10030. [DOI] [PMC free article] [PubMed] [Google Scholar]
- 31.Campbell GC, Galya LG, Beeler AJ, English AD. J Magn Reson, Ser A. 1995;112:225–228. [Google Scholar]
- 32.Nishimura K, Fu RQ, Cross TA. J Magn Reson. 2001;152:227–233. [Google Scholar]
- 33.Vega AJ. J Magn Reson. 2004;170:22–41. doi: 10.1016/j.jmr.2004.05.017. [DOI] [PubMed] [Google Scholar]
- 34.Horne D, Kendrick RD, Yannoni CS. J Magn Reson. 1983;52:299–304. [Google Scholar]
- 35.Gor’kov PL, Brey WW, Long JR. Encyclopedia of Nuclear Magnetic Resonance. John Wiley & Sons, Ltd; 2010. Probe Development for Biosolids NMR Spectroscopy. [Google Scholar]
- 36.Doty FD, Kulkarni J, Turner C, Entzminger G, Bielecki A. J Magn Reson. 2006;182:239–253. doi: 10.1016/j.jmr.2006.06.031. [DOI] [PubMed] [Google Scholar]
- 37.Maier LC, Slater JC. J Appl Phys. 1952;23:68–77. [Google Scholar]
- 38.Ginzton EL. Microwave Measurements. Literary Licensing, LLC; 1957. pp. 435–461. [Google Scholar]
- 39.Haller JD, Schanda P. J Biomol NMR. 2013;57:263–280. doi: 10.1007/s10858-013-9787-x. [DOI] [PMC free article] [PubMed] [Google Scholar]
- 40.Hou G, Paramasivam S, Yan S, Polenova T, Vega AJ. J Am Chem Soc. 2013;135:1358–1368. doi: 10.1021/ja3084972. [DOI] [PMC free article] [PubMed] [Google Scholar]
- 41.Carravetta M, Edén M, Zhao X, Brinkmann A, Levitt MH. Chem Phys Lett. 2000;321:205–215. [Google Scholar]
- 42.Levitt MH. Symmetry-Based Pulse Sequences in Magic-Angle Spinning Solid-State NMR. In: Grant DM, Harris RK, editors. Encyclopedia of Nuclear Magnetic Resonance. John Wiley & Sons, Ltd; Chichester: 2002. pp. 165–196. [Google Scholar]
- 43.Hou G, Gupta R, Polenova T, Vega AJ. Isr J Chem. 2014;54:171–183. doi: 10.1002/ijch.201300099. [DOI] [PMC free article] [PubMed] [Google Scholar]
- 44.Hou G, Lu XY, Vega AJ, Polenova T. J Chem Phys. 2014;141:104202. doi: 10.1063/1.4894226. [DOI] [PMC free article] [PubMed] [Google Scholar]
Associated Data
This section collects any data citations, data availability statements, or supplementary materials included in this article.


