

Abstract
Background: Foods that enhance satiety can help consumers to resist environmental cues to eat and help adherence to calorie restriction. The objective of this study was to compare the effect of 2 oat-based breakfast cereals on appetite, satiety, and food intake.
Methods: Forty-eight healthy individuals, 18 years of age or older, were enrolled in a randomized, crossover trial. Subjects consumed isocaloric servings of either oatmeal or an oat-based ready-to-eat breakfast cereal (RTEC) in random order at least a week apart. Visual analogue scales measuring appetite and satiety were completed before breakfast and throughout the morning. Lunch was served 4 hours after breakfast. The physicochemical properties of oat soluble fiber (β-glucan) were determined. Appetite and satiety responses were analyzed by area under the curve. Food intake and β-glucan properties were analyzed using t tests.
Results: Oatmeal increased fullness (p = 0.001) and reduced hunger (p = 0.005), desire to eat (p = 0.001), and prospective intake (p = 0.006) more than the RTEC. Energy intake at lunch was lower after eating oatmeal compared to the RTEC (p = 0.012). Oatmeal had higher viscosity (p = 0.03), β-glucan content, molecular weight (p < 0.001), and radius of gyration (p < 0.001) than the RTEC.
Conclusions: Oatmeal suppresses appetite, increases satiety, and reduces energy intake compared to the RTEC. The physicochemical properties of β-glucan and sufficient hydration of oats are important factors affecting satiety and subsequent energy intake.
Key words: oats, β-glucan, satiety, energy intake, physicochemical properties
Abbreviations
- RTEC
ready-to-eat breakfast cereal
- BMI
body mass index
- PBRC
Pennington Biomedical Research Center
- VAS
visual analogue scale
- AACC
American Association of Cereal Chemists
INTRODUCTION
Overweight and obese individuals are at an increased risk for cardiovascular diseases, diabetes, musculoskeletal diseases, and certain cancers [1]. Worldwide, 3.4 million deaths per year are attributed to being overweight or obese [1]. Research spanning several years suggests that certain components of food can produce significant effects on the regulation of appetite in the short term. A diet containing these foods could translate into reductions in body weight when coupled with other lifestyle changes [2].
β-Glucan is a dietary fiber found in significant amounts in oats and barley [3]. Oat β-glucans are linear polysaccharides that can be viewed as a cellulose chain. Approximately 70% are 4-O-linked units interrupted by 3-O-linked β-D glucopyranosyl units. The (1→3) linkages occur singly, whereas the 4-O-linked mostly occur in groups of 2 or 3 [4]. Approximately 75% to 78% of the β-glucan content of oats is found in the endosperm cell walls. β-Glucan is generally water soluble and in solution is viscous even at low concentrations [3].
Increased viscosity of gastrointestinal contents delays gastric emptying, prolongs the time during which nutrients are in contact with the small intestine, increases the intestinal area in contact with the nutrients, decreases postprandial glycemia, and promotes the release of gastrointestinal hormones that promote satiety, such as peptide YY and glucagon-like peptide 1 [5–10]. The manner in which a soluble fiber will modify viscosity depends on the amount, solubility under physiological conditions, and molecular weight and structure of the fiber [11].
The effects of β-glucan on appetite and satiety have been assessed in several studies. Whereas some studies demonstrated a beneficial effect on satiety [9,12–16], others showed no effect [17,18]. Thus, it appears that differences in the properties of β-glucan in each food may influence the physiological response. However, most studies do not provide data on the physicochemical properties of β-glucan used in the studies.
In the present study, the effect of an instant oatmeal breakfast on satiety and food intake was compared with that of an oat-based ready-to-eat breakfast cereal (RTEC). Replacing foods in the diet with foods that enhance satiety may be a means of reducing energy intake; hence, the comparator used was the most widely consumed (based on Information Resources Inc. liquid data, 52 weeks ending March 11, 2012) oat-based RTEC in the United States, even though the products differed in their nutrient composition. The viscosity of the 2 breakfast meals, β-glucan content, molecular weight, and radius of gyration were determined. In a previous study using a 250 kcal serving of old-fashioned oats [19], which is processed differently and has a thicker flake than instant oatmeal, it was shown that subjective measures of satiety increased after eating oatmeal compared to the RTEC. A single serving of instant oatmeal (150 kcal) also increased satiety compared to the RTEC [20]. In the present study, it was hypothesized that compared to the RTEC, consumption of a 250 kcal instant oatmeal breakfast meal would result in greater subjective satiety over 4 hours as well as greater reduction in food intake at the end of 4 hours.
SUBJECTS AND METHODS
Subjects
Forty-eight subjects, 18 years of age or older, were enrolled in a randomized, crossover trial. All subjects participated in an initial screening that involved measurement of body weight, height, waist circumference, vital signs (blood pressure, pulse rate), chemistry-15 panel (glucose, creatinine, potassium, uric acid, albumin, calcium, magnesium, creatine phosphokinase, alanine aminotransferase, alkaline phosphatase, iron, cholesterol [total, high-density lipoprotein, low-density lipoprotein], and triglycerides), complete blood count with differential, and β-HCG pregnancy test–urine (in females of child-bearing potential). To enhance applicability of the hypothesized results, body mass index (BMI) was not a criterion for exclusion but participants were required to be otherwise healthy. Health was further assessed through the administration of a medical screening questionnaire. Female subjects also completed a menstrual cycle questionnaire so that test days would fall within the luteal phase of the menstrual cycle [21]. Exclusion criteria were (1) intake of regular medications other than birth control or hormone replacement therapy; (2) women who were pregnant or nursing; (3) self-reported weight gain or loss of ≥4 kg in the last 3 months; (4) fasting glucose >126 mg/dL; (5) dietary restraint score ≥14, assessed by the Dietary Restraint Scale of the Eating Inventory [22]; and (6) allergy or intolerance to oats or milk.
The study was approved by the Institutional Review Board of the Pennington Biomedical Research Center, Baton Rouge, where the study was conducted, and all procedures were in accordance with its ethical standards. Study records are available at Pennington Biomedical Research Center. Participants provided written informed consent. The trial was registered on ClinicaTrials.gov with registration number NCT01666574.
Study Design
Each participant was tested on 2 days. On one occasion the breakfast meal consisted of Quaker Instant Oatmeal Flakes (PepsiCo Inc., Barrington, IL) and on the other occasion the breakfast meal consisted of the RTEC, Honey Nut Cheerios, served in random, balanced order. The randomization was done using a random number table, in blocks of 2, by the study statistician, and all study staff except the study dietitian who assigned participants to the groups were blinded until the data were analyzed. The breakfasts contained 363 kcal, consisting of 250 kcal of cereal and 113 kcal of lactose-free, fat-free milk. Oatmeal (66.8 g dry weight) was prepared by adding 1.5 cups boiling water (360 g), stirred, allowed to stand for a minute, and served with 307 g of cold milk to drink. The RTEC (63.6 g dry weight) was prepared by adding 307 g of cold milk and served with 360 g of water to drink. The participants had the option of adding 1 g of Splenda and one-half teaspoon of cinnamon to the oatmeal. If the participant added the Splenda and cinnamon to the oatmeal, they were required to add both, in the same amounts to the RTEC.
At the first test breakfast visit, participants arrived at the center after a 10-hour overnight fast (except water). Participants were also required to refrain from alcohol and strenuous exercise for 24 hours prior to the test meal. Before serving the test meal, electronic visual analog scales (VAS) [23,24] were administered. Visual analog scales were scored by the computer on a 0 to 100 unit scale and the score was sent directly to the database. Hunger, fullness, desire to eat, and prospective intake were assessed. The subjects were presented with their first breakfast test and given 20 minutes to eat it. Test meals were supervised to ensure that the entire breakfast was eaten. Visual analog scales were then administered at 30, 60, 120, 180, and 240 minutes following the start of the breakfast meal. Four hours after the start of the breakfast meal, subjects were presented with a lunch meal. Participants made a selection at the screening visit from among turkey, ham, roast beef, or vegetable patty sandwiches as well as a calorie-free or calorie-containing beverage. The same preselected sandwich and beverage were presented to the participants along with potato crisps and cookies on both test days, in quantities greater than they could reasonably consume. Each sandwich, crisps, and cookie presentation ranged in energy content from 2600 to 2800 kcal.
The meals were preweighed and participants were presented with a meal that was in excess of what they could possibly eat. They were told to eat to satisfaction over 20 minutes, after which the remains of the meal were weighed. The food intake at lunch was determined by subtracting the weight of the uneaten food from its original weight. The energy and macronutrient intakes were calculated using the U.S. Department of Agriculture's Food and Nutrition Database for Dietary Studies 4.1 and product information [25]. Subjects were asked an open-ended question (How do you feel?) at each of the time points at which the VAS were completed and after the lunch meal to elicit any adverse events. Subjects returned on another day separated by at least a week to repeat the breakfast and lunch tests.
In vitro Studies
The conduct of the in vitro studies was previously described [20]. Oatmeal was prepared as described in the study design and allowed to rest for one minute. This oatmeal and dry RTEC were first analyzed for their sugar content by high-performance liquid chromatography and total starch content by standard American Association of Cereal Chemists (AACC) procedures [26]. To determine the β-glucan content and physicochemical characteristics, the RTEC and oatmeal were ground to flour. The β-glucan component was extracted from dry ground oat flakes and the RTEC, according to the procedure described by Rimsten et al. [27], and the content was measured using standardized AACC procedures [28]. After extraction, dialysis purification, and drying, the β-glucan was subjected to molecular weight and radius of gyration analysis. For the viscosity measurement, a serving of each breakfast meal was prepared as described in the study design, allowed to rest for one minute, and the viscosity was measured in a process simulating the gastric phase of digestion in vivo.
Statistical Analysis
A mixed model analysis of variance for a crossover trial was performed to analyze the following primary outcomes: total energy intake (kcal), weight of food consumed, and intake from fat, protein, and carbohydrate (g). The area under the curve (AUC) for VAS ratings of hunger, fullness, desire to eat, and prospective food intake was determined. The model included factors with fixed effects (sequence effects or residual treatment effects that carry over from test day 1 to test day 2 [hypothesized to be the same when either oatmeal or the RTEC is consumed on test day 1]), test day main effects, and treatment main effects, in addition to the random effects of subjects within treatment sequence groups.
The secondary outcomes, changes in VAS ratings from time 0 to 30, 60, 120, 180, and 240 minutes following the start of the breakfast meal, were analyzed using a mixed model analysis of variance for a doubly repeated measures crossover trial where the first repeated measures variable was the test day and the second variable was elapsed time since the start of breakfast. The changes from time 0 were summarized as least squares means plotted for each cereal type across the assessment times, and any baseline differences between VAS scores that existed despite randomization were normalized to zero [24]. Thus, differential treatment effects were compared with respect to AUC and per time point. Area under the curve was estimated using the linear trapezoidal rule and calculated in terms of change from baseline to account for the differences at baseline. Results were summarized as least squares means. The differences in molecular weight, radius of gyration, and the AUC for glucose release were compared using t tests. Median viscosities after oral and initial gastric digestion were determined and then compared using t tests. Results were summarized as mean ± standard deviation. The significance level under the null hypothesis was set at α = 0.05 and the levels quoted are 2-sided. All analyses were performed using SAS 9.2 (SAS Institute, Cary, NC).
During the planning phase of the study, sample size was estimated using G*Power, Version 3.1.2 (F. Faul, Universitat Kiel, Germany). The study was sufficiently powered with 46 participants for detecting a minimum difference of 1258 mm × min between cereal types, which is similar to observed differences in AUC (1,213 mm × min) for desire to eat from a similar study that assessed appetite sensations [29].
RESULTS
Forty-eight subjects (29 females and 19 males) were enrolled in the study. One subject who determined she was pregnant was excluded before completion of the study. Six participants were obese (BMI ≥ 30), 13 were overweight (BMI ≥ 25), 26 were of normal weight (BMI 18.5–24.9), and 3 were underweight (BMI < 18.5). Data relating to all enrolled participants were included in the mixed model analysis. There were no adverse events. Descriptive characteristics of the subjects at baseline are summarized in Table 1. A nutrient analysis of the breakfast meals including the β-glucan content of the cereals that was measured in the study is presented in Table 2.
Table 1.
Characteristics at Baseline of 48 Participants Enrolled in the Study Evaluating the Effect of Oat-Based Products on Satiety and Included in the Mixed Model Analysis
| Mean | SD | Range | |
|---|---|---|---|
| Age (years) | 32.5 | 11.1 | 19–63 |
| Height (cm) | 168.9 | 9.1 | 153.3–190.2 |
| Weight (kg) | 71.2 | 16.7 | 46.8–112.8 |
| BMI (kg/m2) | 24.9 | 5.0 | 16.6–38.7 |
| Waist circumference (cm) | 82.0 | 13.9 | 63.1 –124.2 |
BMI = body mass index.
One missing value.
Table 2.
Energy and Nutrient Content of Breakfast Meals Obtained from Product Information, Except β-Glucan Content, Which Was Measured
| Quaker Instant Oatmeal | Honey Nut Cheerios | Lactose-Free, Fat-Free Milk | |
|---|---|---|---|
| Energy (kcal) | 250 | 250 | 112.5 |
| Fat (g) | 5.01 | 3.41 | 0 |
| Protein (g) | 8.35 | 4.54 | 10 |
| Total carbohydrates (g) | 45.09 | 49.97 | 16.25 |
| Total fiber (g) | 6.68 | 4.54 | 0 |
| Soluble fiber (g) | 3.34 | 1.84 | 0 |
| β-Glucan (g) | 2.68 | 1.73 | 0 |
| Sugar (g) | 1.67 | 20.43 | 15 |
| Sodium (mg) | 0 | 363.43 | 156.25 |
| Serving size (g) | 66.8 | 63.6 | 307 |
Quaker Oats (Pepsico Inc., Barrington, IL).
Honey Nut Cheerios (General Mills Inc., Minneapolis, MN).
Hunger and Fullness
The reduction in hunger was significantly greater after consuming oatmeal compared to the RTEC based on the AUC analysis (oatmeal: 10,615 ± 727.15 mm × min versus RTEC: 8,472.10 ± 733.92 mm × min, p = 0.005). Reductions in hunger were larger after consuming oatmeal compared to RTEC at 120 minutes (p = 0.005), 180 minutes (p < 0.001), and 240 minutes (p = 0.012; Fig. 1A). Increase in fullness was significantly greater after consuming oatmeal compared to the RTEC based on the AUC analysis (oatmeal: 11,486 ± 708.67 mm × min versus RTEC: 9,442.54 ± 716 mm × min, p = 0.001). The increase was greater after consuming oatmeal compared to the RTEC at 120 minutes (p = 0.019), 180 minutes (p = 0.002), and 240 minutes (p = 0.049; Fig. 1B).
Fig. 1.
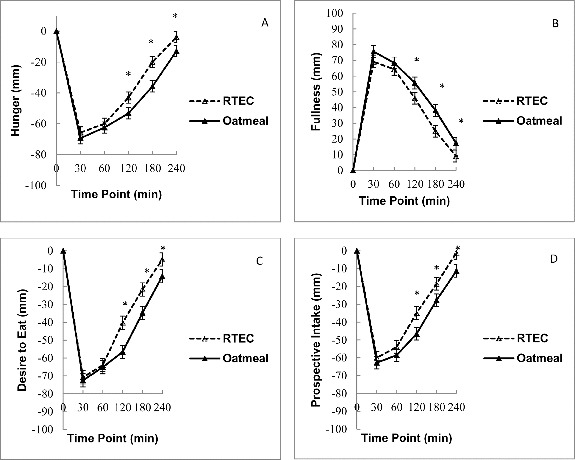
Visual analog scale ratings (n = 48) before and after consumption of oatmeal and an RTEC. Oatmeal increased satiety across all measures: (A) Hunger ratings: *Differences in least squares means (LSM) were significantly different at 120 minutes (p = 0.005), 180 minutes (p < 0.001), and 240 minutes (p = 0.012). (B) Fullness ratings: *Differences in LSM were significant at 120 minutes (p = 0.019), 180 minutes (p = 0.002). and 240 minutes (p = 0.049). (C) Desire to eat ratings: *Differences in LSM were significant at 120 minutes (p < 0.001), 180 minutes (p < 0.001), and 240 minutes (p = 0.007). (D) Prospective food intake ratings: *Differences in LSM were significant at 120 minutes (p < 0.001), 180 minutes (p = 0.004), and 240 minutes (p = 0.002). Values are mean ± standard error.
Desire to Eat and Prospective Intake
Reduction in the desire to eat was significantly greater after consuming oatmeal compared to the RTEC, based on the AUC analysis (oatmeal: 11,010 ± 730.57 mm × min versus RTEC: 8,854.71 ± 735.40 mm × min, p = 0.001). The reduction was greater after consuming oatmeal compared to the RTEC at 120 minutes (p < 0.001), 180 minutes (p < 0.001), and 240 minutes (p = 0.007; Fig. 1C). A similar reduction in prospective food intake was determined after consuming oatmeal compared to the RTEC, based on the AUC analysis (oatmeal: 9,310.79 ± 717.41 mm × min versus RTEC: 7,372.97 ± 723.08, p = 0.006). The reduction was greater after consuming oatmeal compared to the RTEC at 120 minutes (p < 0.001), 180 minutes (p = 0.004), and 240 minutes (p = 0.002; Fig. 1D).
Energy, Food, and Macronutrient Intake
The food intake results were analyzed with and without intakes from the beverages. Results from both the analyses were similar; hence, results of the food intake without the beverages are presented. Energy (kcal) intake at the ad libitum lunch meal was significantly lower (difference = 85 kcal, p = 0.012) following consumption of the oatmeal compared to the RTEC breakfast meal. Fat (p = 0.02) and protein (p < 0.001) intake were significantly lower after eating oatmeal, whereas carbohydrate intake and total weight of food consumed were not significantly different between the 2 conditions (Figs. 2 and 3).
Fig. 2.
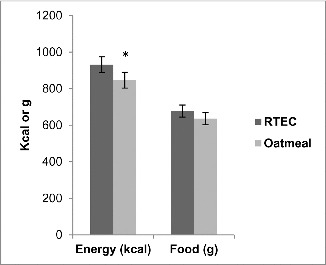
Energy and food intake at lunch meal following consumption of RTEC and oatmeal at breakfast (n = 48). Values are mean ± standard error. Asterisk indicates a significant difference (p = 0.012).
Fig. 3.

Macronutrient intake at lunch meal following consumption of RTEC and oatmeal at breakfast (n = 48). Values are mean ± standard error. Asterisks indicate a significant difference (p < 0.05).
In vitro Analyses
The in vitro kinetics of starch digestion based on glucose release showed no differences between the 2 breakfast products (oatmeal: 99 ± 3 g × min, RTEC: 98 ± 2 g × min, p > 0.05). The molecular weight of the β-glucan in oatmeal was higher than that of the RTEC (oatmeal: 3.89 × 10⁵ ± 8.96 × 10³ Da, RTEC: 2.21 × 10⁵ ± 4.16 × 10³ Da, p < 0.001). Additionally, the β-glucan molecules in oatmeal, once hydrated, formed larger spheres than the β-glucan molecules in the RTEC. The radius of gyration of the β-glucan molecules in oatmeal measured as 50.23 ± 0.76 nm was greater (p < 0.001) than that of the RTEC measured at 36.83 ± 0.42 nm (Figs. 4A and 4B). Oatmeal exhibited a higher viscosity than the RTEC after oral and initial gastric digestion (oatmeal median viscosity: 7,220.5, interquartile range: 2,816.5–12,154.5 cP; RTEC median viscosity 140.0, interquartile range: 131.5–254.0 cP; p = 0.025; Fig. 5).
Fig. 4.

(A) Average molecular weight (Mw) in Daltons (Da) and (B) radius of gyration in nanometers (nm) of the β-glucan content of oatmeal and the RTEC. *Both outcomes were significantly different at p < 0.001. Values are mean ± standard deviation.
Fig. 5.

Median viscosities of oatmeal and RTEC meals after oral and initial gastric digestion observed in the in vitro study. Viscosity values are the median of 3 replicates and expressed in centipoise (cP) ± interquartile range. Asterisk indicates a significant difference (p = 0.03).
DISCUSSION
In this study, the viscosity of 2 oat-based cereals was measured and its effects on satiety were evaluated. Consistent with the hypothesis, a breakfast meal consisting of oatmeal increased fullness and suppressed hunger, desire to eat, and prospective intake, resulting in a reduction in energy intake at lunch, compared to an oat-based RTEC. The content, molecular weight, and radius of gyration of the β-glucan in oatmeal were higher than that of the β-glucan in the RTEC, which most likely contributed to the higher viscosity generated by oatmeal.
In order to form a viscous solution, β-glucan must be sufficiently solubilized. Thus, the difference in the hydration levels of β-glucan in these 2 oat-based cereals may have played an important role. Oat-soluble fiber imbibes water, swells, and gradually dissolves at ambient or higher temperatures [30]. The instant oatmeal used in this study consisted of thin-cut flakes that hydrated easily after adding boiling water. In contrast, β-glucan in the RTEC prepared with cold milk did not hydrate as easily. This may have contributed to its lower viscosity and may explain why the difference in the viscosity of the 2 cereals was greatest when they first entered the stomach as estimated in the in vitro simulation. Although during transit through the gastrointestinal tract, β-glucan in the RTEC might be solubilized and finally hydrated completely, the initial high viscosity of oatmeal seemed to be important for its effects on satiety. The importance of initial viscosity was also demonstrated in a previous study comparing instant oatmeal, old-fashioned oatmeal, and the RTEC. Instant oatmeal displayed greater initial viscosity than old-fashioned oatmeal and produced greater satiety than old-fashioned oatmeal when both were compared with the RTEC [20].
Consistent with research indicating that people tend to consume a constant weight of food [31], in the present study the weight of food consumed at lunch did not differ between the 2 conditions. Although the carbohydrate intake did not differ, the fat and protein intake at the lunch meal were lower after consumption of the oatmeal breakfast compared to the RTEC, which resulted in a reduction in energy intake.
A sensory evaluation of the 2 breakfast meals was not conducted in this study to determine the palatability of the 2 test meals. Palatability is a momentary evaluation liable to change with the experience [32], and it appears to affect satiation (meal termination) more than satiety (prolongation of the interval between meals) [33]. In one study, preloads of beef consommé (10 kcals) varying in their rated palatability reduced appetite compared to a no soup control, but palatability had no effect on appetite ratings. Energy intake at a subsequent meal was not different among the conditions, but the energy content of the soup may have been too low to affect subsequent food intake, indicating that sensory stimulation alone is insufficient to reduce energy intake [34]. In another study, although palatability of a preload test meal affected appetite ratings, there was no effect on subsequent food intake [35].
The nutrient composition of the breakfast cereals was not matched, but the purpose of the study was to determine whether oatmeal would be a good replacement for a ready-to-eat cereal to keep consumers full for a prolonged period. Among the macronutrients, protein-induced satiety in the short term is well documented; however, the effects on food intake are less consistent [36,37]. The difference in the protein contents of the meals or diets evaluated in studies that demonstrated protein-induced satiety ranged from 15% to 25% of the energy content [38–42]. In the present study, the difference in the protein contents of the breakfast meals (4%) was less than the proportion that has been shown to facilitate increased satiety.
The RTEC had higher sugar content than oatmeal. Instant oatmeal is composed of thinly cut flakes, which facilitates quick hydration during cooking and increases the rate of digestion and absorption. It has been shown to have a high glycemic index [43] and the in vitro studies examining the kinetics of starch digestion and glucose release showed that there was no difference between the 2 cereals. However, in vitro studies do not reflect effects such as gastric motility and nutrient interactions. Hence, it is likely that the glycemic indices of the 2 products differed. Nevertheless, studies that investigated the effect of the glycemic response on satiety have shown inconsistent results [44–47]. Thus, based on the results of the in vitro studies, the fiber content of oatmeal, especially the β-glucan component, appears to be the most likely factor influencing appetite, satiety, and subsequent food intake.
Dietary guidelines emphasize consumption of whole grain foods to increase intake of dietary fiber [48]. Both products tested in this study meet that description. However, foods that enhance satiety offer quick gratification. Cues that have a reward associated with them, once learned, trigger motivational wanting to secure these rewards [49]. When that cue is consumption of a food and the reward is a predicted level of satiety, it can have significant effects on the regulation of food intake and energy balance. Unlike other health promoting foods, the time frame to learn the association between consumption of the food and increase in satiety is short and the effects are easily monitored by the consumer, which can greatly facilitate the learned association [50]. Even so, the crux of the issue is whether wanting can be sustained with repeated exposure. Nevertheless, foods that increase satiety provide consumers with appetite control strategies, especially those susceptible to the wiles of an obesogenic environment. Foods that increase satiety also help to cope with mood states provoked by restricted energy intakes, facilitate compliance with healthy eating goals, and promote adherence to diet restrictions.
The main limitation of this study was that the macronutrient composition of the cereals was not matched; hence, it is possible that differences in the protein and sugar content, although insignificant in their individual effects, may have exerted a cumulative effect on satiety. Further, it is possible that prior perceptions about the satiating properties of the cereals may have influenced the results. In vivo measurements of β-glucan viscosity might have provided a better understanding of the satiating effects of oat-based cereals; however, these measurements are difficult to obtain. Though in vitro models may fall short of the dynamic environment of the gastrointestinal tract, the conditions can be standardized and provide a means for understanding physiological events.
It would have been interesting to compare treatments in subgroups, but there must be a sufficient number of participants within the subgroups to support making valid conclusions from such analyses. The crossover design justified investigating the primary outcome in a diverse sample; however, it did not provide adequate power to enable drawing reliable conclusions from subgroup analyses. The strength of this study is that the physiochemical properties of β-glucan were analyzed and appeared to corroborate the satiety response.
CONCLUSIONS
The effects of instant oatmeal on satiety demonstrated in this study are similar to the effects that were observed in previous studies comparing the satiety effects of a thicker oat flake (old-fashioned oatmeal) with the oat-based RTEC [19] and a smaller serving of instant oatmeal to an isocaloric serving of the RTEC [20]. In addition, energy intake was reduced following consumption of instant oatmeal compared to the RTEC. The results of this study add to the evidence provided through a multistep proof of concept that oatmeal suppresses appetite, increases satiety, and reduces subsequent energy intake. The hydration and physicochemical properties of β-glucan are important factors influencing viscosity, a rheological property of soluble fibers that is thought to mediate satiety. Oatmeal could replace foods in the diet and keep consumers full for a prolonged period. Thus, as a satiety-enhancing product, oatmeal appears to be a food that merits investigation.
FUNDING
The trial was funded by Quaker Oats Center of Excellence and PepsiCo R&D Nutrition and supported in part by 1 U54 GM104940 from the National Institute of General Medical Sciences of the National Institutes of Health, which funds the Louisiana Clinical and Translational Science Center. The content is solely the responsibility of the authors and does not necessarily represent the official views of the National Institutes of Health.
CONFLICT OF INTEREST
Marianne O'Shea, Nicolas Bordenave, B. Jan Willem van Klinken, and YiFang Chu are employees of PepsiCo R&D Nutrition. Candida Rebello, Corby Martin, William Johnson, Hongmei Han, and Frank Greenway have no conflict of interest.
REFERENCES
- World Health Organisation Global Health Observatory data. 2014 http://www.who.int/gho/publications/world_health_statistics/2012/en/ [Google Scholar]
- Halford JC, Harrold JA. Satiety-enhancing products for appetite control: science and regulation of functional foods for weight management. Proc Nutr Soc. 2012;71:350–362. doi: 10.1017/S0029665112000134. [DOI] [PubMed] [Google Scholar]
- Tiwari U, Cummins E. Factors influencing beta-glucan levels and molecular weight in cereal-based products. Cereal Chem. 2009;86:290–301. [Google Scholar]
- Wood PJ. Physicochemical properties and physiological effects of the (1–3)(1–4)-beta-d-glucan from oats. Adv Exp Biol Med. 1990;270:119–127. doi: 10.1007/978-1-4684-5784-1_11. [DOI] [PubMed] [Google Scholar]
- Wynne K, Stanley S, McGowan B, Bloom S. Appetite control. J Endocrinol. 2005;184:291–318. doi: 10.1677/joe.1.05866. [DOI] [PubMed] [Google Scholar]
- Wood PJ, Beer MU, Butler G. Evaluation of role of concentration and molecular weight of oat beta-glucan in determining effect of viscosity on plasma glucose and insulin following an oral glucose load. Br J Nutr. 2000;84:19–23. [PubMed] [Google Scholar]
- Panahi S, Ezatagha A, Temelli F, Vasanthan T, Vuksan V. Beta-glucan from two sources of oat concentrates affect postprandial glycemia in relation to the level of viscosity. J Am Coll Nutr. 2007;26:639–644. doi: 10.1080/07315724.2007.10719641. [DOI] [PubMed] [Google Scholar]
- Juvonen KR, Purhonen AK, Salmenkallio-Marttila M, Lahteenmaki L, Laaksonen DE, Herzig KH, Uusitupa MI, Poutanen KS, Karhunen LJ. Viscosity of oat bran–enriched beverages influences gastrointestinal hormonal responses in healthy humans. J Nutr. 2009;139:461–466. doi: 10.3945/jn.108.099945. [DOI] [PubMed] [Google Scholar]
- Beck EJ, Tapsell LC, Batterham MJ, Tosh SM, Huang XF. Increases in peptide Y-Y levels following oat beta-glucan ingestion are dose-dependent in overweight adults. Nutr Res. 2009;29:705–709. doi: 10.1016/j.nutres.2009.09.012. [DOI] [PubMed] [Google Scholar]
- Read N, French S, Cunningham K. The role of the gut in regulating food intake in man. Nutr Rev. 1994;52:1–10. doi: 10.1111/j.1753-4887.1994.tb01347.x. [DOI] [PubMed] [Google Scholar]
- Wood PJ. Cereal beta glucans in diet and health. J Cereal Sci. 2007;46:230–238. [Google Scholar]
- Beck EJ, Tosh SM, Batterham MJ, Tapsell LC, Huang XF. Oat beta-glucan increases postprandial cholecystokinin levels, decreases insulin response and extends subjective satiety in overweight subjects. Mol Nutr Food Res. 2009;53:1343–1351. doi: 10.1002/mnfr.200800343. [DOI] [PubMed] [Google Scholar]
- Vitaglione P, Lumaga RB, Montagnese C, Messia MC, Marconi E, Scalfi L. Satiating effect of a barley beta-glucan-enriched snack. J Am Coll Nutr. 2010;29:113–121. doi: 10.1080/07315724.2010.10719824. [DOI] [PubMed] [Google Scholar]
- Vitaglione P, Lumaga RB, Stanzione A, Scalfi L, Fogliano V. Beta-glucan-enriched bread reduces energy intake and modifies plasma ghrelin and peptide YY concentrations in the short term. Appetite. 2009;53:338–344. doi: 10.1016/j.appet.2009.07.013. [DOI] [PubMed] [Google Scholar]
- Lyly M, Liukkonen KH, Salmenkallio-Marttila M, Karhunen L, Poutanen K, Lahteenmaki L. Fibre in beverages can enhance perceived satiety. Eur J Nutr. 2009;48:251–258. doi: 10.1007/s00394-009-0009-y. [DOI] [PubMed] [Google Scholar]
- Schroeder N, Gallaher DD, Arndt EA, Marquart L. Influence of whole grain barley, whole grain wheat, and refined rice-based foods on short-term satiety and energy intake. Appetite. 2009;53:363–369. doi: 10.1016/j.appet.2009.07.019. [DOI] [PubMed] [Google Scholar]
- Hlebowicz J, Wickenberg J, Fahlstrom R, Bjorgell O, Almer LO, Darwiche G. Effect of commercial breakfast fibre cereals compared with corn flakes on postprandial blood glucose, gastric emptying and satiety in healthy subjects: a randomized blinded crossover trial. Nutr J. 2007;6:22. doi: 10.1186/1475-2891-6-22. [DOI] [PMC free article] [PubMed] [Google Scholar]
- Hlebowicz J, Darwiche G, Bjorgell O, Almer LO. Effect of muesli with 4 g oat beta-glucan on postprandial blood glucose, gastric emptying and satiety in healthy subjects: a randomized crossover trial. J Am Coll Nutr. 2008;27:470–475. doi: 10.1080/07315724.2008.10719727. [DOI] [PubMed] [Google Scholar]
- Rebello CJ, Johnson WD, Martin CK, Xie W, O'shea M, Kurilich A, Bordenave N, Andler S, van Klinken BJ, Chu YF. Acute effect of oatmeal on subjective measures of appetite and satiety compared to a ready-to-eat breakfast cereal: a randomized crossover trial. J Am Coll Nutr. 2013;32:272–279. doi: 10.1080/07315724.2013.816614. [DOI] [PubMed] [Google Scholar]
- Rebello CJ, Chu YF, Johnson WD, Martin CK, Han H, Bordenave N, Shi Y, O'shea M, Greenway FL. The role of meal viscosity and oat beta-glucan characteristics in human appetite control: a randomized crossover trial. Nutr J. 2014;13:49. doi: 10.1186/1475-2891-13-49. [DOI] [PMC free article] [PubMed] [Google Scholar]
- Dye L, Blundell JE. Menstrual cycle and appetite control: implications for weight regulation. Hum Reprod. 1997;12:1142–1151. doi: 10.1093/humrep/12.6.1142. [DOI] [PubMed] [Google Scholar]
- Stunkard AJ, Messick S. The three-factor eating questionnaire to measure dietary restraint, disinhibition and hunger. J Psychosom Res. 1985;29:71–83. doi: 10.1016/0022-3999(85)90010-8. [DOI] [PubMed] [Google Scholar]
- Flint A, Raben A, Blundell JE, Astrup A. Reproducibility, power and validity of visual analogue scales in assessment of appetite sensations in single test meal studies. Int J Obes Relat Metab Disord. 2000;24:38–48. doi: 10.1038/sj.ijo.0801083. [DOI] [PubMed] [Google Scholar]
- Blundell J, de Graaf C, Hulshof T, Jebb S, Livingstone B, Lluch A, Mela D, Salah S, Schuring E, van der Knaap H. Appetite control: methodological aspects of the evaluation of foods. Obes Rev. 2010;11:251–270. doi: 10.1111/j.1467-789X.2010.00714.x. [DOI] [PMC free article] [PubMed] [Google Scholar]
- United States Department of Agriculture Agricultural Research Service, Food and Nutrition Database. Accessed at: http://www.ars.usda.gov/News/docs.htm?docid=12068. [Google Scholar]
- AACC International . Approved Methods of Analysis, 11th Ed. Method 76-13.01. Total starch assay procedure (megazyme amyloglucosidase/alpha-amylase method). Approved November 8, 1995. AACC International, St. Paul, MN, U.S.A. http://methods.aaccnet.org/summaries/76-13-01.aspx. (This is the AACC recommendation for citing) [Google Scholar]
- Rimsten L, Stenberg T, Andersson R, Andersson A, Aman P. Determination of beta-glucan molecular weight using SEC with calcofluor detection in cereal extracts. Cereal Chem. 2003;80:485–490. [Google Scholar]
- AACC International . Approved Methods of Analysis, 11th Ed. Method 32-23.01. Beta-glucan content of barley and oats— rapid enzymatic procedure. Approved November 8, 1995. AACC International, St. Paul, MN, U.S.A. http://methods.aaccnet.org/summaries/32-23-01.aspx. [Google Scholar]
- Pasman WJ, Heimerikx J, Rubingh CM, van den Berg R, O'shea M, Gambelli L, Hendriks HF, Einerhand AW, Scott C, Keizer HG. The effect of Korean pine nut oil on in vitro CCK release, on appetite sensations and on gut hormones in post-menopausal overweight women. Lipids Health Dis. 2008;7:10. doi: 10.1186/1476-511X-7-10. [DOI] [PMC free article] [PubMed] [Google Scholar]
- Malkki Y, Virtanen E. Gastrointestinal effects of oat bran and oat gum: a review. LWT - Food Sci Technol. 2001;34:337–347. [Google Scholar]
- Rolls BJ. The role of energy density in the overconsumption of fat. J Nutr. 2000;130(Suppl):268S–271S. doi: 10.1093/jn/130.2.268S. [DOI] [PubMed] [Google Scholar]
- Mela DJ. Eating for pleasure or just wanting to eat? Reconsidering sensory hedonic responses as a driver of obesity. Appetite. 2006;47:10–17. doi: 10.1016/j.appet.2006.02.006. [DOI] [PubMed] [Google Scholar]
- De Graaf C, De Jong LS, Lambers AC. Palatability affects satiation but not satiety. Physiol Behav. 1999;6:681–688. doi: 10.1016/s0031-9384(98)00335-7. [DOI] [PubMed] [Google Scholar]
- Rogers PJ, Blundell JE. Umami and appetite: effects of monosodium glutamate on hunger and food intake in human subjects. Physiol Behav. 1990;48:801–804. doi: 10.1016/0031-9384(90)90230-2. [DOI] [PubMed] [Google Scholar]
- Warwick ZS, Hall WG, Pappas TN, Schiffman SS. Taste and smell sensations enhance the satiating effect of both a high-carbohydrate and a high-fat meal in humans. Physiol Behav. 1993;53:553–563. doi: 10.1016/0031-9384(93)90153-7. [DOI] [PubMed] [Google Scholar]
- Johnstone AM. Safety and efficacy of high-protein diets for weight loss. Proc Nutr Soc. 2012;71:339–349. doi: 10.1017/S0029665112000122. [DOI] [PubMed] [Google Scholar]
- Halton TL, Hu FB. The effects of high protein diets on thermogenesis, satiety and weight loss: a critical review. J Am Coll Nutr. 2004;23:373–385. doi: 10.1080/07315724.2004.10719381. [DOI] [PubMed] [Google Scholar]
- Smeets AJ, Soenen S, Luscombe-Marsh ND, Ueland O, Westerterp-Plantenga MS. Energy expenditure, satiety, and plasma ghrelin, glucagon-like peptide 1, and peptide tyrosine–tyrosine concentrations following a single high-protein lunch. J Nutr. 2008;138:698–702. doi: 10.1093/jn/138.4.698. [DOI] [PubMed] [Google Scholar]
- Harper A, James A, Flint A, Astrup A. Increased satiety after intake of a chocolate milk drink compared with a carbonated beverage, but no difference in subsequent ad libitum lunch intake. Br J Nutr. 2007;97:579–583. doi: 10.1017/S0007114507339846. [DOI] [PubMed] [Google Scholar]
- Westerterp-Plantenga MS, Rolland V, Wilson SA, Westerterp KR. Satiety related to 24 h diet-induced thermogenesis during high protein/carbohydrate vs high fat diets measured in a respiration chamber. Eur J Clin Nutr. 1999;53:495–502. doi: 10.1038/sj.ejcn.1600782. [DOI] [PubMed] [Google Scholar]
- Lejeune MP, Westerterp KR, Adam TC, Luscombe-Marsh ND, Westerterp-Plantenga MS. Ghrelin and glucagon-like peptide 1 concentrations, 24-h satiety, and energy and substrate metabolism during a high-protein diet and measured in a respiration chamber. Am J Clin Nutr. 2006;83:89–94. doi: 10.1093/ajcn/83.1.89. [DOI] [PubMed] [Google Scholar]
- Leidy HJ, Ortinau LC, Douglas SM, Hoertel HA. Beneficial effects of a higher-protein breakfast on the appetitive, hormonal, and neural signals controlling energy intake regulation in overweight/obese, “breakfast-skipping,” late-adolescent girls. Am J Clin Nutr. 2013;97:677–688. doi: 10.3945/ajcn.112.053116. [DOI] [PMC free article] [PubMed] [Google Scholar]
- Henry CJ, Lightowler HJ, Dodwell LM, Wynne JM. Glycaemic index and glycaemic load values of cereal products and weight-management meals available in the UK. Br J Nutr. 2007;98:147–153. doi: 10.1017/S000711450769179X. [DOI] [PubMed] [Google Scholar]
- Holt SH, Miller JC, Petocz P, Farmakalidis E. A satiety index of common foods. Eur J Clin Nutr. 1995;49:675–690. [PubMed] [Google Scholar]
- Anderson GH, Catherine NL, Woodend DM, Wolever TM. Inverse association between the effect of carbohydrates on blood glucose and subsequent short-term food intake in young men. Am J Clin Nutr. 2002;76:1023–1030. doi: 10.1093/ajcn/76.5.1023. [DOI] [PubMed] [Google Scholar]
- Anderson GH, Woodend D. Effect of glycemic carbohydrates on short-term satiety and food intake. Nutr Rev. 2003;61:S17–S26. doi: 10.1301/nr.2003.may.S17-S26. [DOI] [PubMed] [Google Scholar]
- Liu AG, Most MM, Brashear MM, Johnson WD, Cefalu WT, Greenway FL. Reducing the glycemic index or carbohydrate content of mixed meals reduces postprandial glycemia and insulinemia over the entire day but does not affect satiety. Diabetes Care. 2012;35:1633–1637. doi: 10.2337/dc12-0329. [DOI] [PMC free article] [PubMed] [Google Scholar]
- USDA-DHHS. Dietary Guidelines for Americans. 2010 http://www.health.gov/dietaryguidelines/dga2010/DietaryGuidelines2010.pdf [Google Scholar]
- Berridge KC, Robinson TE, Aldridge JW. Dissecting components of reward: “liking,” “wanting,” and learning. Curr Opin Pharmacol. 2009;9:65–73. doi: 10.1016/j.coph.2008.12.014. [DOI] [PMC free article] [PubMed] [Google Scholar]
- Hetherington MM, Cunningham K, Dye L, Gibson EL, Gregersen NT, Halford JC, Lawton CL, Lluch A, Mela DJ, Van Trijp HC.Potential benefits of satiety to the consumer: scientific considerations Nutr Res Rev 2622–38.2013Received October 23, 2014; accepted March 17, 2015. [DOI] [PubMed] [Google Scholar]