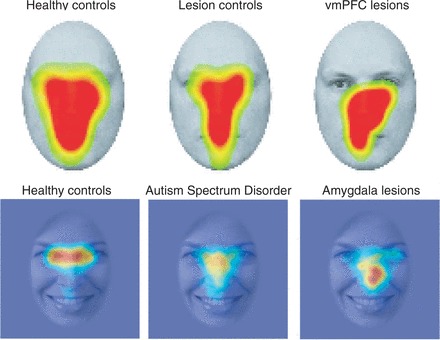
Figure 1.

Failing to look at the eyes. Shown in each image are the regions of a face at which different groups of subjects look, as measured using eye-tracking. The hottest colours (red regions) denote those regions of the face where people look the most. Whereas this corresponds to the eye region of the face in healthy controls (far left), it is abnormal in certain clinical populations, including individuals with lesions of the vmPFC (top right) or amygdala (bottom right) and individuals with autism spectrum disorder (bottom centre) Top row: from Wolf et al. 2014. Bottom row: data from Michael Spezio, Daniel Kennedy, Ralph Adolphs. All images represent spatially smoothed data averaged across multiple fixations, multiple stimuli and multiple subjects within the indicated group.
