

Abstract
The ophthalmic preparation of diclofenac sodium (DC) for relieving ocular inflammation is presently available in the market only as an eye drop solution. Due to its low occular bioavailability, it requires frequent application leading to low patients’ compliance and quality of life. This study was conducted to develop formulations of DC loaded-N-trimethyl chitosan nanoparticles (DC-TMCNs) for ophthalmic use to improve ocular biavailabiltiy of DC. DC-TMCNs varied in formulation compositions were prepared using ionic gelation technique and evaluated for their physicochemical properties, drug release, eye irritation potential, and ophthalmic absorption of diclofenac sodium. N-Trimethyl chitosan (TMC) with a 49.8% degree of quaternization was synthesized and used for DC-TMCNs production. The obtained DC-TMCNs had particle size in a range of 130–190 nm with zeta potential values of +4 to +9 mV and drug entrapment efficiencies of more than 70% depending on the content of TMC and sodium tripolyphosphate (TPP). The optimized DC-TMCNs formulation contained TMC, DC, and TPP at a weight ratio of TMC/DC/TPP = 3:1:1. Their lyophilized product reconstituted with phosphate buffer solution pH 5.5 possessed a drug release pattern that fitted within the zero-order model. The eye irritation tests showed that DC-TMCNs were safe for ophthalmic use. The in vivo ophthalmic drug absorption study performed on rabbits indicated that DC-TMCNs could improve ophthalmic bioavailability of DC. Results of this study suggested that DC-TMCNs had potential for use as an alternative to conventional DC eye drops for ophthalmic inflammation treatment.
KEY WORDS: diclofenac sodium, N-trimethyl chitosan nanoparticles, ophthalmic drug absorption, ophthalmic drug delivery, physicochemical properties
INTRODUCTION
The eye is an organ possessing efficient protective mechanisms against foreign substances, such as blinking reflex, lacrimal fluid dilution, and nasolacrimal duct drainage (1). However, these mechanisms cause poor bioavailability of ophthalmic drugs. Eye drops, for example, are lost from the eye within the first 15–30 s after instillation resulting in <5% ocular bioavailability (2). To date, various ophthalmic formulations have been developed to increase bioavailability of the applied drugs by either increasing the transcorneal permeation (3) or increasing contact time between drugs and the cornea, such as ocular inserts, hydrogels, and nanoparticles (4–6). Nevertheless, the ophthalmic preparations administered by instillation are still the most accepted by patients because of their simple administration technique and dosage accuracy (7). Therefore, the ideal ophthalmic preparations should not only increase ophthalmic bioavailability, but they should also be easy for self-administration. Recently, nanoparticles, i.e., liposomes, solid lipid nanoparticles, poly(lactide-co-glycolide) nanoparticles, and chitosan nanoparticles have been developed as ophthalmic drug delivery systems (1,8–10). It was reported that the optimized nanoparticles formulation could prolong the residence time of the drug on the ocular surface, increase drug absorption, and protect the loaded drug from deterioration induced by ophthalmic environments. In addition, their aqueous dispersion systems can be formulated in liquid dosage form, which is easily instilled into the eye. Consequently, nanoparticles have been considered as promising carriers for ophthalmic drug delivery.
Chitosan is a natural-sourced cationic polymer widely used in ophthalmic drug delivery because of its biocompatibility, mucoadhesive properties, and absorption enhancer properties (8). It is insoluble under a physiological pH but requires an acidic environment, usually with a pH <6.0 to be dissolved (11). This disadvantage sometimes leads to degradation and precipitation of ingredients contained in chitosan-based formulations, especially in weak acid drugs like diclofenac sodium. Recently, N-trimethyl chitosan (TMC), a quaternized derivative of chitosan has been synthesized to improve solubility of chitosan. It is a polyelectrolyte with permanent positive charges and enhanced water solubility in a wide pH range (12). Furthermore, TMC also possesses mucoadhesive properties and absorption enhancer properties by transiently opening the tight junction between epithelial cells without cytotoxicity (13). Consequently, TMC has been used in several applications instead of chitosan, and especially for ophthalmic drug delivery (13–15).
Diclofenac sodium (DC) is one of the nonsteroidal anti-inflammatory drugs approved by the US Food and Drug Administration for ophthalmic use. It can inhibit inflammatory reactions in the eye by suppressing cyclooxygenase enzymes leading to inhibition of prostaglandins synthesis (7). The ophthalmic preparation of DC for relieving ocular inflammation is available in the drug market only as an eye drop (16). It has been extensively used in patients suffering from postoperative ocular inflammation and pain associated with cornea defects after surgery with a frequency of three to six times daily. Therefore, a minimized frequency of administration to one to two times a day will be beneficial for patients. It was found that nanoparticles like solid lipid nanoparticles, poly[Lac(Glc-Leu)] and poly(lactide-co-glycolide) nanoparticles had already been developed for ophthalmic delivery of DC (17,18). However, these nanoparticles could not interact properly with negatively charged mucus covering the ophthalmic tissues via electrostatic interaction due to their negative surface charge. Therefore, modification of their surface charge by using cationic lipid or coating with positively charged polymers was needed to improve their mucoadhesive properties (11,15). On the other hand, these modifications are not required for the nanoparticles naturally possessing positive surface charge such as chitosan nanoparticles or TMC nanoparticles.
Until now, there has been insufficient data from the use of TMC nanoparticles as an ophthalmic delivery system for DC both in vitro and in vivo. Consequently, this study was aimed to formulate and prepare DC loaded-TMC nanoparticles (DC-TMCNs) using ionic gelation method, which is a nontoxic, organic solvent-free, convenient, and controllable process, and investigate their potential for using as an ophthalmic drug delivery system. The investigations included evaluations of their physicochemical properties, eye irritation potential, and in vivo ophthalmic drug absorption and determination of pharmacokinetic parameters of the DC in aqueous humor based on two hypotheses: (1) formulation compositions affect physicochemical properties of DC-TMCNs and (2) DC-TMCNs can improve ocular bioavailability of DC compared to a DC eye drop.
MATERIALS AND METHODS
Materials and Laboratory Animals
Medium molecular weight chitosan (Mw = 400 kDa) with 75–85%deacetylation and viscosity of 200–800 cP at a concentration of 1% w/v in acetic acid, diclofenac sodium, sodium tripolyphosphate, and dialysis tube with a molecular weight cutoff of 12,000 were purchased from Sigma-Aldrich Inc., USA. Diethyl ether (Merck, Germany), methyl iodide (Merck, Germany), N-methyl-2-pyrrolidinone (QRëC, New Zealand), sodium chloride (Unilab, Australia), sodium hydroxide (Merck, Germany), and sodium iodide (Unilab, Australia) were supplied by Samchai Chemical Co., Ltd., Thailand. All other chemicals and solvents used in this study were analytical grade and were obtained from TKK Science Co., Ltd., Thailand.
Male and female New Zealand white rabbits weighing 2–2.5 kg were purchased from the National Laboratory Animal Center, Mahidol University, Thailand. The procedure for use and care of animals for this study was approved by the Ethical Committee of Laboratory Animal Use of Thammasat University (Project code 004/2556). The animal experiment was conducted in full compliance with local, national, ethical, and regulatory principles and local licensing regulations, per the spirit of Association for Assessment and Accreditation of Laboratory Animal Care (AAALAC) International’s expectations for animal care and use/ethics committees.
Synthesis of TMC and Characterization
TMC was synthesized by reductive methylation following the previous study performed by Polnok et al. (19) with some modifications. A mixture of chitosan (2 g), sodium iodide (4.8 g), 20% w/v sodium hydroxide (10 ml), and N-methyl-2-pyrrolidinone (80 ml) was heated in a water bath at 60°C for 20 min. Then, methyl iodide (10 ml) was added to the mixture, and the reaction was carried out for 30 min. Another 10 ml of methyl iodide and 20% w/v sodium hydroxide were added into the mixture. The reaction was allowed to carry out continuously at 60°C for 30 min. The product was collected by precipitation from solution using diethylether (150 ml) three times. It was then pooled and dissolved in 10% w/v of sodium chloride (100 ml) for an ion exchange between iodide ion and chloride ion. After that, the solution was filled in a dialysis tube and dialyzed against purified water for 24 h. The dialyzed product was freeze-dried using an Eyela FD-1 freeze dryer (Tokyo Rikakikai, Japan) at a temperature −25°C and a pressure of 0.3 Torr for 24 h and kept in a vacuum desiccator with light protection.
TMC synthesized in this study was characterized using a 1H-NMR spectrometer (Bruker Advance-300, Switzerland). It was dissolved in D2O and measured at 80°C with water peak suppression. The degree of quaternization (DQ) of TMC was calculated using Eq. (1):
| 1 |
where (CH3)3 and (H) were integral of the trimethyl group peak at 3.1–3.3 ppm and 1H peak at 4.7–5.7 ppm on its 1H-NMR spectrum, respectively (20).
FTIR Spectroscopy Analysis
This analysis was performed to determine the functional groups consisting of TMC and to investigate interactions among the ingredients of DC-TMCNs. Fourier transform infrared (FTIR) spectra of TMC, DC, lyophilized blank TMCNs, and lyophilized DC-TMCNs were individually determined using an FTIR spectrometer (PerkinElmer model Spectrum One, USA). The test samples were ground and mixed with KBr powder at a ratio of 1:100 and pressed into a pellet for this study. Signal averages were obtained for 32 scans at a resolution of 4 cm−1.
Preparation of DC-TMCNs
DC-TMCNs were prepared using ionic gelation technique previously described by Chen et al. (21). Briefly, TMC was dispersed in phosphate buffer solution pH 7.0 (10 ml) and stirred continuously until clear solution was obtained. To prevent aggregation of nanoparticles, DC (0.06 g) and Tween 80 (0.06 g) were dissolved in phosphate buffer solution pH 7.4 (10 ml). Then, the obtained solution was slowly dropped into the TMC solution at a rate of 1 ml/min. The mixtures were continuously stirred using a high-speed stirrer (Ultra-Turrax T8, Germany) at a rate of 10,000 rpm. Subsequently, sodium tripolyphosphate (TPP) dissolved in phosphate buffer solution pH 7.0 (10 ml) was slowly dropped into the mixture at a rate of 1 ml/min. The mixtures were continuously stirred by the high-speed stirrer at a rate of 10,000 rpm for 30 min. The contents of the ingredients, i.e., TMC, DC, and TPP for DC-TMCNs production, are shown in Table I.
Table I.
Formulation Compositions, Particle Size, Polydispersity Index (PI), Zeta Potential, Mole Ratio, Positive/Negative (+/−) Charge Ratio, and Drug Entrapment Efficiency (EE) of DC-TMCNs (n = 3, Mean ± SD)
| Formulation | Content of ingredients (g) | Weight ratio of TMC/DC/TPP | Particle size (nm) | PI | Zeta potential (mV) | Mole ratio of TMC/(DC + TPP) | +/− charge ratio | EE (%) | ||
|---|---|---|---|---|---|---|---|---|---|---|
| TMC | DC | TPP | ||||||||
| 2TMC-1DC-1TPP | 0.12 | 0.06 | 0.06 | 2:1:1 | 131 ± 2 | 0.3 ± 0.1 | 6.3 ± 1.0 | 1.47 | 0.26 | 74.6 ± 0.2 |
| 3TMC-1DC-1TPP | 0.18 | 0.06 | 0.06 | 3:1:1 | 155 ± 1 | 0.2 ± 0.0 | 8.3 ± 0.5 | 2.21 | 0.39 | 93.3 ± 0.1 |
| 3TMC-1DC-2TPP | 0.18 | 0.06 | 0.12 | 3:1:2 | 162 ± 2 | 0.3 ± 0.0 | 4.7 ± 0.1 | 1.51 | 0.21 | 96.2 ± 0.2 |
| 3TMC-1DC-3TPP | 0.18 | 0.06 | 0.18 | 3:1:3 | 169 ± 2 | 0.4 ± 0.0 | 4.3 ± 0.3 | 1.15 | 0.15 | n.d. |
| 4TMC-1DC-1TPP | 0.24 | 0.06 | 0.06 | 4:1:1 | 188 ± 2 | 0.3 ± 0.0 | 8.9 ± 0.5 | 2.94 | 0.52 | 88.3 ± 0.2 |
n.d. not determined
Measurement of Particle Size, Polydispersity Index, and Zeta Potential
Particle size and polydispersity index of DC-TMCNs were analyzed immediately after the production process using a Zetasizer (Malvern Instrument NanoZS, UK). Their zeta potential was measured by electrophoretic light scattering technique using the Zetasizer. These properties were measured in three replicates and reported in a form of mean ± standard deviation (SD). The particle size and zeta potential of each formulation were compared using one-way ANOVA with the least significant difference (LSD) test at a significant level of 0.05.
Morphology Observation
The morphological characteristic of a representative was observed using transmission electron microscopy (TEM). One drop of diluted sample was placed on a copper grid coated with carbon film, then stained with 2% w/v phosphostungstic acid solution and allowed to dry under room temperature. The grid was imaged using a JEM-1220 (Japan) transmission electron microscope.
Moreover, the representative was also observed using the scanning electron microscopy (SEM) to observe particle size distribution before being lyophilized and after its lyophilized product was reconstituted with phosphate buffer solution pH 7.0. The samples were dropped on stubs and let to dry under ambient condition. They were then observed on their gold-coated surfaces using a scanning electron microscope (JSM-5410LV, JEOL, Japan) at 20 kV.
Determination of Drug Entrapment Efficiency of DC-TMCNs
Drug entrapment efficiency of DC-TMCNs was determined using a stirred ultrafiltration cell (Millipore, USA) with an ultrafiltration membrane (molecular weight cutoff, 10,000) for separating the nonentrapped DC from TMCNs (13).
The filtrate from the device was analyzed for free DC content by a UV-visible spectrophotometer (Hitachi U-2000, Japan) at a wavelength of 276 nm and calculated for its content of free drug based on a linear regression equation for a standard curve of DC covering a range of 0.5–50 μg/ml of DC concentration. Drug entrapment efficiency (EE) of DC-TMCNs was calculated using equation (2):
| 2 |
The obtained data were compared using one-way ANOVA with LSD test at a significant level of 0.05.
Freeze Drying and Reconstitution of DC-TMCNs
Tendency of particle aggregation is typically found in most nanoparticles dispersion systems. Therefore, the optimized DC-TMCNs were dried using a freeze-drying technique to avoid such problem. The DC-TMCNs were separated from the medium using the stirred ultrafiltration cell. The retained DC-TMCNs on the ultrafiltration membrane were collected by water elution and dispersed in purified water to make 40 ml. Then, they were frozen and lyophilized by an Eyela FD-1 freeze dryer (Tokyo Rikakikai, Japan) for 24 h at a temperature of −25°C and a pressure of 0.3 Torr without addition of lyoprotectants. The lyophilized products were kept in a vacuum desiccator with light protection. Particle size, polydispersibility index, and zeta potential of lyophilized DC-TMCNs after reconstitution with phosphate buffer solution pH 7.0 were re-evaluated by the Zetasizer.
In Vitro Release Study
The release study of DC from a representative DC-TMCNs was performed using modified Franz diffusion cells in triplicate. To investigate the effect of pH value of reconstituting buffer solutions on a release profile of lyophilized DC-TMCNs, the lyophilized products were separately reconstituted in phosphate buffer solution of pH values 5.5, 6.5, and 7.4. Each DC-TMCNs dispersion was prepared to have equal DC concentration of 0.1% w/v. It was freshly prepared in a few minutes before the release experiment was performed. In this study, the cellulose dialysis membrane (molecular weight cutoff, 12,000) was placed between the donor unit containing 1.0 ml of homogeneous DC-TMCNs dispersion and the receptor compartment filled with 11 ml of phosphate buffer solution pH 7.4 as a receiving media. A precise amount of the receiving solution (6 ml) was withdrawn at 5, 15, 30, 60, 120, 180, 240, 300, 360, 420, and 480 min, respectively. The volume of the receiving solution was maintained by replacing the amount withdrawn with an equal volume of phosphate buffer solution pH 7.4. Throughout the study, the receiving solution was kept well stirred with a magnetic stirrer, and the temperature was maintained at 37 ± 1°C. The withdrawn receiving solution was analyzed for DC content using a UV-visible spectrophotometer (Hitachi U-2000, Japan) at a wavelength of 276 nm.
Eye Irritation Test
In Vitro Eye Irritation Test
The in vitro eye irritation test was performed to evaluate the eye irritation potential of DC-TMCNs before the in vivo study in rabbits. The experiment followed the protocol of short time exposure (STE) test introduced by Takahashi et al. (22). Briefly, SIRC (rabbit corneal cell line) cells supplied by American Type Culture Collection (ATCC, USA) were cultured in Eagles’s MEM (Invitrogen, USA) containing 10% v/v fetal bovine serum (Invitrogen, USA) and 2 mM l-glutamine (Invitrogen, USA) at 37°C in 5% CO2 atmosphere and subcultured every 3–4 days using trypsin–EDTA solution (Invitrogen, USA). The cells were seeded in 24-well plates with a density of 50,000 cells/well and allowed to adhere. When reaching confluence, they were exposed to 200 μl of either 5 or 0.05% of a lyophilized product of the representative DC-TMCNs reconstituted with normal saline, which represented undiluted and 10% diluted test substances, respectively, following the Draize test protocol (22) for 5 min. After exposure, the cells were washed twice with phosphate buffer solution (Invitrogen, USA). Then, 200 μl of 0.5 mg/ml methylthiazolydiphenyl-tetrazolium bromide (MTT) (Sigma-Aldrich, USA) solution in medium was added and incubated for 2 h. The MTT formazan was extracted with 0.04 N HCl–isopropanol for 30 min. Subsequently, the absorbance of the extract was analyzed at 570 nm with a microplate reader (Molecular Devices, USA). Wells containing the medium and the MTT solution without SIRC cells were used as a blank. The 100% cell viability was calculated from the results of wells containing SIRC cells with no exposure of the test dispersion. The assay was performed in six replicates and reported as a mean of percent cell viability (CV) ± SD.
The eye irritation potential from the STE test was scored following the STE irritation score shown in Table II. Then, the scores obtained from the 5% and 0.05% tests were summed up for ranking the eye irritation potential. A ranking of the total scored as 1, 2, and 3 were defined as the minimal, moderate, and severe ocular irritant, respectively. Only the minimal ocular irritants would be accepted for the eye irritation test in rabbits.
Table II.
Scores Obtained from the Short Time Exposure (STE) Test of 3TMC-1DC-1TPP
| Concentration of 3TMC-1DC-1TPP (%) | STE irritation score | %CV of SIRC cells from STE test (n = 6, mean ± SD) | Scores obtained from STE test |
|---|---|---|---|
| 5 | If CV > 70%: scored 0 | 79 ± 3% | 0 |
| If CV ≤ 70%: scored 1 | |||
| 0.05 | If CV > 70%: scored 1 | 101 ± 4% | 1 |
| If CV ≤ 70%: scored 2 | |||
| Total score | 1 |
In Vivo Eye Irritation Test
The in vivo eye irritation test of the selected DC-TMCNs was performed on a group of four New Zealand albino rabbits. Twenty microliters of the lyophilized DC-TMCNs reconstituted with a suitable phosphate buffer solution at a concentration equivalent to 0.1% w/v DC were instilled into the lower conjunctival sac of the rabbit’s right eye. For this study, the left eye without manipulation was used as a control. The eyes exposed to the test product were assessed by the researchers at the following time intervals: 0, 5, 10, 30 min, 1, 6, 12, 24, 48 and 72 h for changes in the cornea, iris, conjunctiva, and secretion as compared to the control. The degree of eye irritation was scored following the modified Draize test (23).
In Vivo Ophthalmic Absorption of DC
Two groups of four New Zealand albino rabbits were treated with either a representative DC-TMCNs dispersion (equivalent to 0.1% w/v of DC) or a commercial DC eye drop by instilling 20 μl of the test products into the lower conjunctiva sac of the rabbit’s right eye. Subsequently, they were anesthetized with isoflurane (Baxter, USA) after instillation for 5, 10, 30, 60, 180, 360, and 720 min to withdraw 200 μl of aqueous humor from the treated eyes using a 27-gauge, 1.3-cm needle attached to 1 ml disposable syringe (24). After taking sample, the rabbits were let to rest at least 7 days before the next experiment would be performed. Each eye was observed for defects by the veterinarian in charge throughout the experiment. Aqueous humor samples were analyzed for DC content using high-performance liquid chromatography (HPLC) technique (25) and calculated for DC content based on a linear regression equation for a standard curve of DC covering a range of 5–10,000 ng/ml of DC concentration. Briefly, an HPLC instrument (Nexera LC-30A Shimadzu, Japan) with a 20-μl auto-injection and a UV detector for UV detection at 280 nm were used in this study. A column (Agilent, USA) for separation consisted of an ultrasphere reversed-phase octyl column (15 cm × 4.5 mm), with particle size of 5 μm. The mobile phase was a mixture of 505 ml acetonitrile containing 0.65 ml triethylamine and 495 ml 1.65% glacial acetic acid with an apparent pH of 4.35. It was pumped at a flow rate of 1.0 ml/min at a temperature of 30°C. The samples for analysis were prepared as follows: 100-μl aliquots of the samples and naproxen, which was used as an internal standard, were mixed with 500 μl acetonitrile contained in a centrifuge tube for protein precipitation and drug extraction. Then, the mixture was centrifuged for removal of protein for 20 min at 60 rpm (Mikro 120 Hettich, Germany). The supernatant was transferred to a new tube and dried under nitrogen gas at room temperature. The residue was dissolved in 50 μl of mobile phase by swirl mixing for 1 min and then injected to the HPLC instrument. Pharmacokinetic parameters of DC in the aqueous humor were calculated using the trapezoidal rule and the method of residuals.
RESULTS AND DISCUSSION
Characterization of TMC
TMC synthesized in this study was characterized using the 1H-NMR and the FTIR spectroscopy. Apart from the information of functional groups contained in the molecular structure, these techniques could provide data for evaluation of effectiveness of the synthesis reaction as well (26). A 1H-NMR spectrum of TMC shown in Fig. 1 is similar to the 1H-NMR spectra of TMC depicted by Mourya and Inamdar (20) and de Britto et al. (27). It contains a peak centered at 2.0 ppm corresponding to hydrogen atoms of the methyl moieties in the acetamido group and a peak centered at 2.85 ppm for N,N-dimethylated sites. The evidence for the appearance of N-trimethyl amino group is seen in 3.25 ppm. The spectrum also shows two signals in the region of 3.35–3.45 ppm attributing to O-methylated sites. The DQ of the TMC calculated using the integral of the trimethyl amino group peak at 3.25 ppm and the integral of the 1H peaks between 4.7 and 5.7 was 49.8%. This pattern suggests that the obtained TMC could yield an average charge of about +0.50 per amino-sugar unit (21). An FTIR spectrum of TMC shown in Fig. 2a indicates the asymmetric angular deformation of C–H bonds of methyl groups (–CH3) at the band of 1475 cm−1, which could not be observed in the spectrum of chitosan (26). However, there is a small band of angular deformation of N–H bond of amino groups occurring at 1546 cm−1 in this spectrum. This result suggests that the amino groups of chitosan used in the TMC synthesis reaction have been partially methylated. This finding is consistent with the moderate value of DQ determined using the 1H-NMR spectrum. Furthermore, the FTIR spectrum shows a peak at a wave number of 1657 cm−1 implying that there are quaternary ammonium groups consisting of TMC, while a band at 3434 cm−1 corresponds to the stretching vibration of O–H and N–H bonds slightly overlapping in the TMC spectrum (20,26).
Fig. 1.
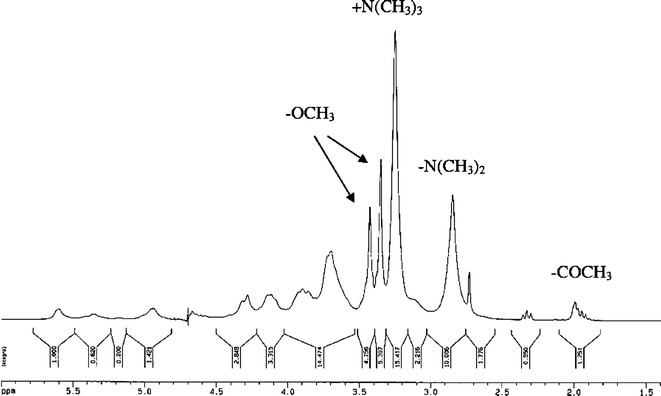
1H-NMR spectrum of TMC dissolved in D2O
Fig. 2.
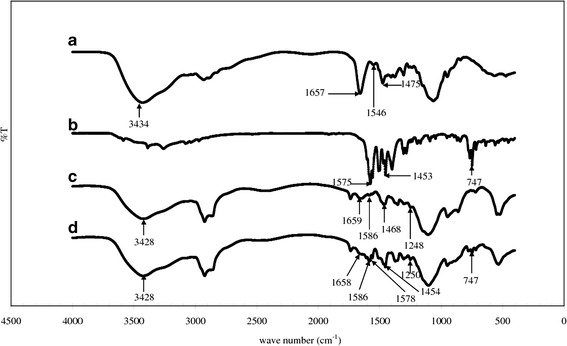
FTIR spectra: a TMC, b DC, c blank TMCNs, and d DC-TMCNs
Preparation and Characterization of DC-TMCNs
The results of particle size and zeta potential measurement shown in Table I indicate that all of the DC-TMCNs prepared in this study possessed particle size in a nanoscale. Their polydispersity indexes were in the range of 0.2–0.4, suggesting that the particle size of each formulation distributed within a narrow range. Nevertheless, the polydispersity index of 3TMC-1DC-3TPP was the greatest because these nanoparticles tended to aggregate during measurement. The zeta potential of DC-TMCNs was positive, but they were relatively low, around +4 to +9 mV. It might be caused by the neutralization of the protonated amino group consisting of TMC molecules by DC and TPP, which are strong anions at the condition of production (27). Moreover, although there were mono- and di-methylated amines existing in the TMC polymers, these methylated amines could not be ionized completely in the environments having pH value more than the pKa value of mono- and di-methylated amines, which is around 6 (21). Therefore, the positive charges of DC-TMCNs prepared in this study were mainly generated by the trimethylated amines group because they were dispersed in a medium possessing a pH value of around 7.0.
Table I shows that mole ratios of TMC/(DC + TPP) calculated based on their content in the formulation and their molar mass are as follows: 232 g/mol for an average amino-sugar unit of TMC, 318 g/mol for DC, and 368 g/mol for TPP (28) were more than 1.00 in all formulations. This suggests that content of TMC, a cationic polyelectrolyte, consisting of all DC-TMCNs formulations was more than content of anions. Because DC-TMCNs formation is occurred by the neutralization between the polyelectrolyte and the anions, positive to negative (+/−) charge ratios in DC-TMCNs were estimated in accordance with the assumptions proposed by Rodrigues et al. (28) for nanoparticle consisting of polyelectrolyte. Firstly, TMC was supposed that it has 0.5 positive charges per mole of an amino-sugar unit; DC was assumed that it has a negative charge per mole and TPP has five negative charges per mole. It was found that the positive/negative charge ratios of DC-TMCNs prepared in this study were lower than 1.00 as shown in Table I. This indicates that all formulations contained more negative charges than positive charges.
However, because Table I shows that the obtained DC-TMCNs had positive values of zeta potential and their physicochemical properties such as particle size, zeta potential, and drug entrapment efficiency were markedly affected by TMC and TPP content, this implies that anions could not neutralize entire positive charges consisting of the polyelectrolyte. Rodrigues et al. (28) suggested that 1:1 +/− charge stoichiometry did not mean complete charge neutralization would occur because neutralization was affected by charge spacings in the intervenient species and steric constraints in polymer chains occurring from their conformation as well. For example, Jintapattankit et al. (29) showed that the nanocomplexes of TMC and insulin with positive/negative charge ratio equaling 1:1 were not neutral, but they possessed zeta potential of +29.2 mV, while the zeta potential of TMC–insulin–TPP nanoparticles with the same positive/negative charge ratio was +12.3 mV. Therefore, the content of TMC, DC, and TPP consisting of DC-TMCNs were important factors for this case.
Effect of TMC Contents on Particle Size and Zeta Potential of DC-TMCNs
To investigate the effect of TMC contents on particle size and zeta potential of DC-TMCNs, particle size and zeta potentials of 2TMC-1DC-1TPP, 3TMC-1DC-1TPP, and 4TMC-1DC-1TPP containing different TMC content levels with a fixed content of DC and TPP were compared (Table I). It was found that 4TMC-1DC-1TPP containing the highest TMC content had larger particle size than others in the same ranking of TMC content (p = 0.000 and 0.000). These obtained results are consistent with the previous reports on chitosan and TMC by De Campos et al. (30), Fan et al. (31), and Subbiah et al. (32) that a greater polyelectrolye polymer content led to a larger particle size of nanoparticles. This could be the fact that the interactions between polyelectrolyte chains such as intermolecular hydrogen bondings, hydrophobic attractions, and electrostatic repulsions of the protonated amino at high polymer concentration would cause the molecules to approach to each other with a limit leading to a limited increment of intermolecular cross-linking. Consequently, larger DC-TMCNs were formed but still within the nanometer range. Table I also shows that 2TMC-1DC-1TPP had lower zeta potential than that of 3TMC-1DC-1TPP and 4TMC-1DC-1TPP (p = 0.000 and 0.000), respectively. This might be that the number of free protonated amine groups in TMC, which did not form cross-linking with TPP in 2TMC-1DC-1TPP, was less than that of 3TMC-1DC-1TPP and 4TMC-1DC-1TPP. Fan et al. (31) also found the same results when increasing the weight ratio of chitosan:TPP.
Effect of TPP Contents on Particle Size and Zeta Potential of DC-TMCNs
Effect of TPP contents were investigated on 3TMC-1DC-1TPP, 3TMC-1DC-2TPP, and 3TMC-1DC-3TPP. The results shown in Table I indicate that 3TMC-1DC-3TPP containing the highest TPP content possessed significantly larger particle size than 3TMC-1DC-2TPP (p = 0.036) and 3TMC-1DC-1TPP (p = 0.000), respectively. This implies that increment of TPP content tended to increase particle size of DC-TMCNs. Chen et al. (21) and de Britto et al. (33) explained that higher TPP content formed cross-links with an abundance of TMC polymer chains, which could then induce coarser nanoparticles. In addition, high TPP content could cause rapid nanoparticles aggregation. This phenomenon could be markedly observed in 3TMC-1DC-3TPP. They exhibited a tendency of particle aggregation in a few minutes after preparation resulting in a high polydispersity index.
Since DC-TMCNs formation is governed by the neutralization between positively charged TMC and negatively charged TPP, less TPP content could neutralize less protonated amine groups in TMC. Consequently, the free protonated amine groups remaining in these nanoparticles were more in number than in the DC-TMCNs containing more TPP leading to higher positive zeta potential. This phenomenon is observed in 3TMC-1DC-1TPP, which contained the lowest TPP content had the highest zeta potential value compared with 3TMC-1DC-2TPP and 3TMC-1DC-3TPP (p = 0.000 and 0.000), respectively, and it is consistent with the previous reports on chitosan by Fan et al. (31) and Antoniou et al. (34)
Morphology of DC-TMCNs
The TEM photograph of 3TMC-1DC-1TPP as a representative depicted in Fig. 3 indicates that they had a solid dense structure. Their morphology observed under the electron microscope shows an almost spherical shape with particle size in the nanometer range.
Fig. 3.
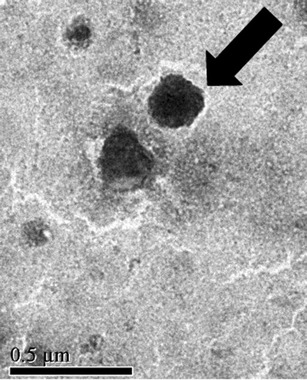
TEM photograph of 3TMC/1DC/1TPP
Determination of Drug Entrapment Efficiency of DC-TMCNs
The results shown in Table I reveal the relatively high drug entrapment efficiency of DC-TMCNs of more than 70%, except for 3TMC-1DC-3TPP, they could not be determined for drug entrapment efficiency because of their rapid precipitation.
The high drug entrapment efficiency of DC-TMCNs could be explained by an efficient ionic interaction between DC, which is a weak acid, with pKa = 4.08 ± 0.04 (35) and TMC. In the production process, DC was separately dissolved in phosphate buffer solution pH 7.4 before it was added to TMC solution pH 7.0. This implies that DC already had a negative charge before reaching the TMC molecules. Consequently, when the DC solution was slowly dropped into the TMC solution, the intense ionic interaction between negatively charged DC and positively charged TMC could occur immediately. After TPP was slowly dropped into the mixture, the complete DC-TMCNs with high drug entrapment efficiency were obtained (36). However, it was found that drug entrapment efficiency of DC-TMCNs prepared in this study was altered with variations in their formulation compositions.
2TMC-1DC-1TPP containing lower TMC content than 3TMC-1DC-1TPP and 4TMC-1DC-1TPP could entrap DC with lower drug entrapment efficiency than that of the others (p = 0.000 and 0.000, respectively). This is the fact that the number of TMC molecules in 2TMC-1DC-1TPP needed for forming an interaction with DC was relatively low. Thus, a large number of the free DC molecules that did not interact with TMC molecules still remained more than that of the formulations containing higher TMC content. Nevertheless, although 4TMC-1DC-1TPP contained more TMC content than 3TMC-1DC-1TPP, their drug entrapment efficiency was lower than 3TMC-1DC-1TPP as well (p = 0.000). Badawi et al. (2) proposed that a high polymer content caused highly viscous nature of the gelation medium. It could impede the drug entrapment and then lead to low drug entrapment efficiency of the nanoparticles.
3TMC-1DC-2TPP containing higher TPP content than 3TMC-1DC-1TPP could entrap DC with a higher drug entrapment efficiency than that of the other (p = 0.000), indicating that the greater the TPP content, the greater the drug entrapment efficiency. It could be explained that the addition of more TPP into the mixed solution of DC and TMC induced formation of DC-TMCNs by including more TMC molecules, which had already interacted with DC as a matrix of the nanoparticles, and so resulted in DC-TMCNS with high drug entrapment efficiency.
The drug entrapment efficiencies of DC-TMCNs shown in Table I indicate that only 3TMC-1DC-1TPP and 3TMC-1DC-2TPP could entrap DC with high drug entrapment efficiency of over 90%. However, because 3TMC-1DC-1TPP possessed a more promising particle size, polydispersity index, and zeta potential higher than those of 3TMC-1DC-2TPP, therefore, 3TMC-1DC-1TPP was selected as a representative for further studies.
Freeze Drying and Reconstitution of DC-TMCNs
Because the zeta potential of 3TMC-1DC-1TPP was relatively low, their dispersion system could not be considered as stable (37). To avoid poor stability, they were dried using freeze-drying method, which is the most common technique ensuring a long-term stability of polymeric nanoparticles (38), without addition of lyoprotectants. It was found that the particle size and the zeta potential of lyophilized 3TMC-1DC-1TPP reconstituted with phosphate buffer solution pH 7.0 were 159 ± 1 nm and +8.5 ± 0.1 mV, respectively. However, the difference between the particle size and the zeta potential of 3TMC-1DC-1TPP before and after freeze drying was not statistically significant at the p values of 0.109 and 0.184, respectively, as analyzed using the paired-sample t test. The SEM photographs shown in Fig. 4a and b confirmed that morphology and size distribution of the sample before being lyophilized and the lyophilized product were not significantly different. This suggests that freeze drying did not significantly alter the particle size and the zeta potential of 3TMC-1DC-1TPP. In addition, Rampino et al. (39) reported that the freeze-drying technique could prevent solubilization and degradation of polymers and drugs that may occur when polymeric nanoparticles were stored as an aqueous suspension. Therefore, the freeze drying could be accepted as a suitable drying technique for stabilization of 3TMC-1DC-1TPP.
Fig. 4.
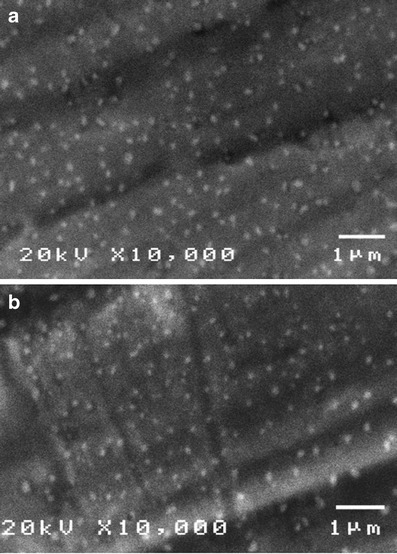
SEM photographs of a 3TMC/1DC/1TPP before being lyophilized, b lyophilized 3TMC/1DC/1TPP reconstituted with phosphate buffer solution pH 7.0
FTIR Spectroscopy Analysis
Figure 2a and b shows the important spectrum bands for characterization of TMC and DC, respectively. The detail of TMC spectrum has been previously described in the section on the characterization of TMC. From Fig. 2b, the important bands of the DC spectrum appear at the wave numbers of 1575, 1453, and 747 cm−1 assigned to N–H bending, CH2CH3 deformation, and C–Cl stretching in DC molecule, respectively (40).
It was found that, after formation of TMC-TPP nanoparticles, a characteristic band of TPP corresponding to a stretching vibration of P=O in TPP appeared at 1248 cm−1 (33) in the spectrum of blank TMCNs as seen in Fig. 2c. Furthermore, there is a shift of the band representing a combination of stretching vibration of N–H and O–H existing in TMC molecule from 3434 to 3428 cm−1. This implies that the hydrogen bonding between polymer chains was enhanced because of the cross-link between TPP and TMC. Figure 2c also shows that the spectrum band of quaternary ammonium groups, –N–H bond in amino groups, and C–H in methyl groups shifted from 1657, 1546, and 1475 cm−1 to 1659, 1586, and 1468 cm−1, respectively, with decrease in band intensity. This confirms that protonated amine groups of TMC molecule were cross-linked with TPP.
It could be observed the important bands of DC spectrum in the spectrum of DC-TMCNs as illustrated in Fig. 2d at 1578, 1454, and 747 cm−1. This implies that DC was loaded into the DC-TMCNs properly. However, trivial shifts of some bands to the wave numbers of 1658, 1578, 1454, and 1250 cm−1 and decrease in band intensity are found in this spectrum. This shift pattern suggests that there were weak interactions between DC and the matrix of TMCNs such as hydrogen bonding, apart from the electrostatic interaction between negatively charged DC and positively charged TMC.
In Vitro Release Study
The in vitro release profiles of 3TMC-1DC-1TPP freshly reconstituted with phosphate buffer solutions of pH 5.5, 6.5, and 7.4 (designated as 3TMC-1DC-1TPP-pH5.5, 3TMC-1DC-1TPP-pH6.5, and 3TMC-1DC-1TPP-pH7.4, respectively) are shown in Fig. 5. It displays a biphasic release pattern including an initial burst release and a slow release phase obeying the Higuchi model for 3TMC-1DC-1TPP-pH6.5 and 3TMC-1DC-1TPP-pH7.4 (r2 = 0.99 and 0.99, respectively) and a constant rate release pattern fitting with the zero-order model for 3TMC-1DC-1TPP-pH5.5 (r2 = 0.99) (41).
Fig. 5.
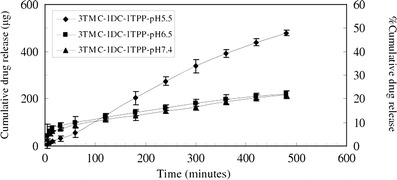
In vitro cumulative release of diclofenac sodium from DC-TMCNs reconstituted with phosphate buffer solution pH 5.5, pH 6.5, and pH 7.4 (n = 3, mean ± SD)
The burst release of 3TMC-1DC-1TPP-pH6.5 and 3TMC-1DC-1TPP-pH7.4 could be explained by the fast dissolution of DC that had been highly loaded in the nanoparticles matrix and locating itself on the nanoparticles surface after exposure to the reconstitution vehicles possessing pH values above the pKa of DC (4.08 ± 0.04) (42). This rapid dissolution led to a larger number of free DC molecules initially moving to the receiving media than that of 3TMC-1DC-1TPP-pH5.5, which had a pH value closer to the pKa of DC. However, because the diffusion of DC locating within the polymeric matrix was impeded by cross-linking networks and interactions with the matrix, the release rate of such DC was lower than the rate at the beginning of the experiment, resulting in a slow release phase of the release profile (18). Although during the first 100 min of the experiment, both 3TMC-1DC-1TPP-pH6.5 and 3TMC-1DC-1TPP-pH7.4 released DC to the receiving media more rapidly as compared to 3TMC-1DC-1TPP-pH5.5 because of the burst release, beyond this time, the latter could release more DC content than the formers. This more rapid release results from the fact that, after the vehicle pH 5.5 penetrated into the nanoparticles matrix thoroughly, it could bring more protonation to amine groups of TMC because its pH value was lower than pKa of mono- and di-methylated amine groups, which are around 6, (21) leading to strong electrostatic repulsions between polymer chains. Consequently, gaps between polymer chains consisting of the matrix were widened, facilitating diffusion of DC to the vehicle before continuously moving to the receiving medium. Nevertheless, since a pH 5.5 is closer to the pKa of DC than the others are, it could not promote drug dissolution in the vehicle properly. Therefore, 3TMC-1DC-1TPP could exhibit as reservoirs for DC and released the drug following the zero-order model.
Because 3TMC-1DC-1TPP-pH5.5 could release more DC content than that of 3TMC-1DC-1TPP-pH6.5 and 3TMC-1DC-1TPP-pH7.4 at a constant rate, the phosphate buffer solution pH 5.5 was considered to be a suitable vehicle for reconstitution of the 3TMC-1DC-1TPP lyophilized product.
Eye Irritation Test
The result of in vitro eye irritation test of 3TMC-1DC-1TPP performed on SIRC cells following the STE test indicates that SIRC cells could tolerate the 5% and the 0.05% of 3TMC-1DC-1TPP dispersed in the medium. The %CV of SIRC cells, after they were exposed to the 5% and the 0.05% 3TMC-1DC-1TPP for 5 min, are shown in Table II and scored for their irritation potency. It was found that the total score of eye irritation potential of 3TMC-1DC-1TPP equaled 1. Accordingly, 3TMC-1DC-1TPP was categorized as a minimal ocular irritant and safe for testing in rabbits.
From the in vivo eye irritation test following the modified Draize test performed on rabbits, no changes could be found in the cornea, iris, conjunctiva, and secretion in the eyes treated with 3TMC-1DC-1TPP-pH5.5 during the test. The total score of eye irritation assessments each time up to 72 h is as shown in Table III, in which they all equaled 0. This outcome suggests that 3TMC-1DC-1TPP-pH5.5 did not cause any irritation in rabbits’ eyes. Consequently, 3TMC-1DC-1TPP-pH5.5 could be accepted as safe for ophthalmic use.
Table III.
Scores Obtained From Eye Irritation Assessment of 3TMC-1DC-1TPP-pH5.5 in Rabbits (n = 4, mean ± SD) (adapted from (23))
| Lesion | Score for each lesion | Score obtained from assessment at each time | |||||||||
|---|---|---|---|---|---|---|---|---|---|---|---|
| 0 min | 5 min | 10 min | 30 min | 1 hr | 6 hr | 12 hr | 24 hr | 48 hr | 72 hr | ||
| A—conjuctival edema (chemosis) | |||||||||||
| No swelling | 0 | 0 ± 0 | 0 ± 0 | 0 ± 0 | 0 ± 0 | 0 ± 0 | 0 ± 0 | 0 ± 0 | 0 ± 0 | 0 ± 0 | 0 ± 0 |
| Any swelling | 1 | ||||||||||
| Prominent swelling along with partial lid eversion | 2 | ||||||||||
| Swelling with half-closed lids | 3 | ||||||||||
| Swelling with totally closed lids | 4 | ||||||||||
| B—redness in conjunctiva | |||||||||||
| Absent | 0 | 0 ± 0 | 0 ± 0 | 0 ± 0 | 0 ± 0 | 0 ± 0 | 0 ± 0 | 0 ± 0 | 0 ± 0 | 0 ± 0 | 0 ± 0 |
| Abnormal conjunctival injections | 1 | ||||||||||
| More diffuse and deeper hyperemia, separate vessels cannot be seen easily | 2 | ||||||||||
| Diffuse and dense hyperemia | 3 | ||||||||||
| C—secretion | |||||||||||
| Absent | 0 | 0 ± 0 | 0 ± 0 | 0 ± 0 | 0 ± 0 | 0 ± 0 | 0 ± 0 | 0 ± 0 | 0 ± 0 | 0 ± 0 | 0 ± 0 |
| Any abnormal secretion | 1 | ||||||||||
| Secretion leading to wet eye lashes closer to lids | 2 | ||||||||||
| Secretion leading to wet lids and whole periorbital area | 3 | ||||||||||
| D—corneal opacity | |||||||||||
| Absent | 0 | 0 ± 0 | 0 ± 0 | 0 ± 0 | 0 ± 0 | 0 ± 0 | 0 ± 0 | 0 ± 0 | 0 ± 0 | 0 ± 0 | 0 ± 0 |
| Scattered or diffused areas—detail of the iris discernible | 1 | ||||||||||
| Easy discernable, transparent areas, detail of the iris slightly darkened | 2 | ||||||||||
| Opalescent areas, no details of the iris discernible, size of the pupil barely discernible | 3 | ||||||||||
| Opaque cornea, iris not discernible | 4 | ||||||||||
| E—iris involvement | |||||||||||
| Absent | 0 | 0 ± 0 | 0 ± 0 | 0 ± 0 | 0 ± 0 | 0 ± 0 | 0 ± 0 | 0 ± 0 | 0 ± 0 | 0 ± 0 | 0 ± 0 |
| Pronounced deep folds, congestion, deep swelling, circumcorneal injection, the iris still reacts to light | 1 | ||||||||||
| No response, hemorrhage, marked destruction | 2 | ||||||||||
| Total score | 0 ± 0 | 0 ± 0 | 0 ± 0 | 0 ± 0 | 0 ± 0 | 0 ± 0 | 0 ± 0 | 0 ± 0 | 0 ± 0 | 0 ± 0 | |
In Vivo Ophthalmic Absorption of DC
The plots of concentration against time of DC in rabbits’ aqueous humor after instillation of 20 μl of either 3TMC-1DC-1TPP-pH5.5 or a commercial DC eye drop into the rabbits’ eyes are exhibited in Fig. 6. The pharmacokinetic parameters of DC in aqueous humor shown in Table IV were calculated using the trapezoidal rule and the method of residuals. In a comparison with the commercial DC eye drop, which used the independent samples t test, the calculated maximum concentration (Cmax) of DC in rabbits’ aqueous humor after instillation of 3TMC-1DC-1TPP-pH5.5 was statistically comparable to that obtained after instillation of the commercial eye drop (p = 0.724). However, 3TMC-1DC-1TPP-pH5.5 showed a 2.4- and 2.5-fold longer time to reach Cmax (Tmax) of DC in the aqueous humor and higher content of DC absorbed into the aqueous humor throughout the experiment, as found from calculating the area under the curve (AUC) (p = 0.000 and 0.000), respectively. This longer time and higher content indicated that 3TMC-1DC-1TPP-pH5.5 could increase DC absorption into the eyes and might possibly be the result of mucoadhesive properties and absorption enhancer properties of TMC (13,20). In addition, the constants of absorption rates (Ka), t1/2 (Ka), the constants of elimination rates (Ke), and t1/2 (Ka) shown in Table IV suggest that DC from 3TMC-1DC-1TPP-pH5.5 was absorbed into the aqueous humor and eliminated from the aqueous humor more slowly than that of the commercial eye drop (p = 0.000, 0.000, 0.000, and 0.000, respectively). Accordingly, 3TMC-1DC-1TPP-pH5.5 could prolong DC release in the rabbits’ eyes during this 12-h experiment. It was found that the concentration of DC in aqueous humor obtained after administration of 3TMC-1DC-1TPP-pH5.5 for 720 min was 48.17 ± 14.00 ng/ml. This value was still within the range of minimum effective concentration (MEC) of DC, 14–158.2 ng/ml, as reported by Nishihata et al. (43). On the other hand, the DC content could not be found in aqueous humor from eyes that had been treated with the commercial DC eye drop at this time point. This suggests that 3TMC-1DC-1TPP-pH5.5 could increase ophthalmic bioavailability of DC and could be used for treatment of ocular inflammation with lower frequency of administration than that of the commercial DC eye drop.
Fig. 6.
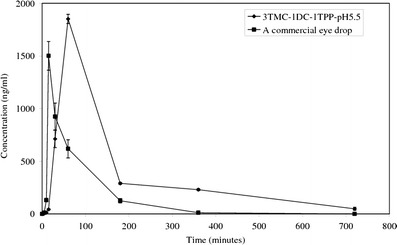
Plot of concentration against time of diclofenac sodium in rabbits’ aqueous humor after instillation of 3TMC-1DC-1TPP-pH5.5 and a commercial eye drop (n = 4, n ± SD)
Table IV.
Pharmacokinetic Parameters of Diclofenac Sodium in Rabbits’ Aqueous Humor (n = 4, mean ± SD)
| Parameters | 3TMC-1 DC-1TPP-pH5.5 | A commercial eye drop |
|---|---|---|
| C max (ng/ml) | 1253.0 ± 80.3 | 1218.2 ± 170.5 |
| T max (min) | 17.5 ± 0.6 | 7.4 ± 0.1 |
| AUC0–720 min (ng × min/ml) | 274,522.4 ± 5003.6 | 111,461.1 ± 12,838.5 |
| K a (l/min) | 0.2 ± 0.0 | 0.5 ± 0.0 |
| K e (l/min) | 4.9 × 10⁻³ ± 5 × 10⁻⁴ | 1.34 × 10⁻² ± 8 × 10⁻⁴ |
| t 1/2 (K a) (min) | 3.1 ± 0.1 | 1.4 ± 0.0 |
| t 1/2 (K e) (min) | 142.3 ± 12.7 | 51.8 ± 3.0 |
CONCLUSIONS
All DC-TMCNs prepared in this study had particle size in a nanometer range and positive values of zeta potential. Their particle size, zeta potential, and drug entrapment efficiency were affected by TMC and TPP content. The results suggested that increase in TMC content led to increasing particle size, zeta potential, and drug entrapment efficiency of DC-TMCNs; however, at too high TMC content, it caused low drug entrapment efficiency. Although increase in TPP content could increase particle size and entrapment efficiency of DC-TMCNs, it caused significantly decrease in zeta potential of these nanoparticles. It was found that the optimized DC-TMCNs formulation was 3TMC-1DC-1TPP containing TMC, DC, and TPP at a weight ratio of TMC/DC/TPP = 3:1:1. They could be stabilized by freeze drying without addition of lyoprotectants. The FTIR analysis indicated interactions between ingredients consisting of DC-TMCNs and suggested that DC was loaded into DC-TMCNs properly. The results of the in vitro release study suggested that pH values of the vehicles for reconstitution of 3TMC-1DC-1TPP affected the DC release pattern from the nanoparticles. However, the phosphate buffer solution pH 5.5 could be considered as a suitable vehicle for reconstitution of the 3TMC-1DC-1TPP lyophilized product yielding 3TMC-1DC-1TPP-pH5.5. The in vitro and in vivo eye irritation test indicated that 3TMC-1DC-1TPP and 3TMC-1DC-1TPP-pH5.5 were safe for ophthalmic use. The in vivo ophthalmic absorption study showed that 3TMC-1DC-1TPP-pH5.5 could increase ophthalmic bioavailability of DC and could be used for treatment of ocular inflammation with lower frequency of administration than that of the commercial DC eye drop. This suggested that 3TMC-1DC-1TPP dispersed in phosphate buffer pH 5.5 could be accepted as an alternative to the DC eye drops for treatment of ophthalmic inflammation.
Acknowledgments
The authors gratefully acknowledge the Office of the Higher Education Commission, The Thailand Research Fund, and Thammasat University for the financial support under The Research Grant for New Scholar: grant no. MRG5580096.
Abbreviations
- ANOVA
analysis of variance
- AUC
area under curve
- Cmax
maximum concentration
- cP
centipoise
- CV
cell viability
- DC
diclofenac sodium
- DC-TMCNs
diclofenac sodium loaded-N-trimethyl chitosan nanoparticles
- DQ
degree of quaternization
- EE
drug entrapment efficiency
- h
hour
- i.e.
id est
- Ka
absorption rate constant
- Ke
elimination rate constant
- min
minute
- LSD
least significant difference
- MTT
methylthiazolydiphenyl-tetrazolium bromide
- Mw
molecular weight
- N
normality
- n.d.
not determined
- PI
polydispersity index
- rpm
round per minute
- STE
short time exposure
- t1/2
half life
- Tmax
time to reach Cmax
- TMC
N-trimethyl chitosan
- TMCNs
N-trimethyl chitosan nanoparticles
- TPP
sodium ripolyphosphate
REFERENCES
- 1.Hao J, Wang X, Bi Y, Teng Y, Wang J, Li F, et al. Fabrication of a composite system combining solid lipid nanoparticles and thermosensitive hydrogel for challenging ophthalmic drug delivery. Colloids Surf B: Biointerf. 2014;114:111–120. doi: 10.1016/j.colsurfb.2013.09.059. [DOI] [PubMed] [Google Scholar]
- 2.Badawi AA, El-Laithy HM, El Qidra RK, El Mofty H, El Dally M. Arch Pharm Res. 2008;31:1040–1049. doi: 10.1007/s12272-001-1266-6. [DOI] [PubMed] [Google Scholar]
- 3.Qi H, Gao X, Zhang L, Wei S, Bi S, Yang Z, et al. In vitro evaluation of enhancing effect of borneol on transcorneal permeation of compounds with different hydrophilicities and molecular sizes. Eur J Pharmacol. 2013;705:20–25. doi: 10.1016/j.ejphar.2013.02.031. [DOI] [PubMed] [Google Scholar]
- 4.Glisoni RJ, García-Fernández MJ, Pino M, Gutkind G, Moglioni AG, Alvarez-Lorenzo C, et al. β-Cyclodextrin hydrogels for the ocular release of antibacterial thiosemicarbazones. Carbohydr Polym. 2013;93:449–457. doi: 10.1016/j.carbpol.2012.12.033. [DOI] [PubMed] [Google Scholar]
- 5.Ameeduzzafar AJ, Bhatnagar A, Kumar N, Ali A. Chitosan nanoparticles amplify the ocular hypotensive effect of cateolol in rabbits. Int J Biol Macromol. 2014;65:479–491. doi: 10.1016/j.ijbiomac.2014.02.002. [DOI] [PubMed] [Google Scholar]
- 6.Mealy JE, Fedorchak MV, Little SR. In vitro characterization of a controlled-release ocular insert for delivery of brimonidine tartrate. Acta Biomater. 2014;10:87–93. doi: 10.1016/j.actbio.2013.09.024. [DOI] [PubMed] [Google Scholar]
- 7.Araújo J, Gonzalez E, Egea MA, Garcia ML, Souto EB. Nanomedicines for ocular NSAIDs: safety on drug delivery. Nanomedicine. 2009;5:394–401. doi: 10.1016/j.nano.2009.02.003. [DOI] [PubMed] [Google Scholar]
- 8.de la Fuente M, Raviña M, Paolicelli P, Sanchez A, Seijo B, Alonso MJ. Chitosan-based nanostructures: a delivery platform for ocular therapeutics. Adv Drug Del Rev. 2010;62:100–117. doi: 10.1016/j.addr.2009.11.026. [DOI] [PubMed] [Google Scholar]
- 9.Gupta H, Aqil M, Khar RK, Ali A, Bhatnagar A, Mittal G. Sparfloxacin-loaded PLGA nanoparticles for sustained ocular drug delivery. Nanomedicine. 2010;6:324–333. doi: 10.1016/j.nano.2009.10.004. [DOI] [PubMed] [Google Scholar]
- 10.Gan L, Wang J, Jiang M, Bartlett H, Ouyang D, Eperjesi F, et al. Recent advances in topical ophthalmic drug delivery with lipid-based nanocarriers. Drug Discov Today. 2013;18:290–297. doi: 10.1016/j.drudis.2012.10.005. [DOI] [PubMed] [Google Scholar]
- 11.Li N, Zhuang C, Wang M, Sun X, Nie S, Pan W. Liposome coated with low molecular weight chitosan and its potential use in ocular drug delivery. Int J Pharm. 2009;379:131–138. doi: 10.1016/j.ijpharm.2009.06.020. [DOI] [PubMed] [Google Scholar]
- 12.de Britto D, Frederico FR, Assis OBG. Optimization of N, N, N-trimethyl chitosan synthesis by factorial design. Polym Int. 2011;60:910–915. doi: 10.1002/pi.3038. [DOI] [Google Scholar]
- 13.Wang S, Zhang J, Jiang T, Zheng L, Wang Z, Zhang J, et al. Protective effect of coenzyme Q10 against oxidative damage in human lens epithelial cells by novel ocular drug carriers. Int J Pharm. 2011;403:219–229. doi: 10.1016/j.ijpharm.2010.10.020. [DOI] [PubMed] [Google Scholar]
- 14.Zambito Y, Zaino C, Colo GD. Effect of N-trimethylchitosan on transcellular and paracellular transcorneal drug transport. Eur J Pharm Biopharm. 2006;64:16–25. doi: 10.1016/j.ejpb.2006.01.004. [DOI] [PubMed] [Google Scholar]
- 15.Zhang J, Wang S. Topical use of coenzyme Q10-loaded liposomes coated with trimethylchitosan: tolerance, precorneal retention and anti-cataract effect. Int J Pharm. 2009;372:66–75. doi: 10.1016/j.ijpharm.2009.01.001. [DOI] [PubMed] [Google Scholar]
- 16.Ahuja M, Sharma SK, Majumdar DK. In vitro corneal permeation of diclofenac from oil drops. Yakugaku Zasshi. 2007;127:1739–1745. doi: 10.1248/yakushi.127.1739. [DOI] [PubMed] [Google Scholar]
- 17.Attama AA, Reichl S, Müller-Goymann CC. Diclofenac sodium delivery to the eye: in vitro evaluation of novel solid lipid nanoparticle formulation using human cornea construct. Int J Pharm. 2008;355:307–313. doi: 10.1016/j.ijpharm.2007.12.007. [DOI] [PubMed] [Google Scholar]
- 18.Agnihotri SM, Vavia PR. Diclofenac-loaded biopolymeric nanosuspensions for ophthalmic application. Nanomedicine. 2009;5:90–95. doi: 10.1016/j.nano.2008.07.003. [DOI] [PubMed] [Google Scholar]
- 19.Polnok A, Borchard G, Verhoef JC, Sarisuta N, Junginger HE. Influence of methylation process on the degree of quaternization of N-trimethyl chitosan chloride. Eur J Pharm Biopharm. 2004;57:77–83. doi: 10.1016/S0939-6411(03)00151-6. [DOI] [PubMed] [Google Scholar]
- 20.Mourya VK, Inamdar NN. Trimethyl chitosan and its applications in drug delivery. J Mater Sci Mater Med. 2009;20:1057–1079. doi: 10.1007/s10856-008-3659-z. [DOI] [PubMed] [Google Scholar]
- 21.Chen F, Zhang Z, Huang Y. Evaluation and modification of N-trimethyl chitosan chloride nanoparticles as protein carriers. Int J Pharm. 2007;336:166–173. doi: 10.1016/j.ijpharm.2006.11.027. [DOI] [PubMed] [Google Scholar]
- 22.Takahashi Y, Koike M, Honda H, Ito Y, Sakaguchi H, Suzuki H, et al. Development of the short time exposure (STE) test: an in vitro eye irritation test using SIRC cells. Toxicol in Vitro. 2008;22:760–770. doi: 10.1016/j.tiv.2007.11.018. [DOI] [PubMed] [Google Scholar]
- 23.Bozdağ S, Gümüş K, Gümüş Ö, Ünlü N. Formulation and in vitro evaluation of cysteamine hydrochloride viscous solutions for the treatment of corneal cystinosis. Eur J Pharm Biopharm. 2008;70:260–269. doi: 10.1016/j.ejpb.2008.04.010. [DOI] [PubMed] [Google Scholar]
- 24.Wu C, Qi H, Chen W, Huang C, Su C, Li W, et al. Preparation and evaluation of a carbopol/HPMC-based in situ gelling ophthalmic system for puerarin. Yakgaku Zasshi. 2007;127183–91. [DOI] [PubMed]
- 25.Riegel M, Ellis PP. High-performance liquid chromatographic assay for antiinflammatory agents diclofenac and flurbiprofen in ocular fluids. J Chromatogr B Biomed Appl. 1994;654:140–145. doi: 10.1016/0378-4347(93)E0448-Y. [DOI] [PubMed] [Google Scholar]
- 26.Martins AF, Pereira AGB, Fajardo AR, Rubira AF, Muniz EC. Characterization of polyelectrolytes complexes based on N, N, N-trimethyl chitosan/heparin prepared at different pH conditions. Carbohydr Polym. 2011;86:1266–1272. doi: 10.1016/j.carbpol.2011.06.024. [DOI] [Google Scholar]
- 27.de Britto D, Campana-Filho SP, Assis OBG. Mechanical properties of N, N, N- trimethylchitosan chloride films. Polímeros. 2005;15:142–145. doi: 10.1590/S0104-14282005000200016. [DOI] [Google Scholar]
- 28.Rodrigues S, Costa AMR, Grenha A. Chitosan/Carrageenan nanoparticles: effect of cross-linking with tripolyphosphate and charge ratios. Carbohydr Polym. 2012;89:282–289. doi: 10.1016/j.carbpol.2012.03.010. [DOI] [PubMed] [Google Scholar]
- 29.Jintapattanakit A, Junyaprasert VB, Mao S, Sitterberg J, Bakowsky U, Kissel T. Peroral delivery of insulin using chitosan derivatives: a comparative study of polyelectrolyte nanocomplexes and nanoparticles. Int J Pharm. 2007;342:240–249. doi: 10.1016/j.ijpharm.2007.05.015. [DOI] [PubMed] [Google Scholar]
- 30.De Campos AM, Sánchez A, Alonso MJ. Chitosan nanoparticles: a new vehicle for the improvement of the delivery of drugs to the ocular surface. Application to cyclosporin A. Int J Pharm. 2001;224:159–168. doi: 10.1016/S0378-5173(01)00760-8. [DOI] [PubMed] [Google Scholar]
- 31.Fan W, Yan W, Xu Z, Ni H. Formation mechanism of monodisperse, low molecular weight chitosan nanoparticles by ionic gelation technique. Colloid Surf B Biointerf. 2012;90:21–27. doi: 10.1016/j.colsurfb.2011.09.042. [DOI] [PubMed] [Google Scholar]
- 32.Subbiah R, Ramalingam P, Ramasundaram S, Kim DY, Park K, Ramasamy MK, et al. N, N, N-Trimethyl chitosan nanoparticles for controlled intranasal delivery of HBV surface antigen. Carbohydr Polym. 2012;89:1289–1297. doi: 10.1016/j.carbpol.2012.04.056. [DOI] [PubMed] [Google Scholar]
- 33.de Britto D, de Moura MR, Aouada FA, Mattoso LHC, Assis OBG. N, N, N-trimethyl chitosan nanoparticles as a vitamin carrier system. Food Hydrocolloid. 2012;27:487–493. doi: 10.1016/j.foodhyd.2011.09.002. [DOI] [Google Scholar]
- 34.Antoniou J, Liu F, Majeed H, Qi J, Yokoyama W, Zhong F. Physicochemical and morphological properties of size-controlled chitosan–tripolyphosphate nanoparticles. Colloids Surf A Physicochem Eng Asp. 2015;465:137–146. doi: 10.1016/j.colsurfa.2014.10.040. [DOI] [Google Scholar]
- 35.Llinàs A, Burley JC, Box KJ, Glen RC, Goodman JM. Diclofenac solubility: independent determination of the intrinsic solubility of three crystal forms. J Med Chem. 2007;50:979–983. doi: 10.1021/jm0612970. [DOI] [PubMed] [Google Scholar]
- 36.Kumar M, Pandey RS, Patra KC, Jain SK, Soni ML, Dangi JS, et al. Evaluation of neuropeptide loaded trimethyl chitosan nanoparticles for nose to brain delivery. Int J Biol Macromol. 2013;61:189–195. doi: 10.1016/j.ijbiomac.2013.06.041. [DOI] [PubMed] [Google Scholar]
- 37.Freitas C, Müller RH. Effect of light and temperature on zeta potential and physical stability in solid lipid nanoparticle (SLN™) dispersions. Int J Pharm. 1998;168:221–229. doi: 10.1016/S0378-5173(98)00092-1. [DOI] [Google Scholar]
- 38.Hansson A, Di Francesco T, Falson F, Rousselle P, Jordan O, Borchard G. Preparation and evaluation of nanoparticles for directed tissue engineering. Int J Pharm. 2012;439:73–80. doi: 10.1016/j.ijpharm.2012.09.053. [DOI] [PubMed] [Google Scholar]
- 39.Rampino A, Borgogna M, Blasi P, Bellich B, Cesàro A. Chitosan nanoparticles: preparation, size evolution and stability. Int J Pharm. 2013;455:219–228. doi: 10.1016/j.ijpharm.2013.07.034. [DOI] [PubMed] [Google Scholar]
- 40.Bharathi A, Srinivas NK, Reddy GR, Veeranjaneyulu M, Sirisha A, Kamala P. Formulation and in vitro evaluation of diclofenac sodium sustained release matrix tablets using melt granulation technique. Int J Res Pharm Biomed Sci. 2011;2:788–808. [Google Scholar]
- 41.Dash S, Murthy PN, Nath L, Chowdhury P. Kinetic modeling on drug release from controlled drug delivery systems. Acta Pol Pharm. 2010;67:217–223. [PubMed] [Google Scholar]
- 42.Huang X, Brazel CS. On the importance and mechanisms of burst release in matrix- controlled drug delivery systems. J Control Release. 2001;73:121–136. doi: 10.1016/S0168-3659(01)00248-6. [DOI] [PubMed] [Google Scholar]
- 43.Nishihata T, Keigami M, Kamada A, Fujimoto T, Kamide S, Tatsumi N. Clinical investigation of sodium diclofenac sustained-release suppositories. Int J Pharm. 1988;42:251–256. doi: 10.1016/0378-5173(88)90182-2. [DOI] [Google Scholar]