

Abstract
Reverse transcriptase-quantitative polymerase chain reaction (RT-qPCR) is a reliable technique for quantifying gene expression across various biological processes, of which requires a set of suited reference genes to normalize the expression data. Coleomegilla maculata (Coleoptera: Coccinellidae), is one of the most extensively used biological control agents in the field to manage arthropod pest species. In this study, expression profiles of 16 housekeeping genes selected from C. maculata were cloned and investigated. The performance of these candidates as endogenous controls under specific experimental conditions was evaluated by dedicated algorithms, including geNorm, Normfinder, BestKeeper, and ΔCt method. In addition, RefFinder, a comprehensive platform integrating all the above-mentioned algorithms, ranked the overall stability of these candidate genes. As a result, various sets of suitable reference genes were recommended specifically for experiments involving different tissues, developmental stages, sex, and C. maculate larvae treated with dietary double stranded RNA. This study represents the critical first step to establish a standardized RT-qPCR protocol for the functional genomics research in a ladybeetle C. maculate. Furthermore, it lays the foundation for conducting ecological risk assessment of RNAi-based gene silencing biotechnologies on non-target organisms; in this case, a key predatory biological control agent.
RNA interference (RNAi) is a sequence-specific post-transcriptional gene silencing process elicited by double stranded RNA (dsRNA) that occurs widely among plants, animals, and microorganisms1. In recent years, the development of RNAi-based transgenic technology, especially in planta RNAi, has seen a rapid growth and offers a novel approach for the sustainable management of insect pests2,3,4,5,6,7,8,9,10. Transgenic crops expressing long dsRNAs to control Coleopteran pests, e.g., western corn rootworm, Diabrotica virgifera virgifera LeConte, is at the forefront of the research and development efforts4. This trait is expected to be the first RNAi-based insect control product to be commercialized, potentially by the end of this decade11,12.
One of the major ecological concerns regarding the RNAi-based gene silencing biotechnologies is their potential adverse impacts on non-target organisms (NTOs)13,14,15,16,17. The surrogate NTOs, including pollinators, soil decomposers, and biological control agents, represent diverse ecological functions. Deleterious effects on NTOs tend to lead to adverse impacts on environment and compromised crop performance.
The pink spotted ladybeetle, Coleomegilla maculata (Coleoptera: Coccinellidae), is one of the most common and widely applied predatory natural enemy against arthropod pests, including aphids, thrips, mites, and lepidopteran and coleopteran larvae and eggs. In addition, C. maculata can feed on plant tissues as well, such as pollen and nectar in maize and other cropping systems18,19,20,21,22. As a surrogate NTO, C. maculata has been used extensively to evaluate the potential non-target risks of Bacillus thuringiensis (Bt) transgenic crops22,23,24,25,26,27,28,29,30,31. Consequently, it is germane to adopt C. maculate as a surrogate species to assess the risks associated with RNAi-based insecticides and transgenic crops. Given the nature of RNAi mechanisms, non-target effects will likely come down to the unexpected modulation of gene expressions in non-target organisms32.
Reverse transcriptase-quantitative polymerase chain reaction (RT-qPCR), a premier molecular biology tool specifically for quantification of gene expression in real-time, is a logic choice to evaluate the potential non-target impacts of this paradigm-shifting biotechnology. Although RT-qPCR is one of the most efficient, reliable, and reproducible techniques to quantify gene expression, multiple factors, including the quality and integrity of RNA samples, efficiency of cDNA synthesis, and PCR efficiency, can significantly influence the normalization processes33,34,35,36,37,38,39,40. Bustin and colleagues38 carried out a mega-analysis of over 1,700 peer-reviewed journal articles published in two time periods (2009–2011 and 2012–2013, respectively) whose authors use RT-qPCR analysis in their research. The surveys assessed the quality of these publication based on four key parameters, including RNA quality, reverse transcription conditions, PCR assay details and data analysis methodology. Although more researchers start to embrace and to adopt the Minimum Information for Publication of Quantitative Real-Time PCR Experiments (MIQE) guidelines, authors concluded that “the integrity of the scientific literature that depends upon qPCR data is severely challenged.” Similarly, authors found that normalization procedures in these surveyed papers were inadequate and insufficient36. The normalization bias caused by a single, non-validated reference gene has been shown to lead to unreliable results and questionable conclusions, especially with tissue samples33,40. To counter this bias, using two to five validated stably expressed reference genes is the most appropriate approach to normalize RT-qPCR data41.
Despite the demonstrated necessity for systematic selection and validation of reference genes in RT-qPCR studies42, insufficient normalization, especially, relying on non-validated (single) reference genes is still a common practice38,39. This is of particular concern as the risks associated with RNAi-based gene silencing biotechnologies on NTOs could be subtle changes in gene expression. Without sufficient selection and validation, unreliable gene expression results can lead to erroneous risk assessments and risk decisions.
The overall goal of this study is to select a suite of reference genes with stable expression under specific experimental conditions in C. maculata. To archive this goal, 16 housekeeping genes extracted from NCBI as well as a C. maculata transcriptome were chosen as the candidate reference genes43, including β-actin (Actin), elongation factor 1 α (EF1A), glyceralde hyde-3-phosphate dehydrogenase (GAPDH), arginine kinase (ArgK), vacuolar-type H+-ATPase subunit A (V-ATPase), 16S ribosomal RNA (16S), 12S ribosomal RNA (12S), 28S ribosomal RNA (28S), 18S ribosomal RNA (18S), ribosomal protein S24 (RPS24), heat shock protein 70 (HSP70), heat shock protein 90 (HSP90), a-tubulin (Tubulin), NADH dehydrogenase subunit 2 (NADH), ribosomal protein S18 (RPS18), and ribosomal protein L4 (RPL4). The stability of these candidate genes was investigated under one abiotic (dietary RNAi) and three biotic (developmental stage, tissue type, and sex) conditions. As a result, different sets of reference genes were recommended accordingly based on each experimental condition.
Results
Performance of RT-qPCR primers
All gene candidates tested were visualized as a single amplicon of expected size on a 2.0% agarose gel (Figure S1). Furthermore, gene-specific amplification was confirmed by a single peak in the melting-curve analysis (Fig. 1). The linear regression equation, correlation coefficient, and PCR efficiency for each standard curve are shown in Table 1. Additionally, the standard curve of each gene is shown in Figure S2.
Figure 1. Melting curves of the 16 candidate reference genes.

Table 1. Primers used for RT-qPCR.
| Gene | Primer sequences (5′–3′) | Length (bp) | Efficiency (%) | R2 | Linear regression equation |
|---|---|---|---|---|---|
| 12S | F:CGATAATCCACGATGGAATTTACTTTAG | 140 | 98.0 | 0.9993 | y=−3.3709x + 13.904 |
| R:CCCTTTCTTCTTTAGTATAAACTTCACC | |||||
| 28S | F:ACCCGAAAGATGGTGAACTATG | 101 | 96.3 | 0.9996 | y=−3.4152x + 10.193 |
| R: CCAGTTCCGACGATCGATTT | |||||
| 18S | F:AAGACGGACAGAAGCGAAAG | 100 | 96.6 | 0.9993 | y=−3.407x + 11.76 |
| R: GGTTAGAACTAGGGCGGTATCT | |||||
| 16S | F:TTGAAGGGCCGCAGTATTT | 99 | 98.5 | 0.9998 | y=−3.3578x + 16.683 |
| R: AAGAAAGTCGTTCCCTCATCAA | |||||
| EF1A | F: TGAATTCGAAGCCGGTATCTC | 92 | 105.3 | 0.9976 | y=−3.2011x + 19.908 |
| R:CGCCGACAATGAGTTGTTTC | |||||
| ArgK | F:TCCGTTCAACCCATGTCTAAC | 96 | 99.6 | 0.9993 | y=−3.3312x + 22.235 |
| R: GTTCCTTTCAGTTCTCCATCCA | |||||
| Actin | F: CTTCCCGACGGTCAAGTTATC | 93 | 101.1 | 0.9998 | y=−3.2973x + 19.264 |
| R: GCAGGATTCCATACCCAAGAA | |||||
| V-ATPase | F: TTGACTGGAGGCGACATTTAC | 113 | 104.4 | 0.9990 | y=−3.2205x + 24.586 |
| R: CTTCCAGGTTCGGCTATGTATG | |||||
| Tubulin | F: GGTATCAATTACCAGCCACCA | 144 | 99.2 | 0.996 | y=−3.3426x + 22.26 |
| R: CTTGGCGTACATGAGATCGAA | |||||
| GAPDH | F: AACTGCTTGGCTCCGTTAG | 107 | 98.6 | 0.9992 | y=−3.3571x + 21.55 |
| R: CCATCGACAGTCTTCTGAGTTG | |||||
| RPS24 | F: CCAGGACAACCATCGGTTAAA | 93 | 101.1 | 0.9993 | y=−3.2979x + 23.553 |
| R: GAAGCCGAATACGAAGCATACA | |||||
| HSP70 | F: GCCGATGCGGAGAAGTATAAAG | 100 | 99.4 | 0.9976 | y=−3.3361x + 22.878 |
| R: CGGCTTGCTTGAGTTGGAATA | |||||
| HSP90 | F: GTTGAATCGCCCTGTTGTATTG | 105 | 96.5 | 0.9982 | y=−3.409x + 24.273 |
| R: GTAACCCATTGTGGACGTATCT | |||||
| NADH | F: TCTGTTAGCTTTCATCCCATTGA | 96 | 99.5 | 0.9983 | y=−3.3345x + 18.3 |
| R: ATTGAGGCTGTAGCTTGTACTAAA | |||||
| RPS18 | F: TACACCTTTGATCGCTGTGAG | 108 | 99.9 | 0.9947 | y=−3.3259x + 23.545 |
| R: GGCTCTGGTCATTCCAGATAAG | |||||
| RPL4 | F: TGGAACCCTTGGAGTTTGTT | 101 | 99.4 | 0.9942 | y=−3.3306x + 27.864 |
| R: TGTACGACCACGCTGTATTG |
Ct values of candidate reference genes
The Ct values of these 16 candidate reference genes under the four experimental conditions ranged between 9 and 35. The average Ct value of the four ribosomal genes, including 18S, 28S, 12S, and 16S, was under 15 cycles. Actin and NADH showed an averaged Ct value of less than 20 cycles. The averaged Ct values of EF1A, GAPDH, Tubulin, RPS24, HSP70, HSP90, RPS18, RPL4, and V-ATPase were between 20 and 25 cycles. 18S and ArgK were the most and the least expressed reference gene, respectively (Fig. 2).
Figure 2. Expression profiles of the 16 candidate reference genes in all four experiments.

Stability of candidate reference genes under specific experimental conditions
Developmental stages included eggs, all four larval instars (collected at the first day of each instar), pupae, adult females and males. Tissues, including head, gut, and carcass, were dissected from C. maculata larvae of various instars. For the sex, gene expression profiles were, respectively, investigated in adult females and males. For dietary RNAi study, four dietary treatments were included; artificial diets containing dsRNAs from dsDVV, dsCM, dsGUS, and H2O (vehicle control). The average expression stability value (M-value) is used by geNorm to determine the best set of reference genes. Recommended M values for geNorm are M < 0.5 for homogeneous samples and M < 1 for heterogenous samples. Here, the lower the M-value coefficient, the higher the stability ranking. Developmental stage analyses showed RPS24 and RPS18 were co-ranked as the most stable genes. Tissue-specific experiments indicated that Tubulin and GAPDH were the most stable genes. Sex results showed that HSP70 and RPS24 were co-ranked as the most stable genes. Dietary RNAi treatment revealed that 12S and 18S were the most stable genes. Table 2 shows the overall ranking of these reference gene candidates from the most-to-least stable ones under each experimental condition.
Table 2. Stability of reference gene expression under four experimental conditions.
| Experimental conditions | Reference gene |
geNorm |
Normfider |
BestKeeper |
ΔCt |
||||
|---|---|---|---|---|---|---|---|---|---|
| Stability | Rank | Stability | Rank | Stability | Rank | Stability | Rank | ||
| Developmental stage | V-ATPase | 0.909 | 3 | 0.399 | 1 | 0.548 | 3 | 1.277 | 1 |
| 12S | 1.060 | 8 | 0.879 | 9 | 0.837 | 9 | 1.400 | 3 | |
| 16S | 1.010 | 6 | 0.756 | 7 | 0.822 | 8 | 1.362 | 2 | |
| 18S | 1.035 | 7 | 0.760 | 8 | 0.892 | 10 | 1.437 | 8 | |
| Actin | 0.980 | 5 | 0.687 | 4 | 0.646 | 5 | 1.431 | 6 | |
| EF1A | 0.943 | 4 | 0.703 | 5 | 0.476 | 1 | 1.409 | 5 | |
| 28S | 1.315 | 14 | 1.621 | 15 | 1.514 | 15 | 1.953 | 15 | |
| GAPDH | 1.143 | 11 | 1.069 | 11 | 1.188 | 14 | 1.556 | 11 | |
| RSP24 | 0.720 | 1 | 0.723 | 6 | 0.606 | 4 | 1.476 | 9 | |
| RPS18 | 0.720 | 1 | 0.666 | 3 | 0.522 | 2 | 1.434 | 7 | |
| NADH | 0.813 | 2 | 0.651 | 2 | 0.665 | 6 | 1.402 | 4 | |
| HSP90 | 1.089 | 9 | 0.993 | 10 | 0.737 | 7 | 1.567 | 12 | |
| HSP70 | 1.177 | 12 | 1.165 | 13 | 0.907 | 11 | 1.621 | 13 | |
| RPL4 | 1.252 | 13 | 1.457 | 14 | 1.045 | 13 | 1.895 | 14 | |
| Tubulin | 1.117 | 10 | 1.071 | 12 | 0.935 | 12 | 1.540 | 10 | |
| ArgK | 1.694 | 15 | 4.263 | 16 | 3.690 | 16 | 4.348 | 16 | |
| Tissue | V-ATPase | 0.816 | 13 | 0.917 | 14 | 1.114 | 14 | 1.457 | 14 |
| 12S | 0.515 | 3 | 0.153 | 1 | 0.491 | 11 | 1.007 | 3 | |
| 16S | 0.600 | 6 | 0.518 | 7 | 0.426 | 6 | 1.077 | 5 | |
| 18S | 0.540 | 4 | 0.321 | 2 | 0.185 | 1 | 1.000 | 1 | |
| Actin | 0.635 | 8 | 0.659 | 11 | 0.515 | 12 | 1.153 | 11 | |
| EF1A | 0.692 | 11 | 0.483 | 6 | 0.456 | 8 | 1.126 | 9 | |
| 28S | 0.618 | 7 | 0.721 | 13 | 0.255 | 2 | 1.147 | 10 | |
| GAPDH | 0.443 | 1 | 0.572 | 8 | 0.361 | 4 | 1.086 | 6 | |
| RSP24 | 0.656 | 9 | 0.705 | 12 | 0.458 | 9 | 1.169 | 12 | |
| RPS18 | 0.674 | 10 | 0.465 | 5 | 0.438 | 7 | 1.110 | 8 | |
| NADH | 0.568 | 5 | 0.580 | 9 | 0.382 | 5 | 1.108 | 7 | |
| HSP90 | 0.743 | 12 | 0.622 | 10 | 0.798 | 13 | 1.254 | 13 | |
| HSP70 | 0.469 | 2 | 0.332 | 3 | 0.461 | 10 | 1.007 | 2 | |
| RPL4 | 1.396 | 15 | 3.331 | 16 | 2.681 | 15 | 3.419 | 16 | |
| Tubulin | 0.443 | 1 | 0.453 | 4 | 0.377 | 3 | 1.049 | 4 | |
| ArgK | 1.107 | 14 | 3.049 | 15 | 2.687 | 16 | 3.154 | 15 | |
| Sex | V-ATPase | 0.990 | 15 | 0.936 | 14 | 0.683 | 14 | 1.162 | 16 |
| 12S | 0.966 | 14 | 0.887 | 12 | 0.736 | 15 | 1.123 | 12 | |
| 16S | 0.718 | 8 | 0.425 | 1 | 0.263 | 1 | 0.849 | 1 | |
| 18S | 0.938 | 13 | 0.947 | 15 | 0.809 | 16 | 1.129 | 13 | |
| Actin | 0.867 | 11 | 0.963 | 16 | 0.647 | 12 | 1.151 | 15 | |
| EF1A | 0.903 | 12 | 0.880 | 11 | 0.612 | 11 | 1.113 | 11 | |
| 28S | 0.824 | 10 | 0.921 | 13 | 0.656 | 13 | 1.130 | 14 | |
| GAPDH | 0.636 | 6 | 0.530 | 3 | 0.391 | 2 | 0.888 | 4 | |
| RSP24 | 0.261 | 1 | 0.607 | 7 | 0.484 | 6 | 0.907 | 6 | |
| RPS18 | 0.564 | 5 | 0.526 | 2 | 0.416 | 3 | 0.872 | 3 | |
| NADH | 0.688 | 7 | 0.603 | 6 | 0.437 | 4 | 0.912 | 7 | |
| HSP90 | 0.485 | 4 | 0.651 | 8 | 0.534 | 8 | 0.926 | 9 | |
| HSP70 | 0.261 | 1 | 0.579 | 4 | 0.503 | 7 | 0.871 | 2 | |
| RPL4 | 0.761 | 9 | 0.724 | 10 | 0.452 | 5 | 1.006 | 10 | |
| Tubulin | 0.403 | 2 | 0.580 | 5 | 0.562 | 9 | 0.890 | 5 | |
| ArgK | 0.440 | 3 | 0.652 | 9 | 0.565 | 10 | 0.913 | 8 | |
| dsRNA | V-ATPase | 0.786 | 15 | 0.900 | 16 | 0.784 | 16 | 1.050 | 16 |
| 12S | 0.293 | 1 | 0.294 | 3 | 0.279 | 4 | 0.634 | 3 | |
| 16S | 0.362 | 2 | 0.257 | 2 | 0.203 | 2 | 0.628 | 2 | |
| 18S | 0.293 | 1 | 0.147 | 1 | 0.187 | 1 | 0.586 | 1 | |
| Actin | 0.407 | 3 | 0.340 | 4 | 0.305 | 6 | 0.649 | 4 | |
| EF1A | 0.492 | 7 | 0.343 | 5 | 0.362 | 8 | 0.666 | 5 | |
| 28S | 0.436 | 4 | 0.428 | 6 | 0.221 | 3 | 0.696 | 6 | |
| GAPDH | 0.559 | 9 | 0.569 | 9 | 0.449 | 9 | 0.794 | 9 | |
| RSP24 | 0.527 | 8 | 0.477 | 7 | 0.480 | 11 | 0.729 | 8 | |
| RPS18 | 0.595 | 10 | 0.681 | 12 | 0.461 | 10 | 0.868 | 12 | |
| NADH | 0.633 | 11 | 0.668 | 11 | 0.547 | 12 | 0.857 | 11 | |
| HSP90 | 0.450 | 5 | 0.504 | 8 | 0.302 | 5 | 0.726 | 7 | |
| HSP70 | 0.705 | 13 | 0.748 | 13 | 0.688 | 14 | 0.925 | 13 | |
| RPL4 | 0.748 | 14 | 0.870 | 15 | 0.713 | 15 | 1.022 | 15 | |
| Tubulin | 0.673 | 12 | 0.786 | 14 | 0.680 | 13 | 0.944 | 14 | |
| ArgK | 0.469 | 6 | 0.616 | 10 | 0.344 | 7 | 0.801 | 10 | |
A low stability value (SV) suggests a more stable gene by NormFinder. For the developmental stage experiment, V-ATPase was the most stable gene. Tissue-specific experiments indicated that 12S was the most stable gene. Sex results showed that 16S was the most stable gene. The 18S gene was considered the most stable for the dietary RNAi treatment experiment. The overall order based on NormFinder from the most-to-least stable reference genes is shown in Table 2.
The stability of a gene is inversely proportional to the standard deviation (SD) value as computed by BestKeeper program. Those with SD > 1 are excluded. EF1A was determined to be the most stable gene for the developmental stage experiment, compared to the tissue experiment where 16S was considered to be the most stable. GAPDH was the most stable gene for both sexes. 18S was shown to be the most stable gene for RNAi experiments. The overall order based on BestKeeper from the most-to-least stable reference genes are also found in Table 2.
The ΔCt method depends on a concept similar to that of geNorm, it also relies on relative pair-wise comparisons. Using raw Ctvalues, the average SD of each gene set is inversely proportional to its stability. Here, V-ATPase was the most stable gene for the developmental stage experiment, while to the tissue-specific experiments, where was shown 18S to be the most stable gene. 16S was the most stable gene for both sexes and 18S was the most stable gene for RNAi experiments. The overall order based on the ΔCt method, from the most-to-least stable reference genes is shown in Table 2.
Comprehensive ranking of reference genes
RefFinder is a comprehensive program that integrates all four above-mentioned software tools to rank the candidate reference genes based on their stability. The following rankings are listed in order of most-to-least stable reference genes. For the developmental stages, the comprehensive ranking was V-ATPase, RPS18, EF1A, NADH, RPS24, Actin, 16S, 12S, 18S, HSP90, Tubulin, GAPDH, HSP70, RPL4, 28S, ArgK (Fig. 3A). The overall ranking for sex was 16S, HSP70, RPS18, GAPDH, RPS24, Tubulin, NADH, HSP90, ArgK, RPL4, EF1A, 28S, 12S, Actin, 18S, V-ATPase (Fig. 3B). Different tissue types produced a ranking of 18S, Tubulin, 12S, HSP70, GAPDH, 16S, NADH, 28S, RPS18, EF1A, RPS24, Actin, HSP90, V-ATPase, ArgK, RPL4 (Fig. 3C). For dietary RNAi treatments, the overall ranking was 18S, 16S, 12S, Actin, 28S, EF1A, HSP90, ArgK, RPS24, GAPDH, RPS18, NADH, Tubulin, HSP70, RPL4, V-ATPase (Fig. 3D).
Figure 3. Stability of candidate reference genes expression under different treatments.

A lower Geomean value indicates more stable expression according to RefFinder.
Quantitative analysis of candidate reference genes based on geNorm
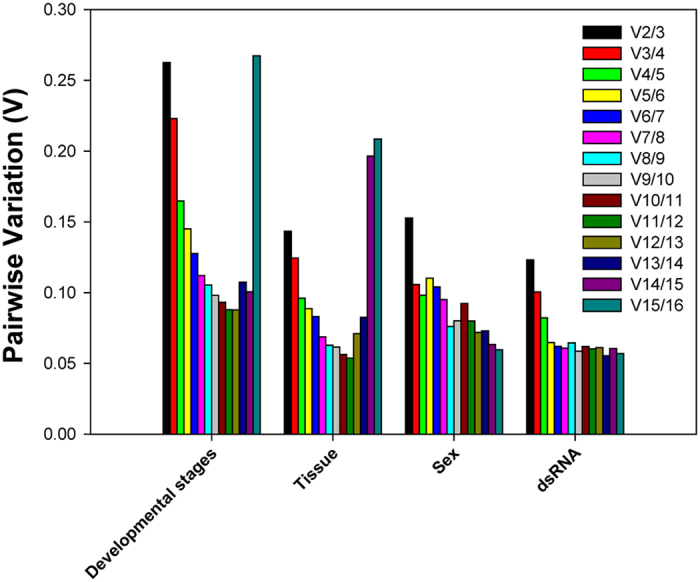
Each experimental condition may demand a different set of requirements for normalizing the RT-qPCR data. The first V-value < 0.15 emerged at V5/6, suggesting that five reference genes are needed for reliable normalization throughout developmental stages (Fig. 4). In regard to tissue-specific and dietary RNAi experiments, the first V-value < 0.15 emerged at V2/3, suggesting that two reference genes are necessary for the reliable normalization (Fig. 4). Based on the same principle, three reference genes are required for the reliable normalization of ladybeetle samples with different sex as the first V-value < 0.15 appeared at V3/4 (Fig. 4).
Figure 4. Pairwise variation (V) values in four experimental groups using geNorm.
Relative gene expression of V-ATPase
The gene expression level of V-ATPase was significantly affected by the treatments when normalized to the two best stable non-rRNA reference genes Actin and EF1A (Fig. 5A) (F3,8 = 8.241, P = 0.008). Specifically, V-ATPase expression was significantly decreased at day 3 under the treatments of dsDVV and dsCM in comparison to the dsGUS and H2O controls (Fig. 5A). However, the gene expression level of V-ATPase was not affected by the treatments when normalized to the two least stable housekeeping genes RPL4 and HSP70 (Fig. 5B) (F3,8 = 1.423, P = 0.306). In this particular experimental setup, V-ATPase served as the target gene instead of the reference gene, which reflected by the highly varied expression levels under the dietary RNAi treatments (Fig. 3D).
Figure 5. Coleomegilla maculata V-ATPase gene expression under dietary RNAi treatments.
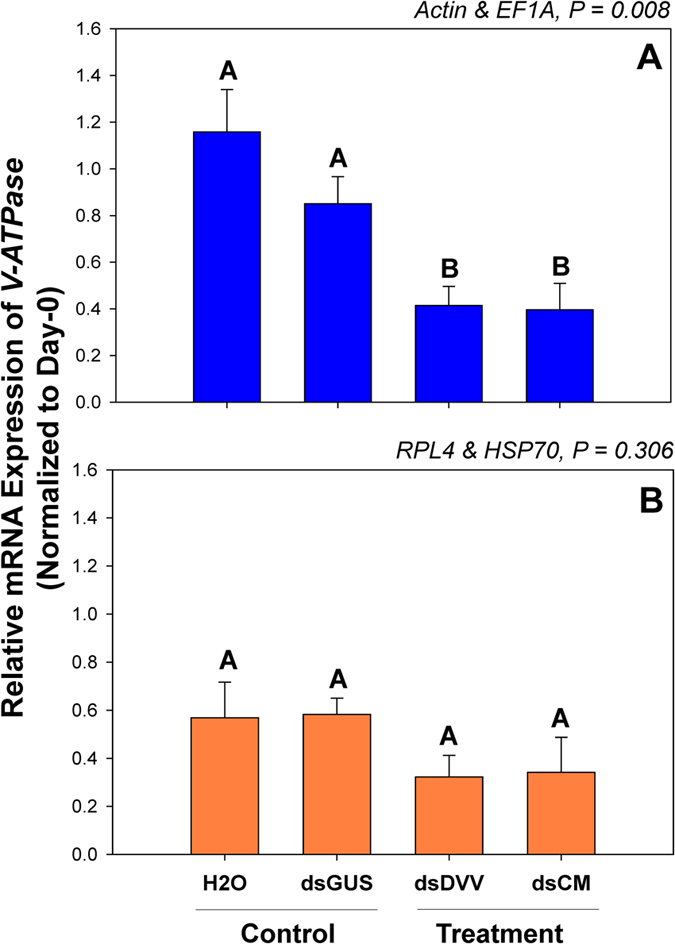
The relative mRNA expression levels of V-ATPase were normalized to the most suited (A, Actin and EF1A) and the least suited (B, RPL4 and HSP70) reference genes, respectively. For dietary RNAi, ladybeetle larvae were exposed to an artificial diet containing 15% sugar solution and 4.0 μg/μl dsRNAs for two days (see Materials and Methods for details). The transcript levels of V-ATPase in newly emerged (0 day) untreated larvae were set to 1, and the relative mRNA expression levels in dsRNA-fed larvae were determined with respect to the controls. Values are means ± SE. Different letters indicate significant differences between the treatments and controls (P < 0.01).
Discussion
Housekeeping genes, constitutively expressed to maintain basic cellular functions, are the conventional choice for a standardized reference33. Interestingly, there is, in fact, no "universal" reference gene that is stably expressed and applicable for all cell and tissue types across various experimental conditions42,44,45,46,47,48,49. Therefore, each candidate reference gene should be evaluated under specific experimental conditions42,50. Our results demonstrate that the suitable reference genes can be different in response to diverse biotic and abiotic conditions (Table 2; Fig. 3). For example, GAPDH was stably expressed in C. maculata under the tissue- and sex-specific conditions; however, its expression was highly variable among different developmental stages. This is consistent with the results from the convergens ladybeetle, Hippodamia convergens (Coleoptera: Coccinellidae), in which the expression of GAPDH was stable among different tissue types and sexes, but variable across different developmental stages45.
RT-qPCR is arguably the most widely used molecular technique for the detection and quantification of nucleic acids50. However, it is far from being a “gold standard” because of the lack of transparency, standardization and technical/quality controls38. Hellemans and Vandesompele39 estimated the average difference in expression level of a gene of interest after normalization with any of two randomly selected non-validated reference genes is between 3 and 6-fold among 10–25% of the case studies. Such inconsistency makes it impossible to draw a conclusion with biological or clinical relevance. To avoid biased normalization, more and more researchers have started to embrace the idea of using multiple reference genes to analyze gene expression42,44,45,46,47,48,49.
Determination of the optimal number of reference genes usually produces a trade-off between accuracy and practicality. In this study, five reference genes are required for reliable normalization under different developmental stages. In comparison, no more than three reference genes were required for reliable normalization under different sex, tissue types and dietary RNAi treatments. Metamorphosis has significant impact on the cellularity and consequently gene expression across the developmental stage. For examples, the Ct value of ArgK was approximately 27 from egg to the fourth instar larva, whereas Ct value increased to 35 at pupa and adult stage. Similarly, GAPDH had a Ct value of 27 at the pupa stage, whereas it decreased to 23 at the other stages.
Our analyses demonstrate a dynamic shift in gene expression levels when normalized to reference genes that were determined to be the most and least suitable for a given treatment conditions (Fig. 5A,B). This provides a case-specific framework for selecting the most appropriate genes for normalization, as comparative measurements can yield varying results when using different gene sets to normalize data. Our study is consistent with previous studies showing how the variability in reference gene expression under variable experimental conditions can statistically affects study outcomes, thus strongly supporting the argument for reference gene validation prior to their use experimentally51,52,53.
The mRNA expression level of V-ATPase in C. maculata was apparently affected by dietary RNAi treatments. V-ATPase expression was significantly reduced under the dsDVV and dsCM treatments compared to the dsGUS and H2O controls (Fig. 5A). Coleomegilla maculate, a conventional NTO surrogate species which serves as a biological control agent, seems to be susceptive to a systemic exposure to the ingested dsRNAs. As a sequence-specific gene silencing tool, RNAi has a great potential in agricultural applications, either through crop improvements or pest/disease controls. Before this novel pest control strategy can be regulated/commercialized, the ecological risk assessment of RNAi-based controls on NTOs must be preceded. Our study provides a road map for future investigations on the risk assessment of RNAi-based gene silencing biotechnologies, including RNAi insecticides and transgenic RNAi crops.
In summary, expression profiles of 16 candidate reference genes under four experimental conditions (different tissue types, developmental stages, sex, and dietary RNAi) were investigated using five readily available algorithms (geNorm, NormFinder, BestKeeper, ΔCt method, and RefFinder). A suite of reference genes were specifically recommended for each experimental condition. These combined results reaffirm that there is no single universal reference gene suitable for all conditions, and reference genes can respond differently to various experimental conditions. This study represents the critical first step to establish a standardized RT-qPCR protocol for the functional genomics research in a ladybeetle C. maculate. Furthermore, it lays the foundation for conducting ecological risk assessment of RNAi-based gene silencing biotechnologies on non-target organisms; in this case, a key predatory biological control agent.
Materials and Methods
Insect cultures
Coleomegilla maculata (Coleoptera: Coccinellidae) was collected from cardoon, Cynara cardunculus, at the University of Kentucky in August, 2014. Larvae and adults were maintained in the laboratory and provisioned with pea aphids, Acyrthosiphon pisum, at 23 ± 0.5 °C, 16L: 8D photoperiod, and 50% relative humidity. Pea aphid clones were kindly provided by Dr. John Obrycki (University of Kentucky), and were maintained at 20–28 °C on fava bean seedlings, Vicia faba (Fabales, Fabaceae), in a greenhouse.
Experimental conditions
Biotic factor
The different developmental stages included eggs, all four larval instars (collected at the first day of each instar), pupae, and adults (including both females and males). Tissue types, including head, gut, and carcass (the remaining tissues that removed head and viscera) were dissected from various instars of C. maculate larvae. For different sex, one adult female and male were collected, respectively.
Abiotic factor
For dietary RNAi treatments, the first-instar larvae were fed with an artificial diet containing 15% sucrose solution mixed with chemically synthesized dsRNAs from 1) a target species, the western corn rootworm, D. v. virgifera (dsDVV, Forward: TAATACGACTCACTATAGGGAGAGCTCTTTTCCCATGTGTAC; Reverse: TAATACGACTCACTATAGGGAGAGCATTTCAGCCAAACG), and 2) a NTO, C. maculate (dsCM, Forward: TAATACGACTCACTATAGGGAGATCTCTTTTCCCATGT; Reverse: TAATACGACTCACTATAGGGAGAGCATCTCGGCCAGAC). The molecular target here is V-ATPase subunit A, an energy related housekeeping gene. Controls included an exogenous control gene β-glucuronidase from bacteria (dsGUS, Forward: TAATACGACTCACTATAGGGAGAGGGCGAACAGTTCCTGATTA; Reverse: TAATACGACTCACTATAGGGAGAGGCACAGCACATCAAAGAGA), and H2O, the vehicle control. At the beginning of the experiment, C. maculata neonates that hatched in less than 24 hours were kept individually in each petri dish. Each neonate was provisioned with a 2 μl droplet containing 1 μl of dsRNA (8 μg/μl) and 1 μl of 30% sucrose solution on a daily basis. For the first two days, a total of 16 μg of dsRNA were provided to each neonate. On day-3, five individuals from each treatment were collected as one sample for the subsequent RT-qPCR analysis.
For the developmental stage, a total of 15 eggs were collected as one biological replicate, while one pupa was collected, individually, as one replicate. For the remaining developmental stages, and all other biotic and abiotic conditions, approximately five individuals were collected for each treatment, and each experiment was repeated three times independently. All collected samples were flash frozen in liquid nitrogen and stored at −80 °C in 1.5 ml centrifuge tubes. All the experiments were conducted at 23 °C with a photoperiod of 16: 8 (L: D).
Total RNA extraction and cDNA synthesis
Total RNA was extracted using TRIzol reagent (Invitrogen, Carlsbad, CA) according to the methods described previously44,45. Total RNA was dissolved in 20–100 μl ddH2O and the concentration was quantified using a NanoDrop 2000c Spectrophotometer. Results for samples are as follows: eggs (367.7 ± 267.7 ng/μl), the first instar larvae (383.3 ± 164.8 ng/μl), the second instar larvae (424.3 ± 111.78 ng/μl), the third instar larvae (1037.0 ± 410.1 ng/μl), the fourth instar larvae (970.1 ± 8.46 ng/μl), pupae (1005.3 ± 51.4 ng/μl), adults (977.3 ± 345.1 ng/μl), heads (225.8 ± 8.6 ng/μl), carcasses (239.9 ± 60.1 ng/μl), and guts (233.7 ± 34.9 ng/μl). The OD260/280 ratio of all samples was between 1.9 and 2.1. First-strand cDNA was synthesized from 0.5 μg of total RNA using the M-MLV reverse transcription kit (Invitrogen, Carlsbad, CA) with a random N primer according to the manufacturer’s recommendations. The cDNA was diluted 10-fold for the subsequent RT-qPCR analyses.
Candidate reference genes and primer design
A total of 16 candidate reference genes commonly used in RT-qPCR analyses in other insect species were selected (Table 1). Primers for 12S, 16S, 18S, and 28S were designed based on the sequences obtained from NCBI. For the other seven genes including Tubulin, RPS24, HSP70, HSP90, NADH, RPS18, and RPL4 genes, primers were designed based on the sequences from a transcriptome of C. maculate43 (Table S2). For the ArgK, EF1A, GAPDH, Actin, and V-ATPase genes, degenerate primers were designed using CODEHOP (http://blocks.fhcrc.org/codehop.html) according to conserved amino acid residues among Coleoptera species (Table S1). Conditions for PCR amplifications have been described previously44,45. PCR products were cloned into the pCR4-TOPO vector (Invitrogen, Carlsbad, CA), and sequenced. After the identities of these reference genes were confirmed (Table S2), primers for the subsequent RT-qPCR analyses were designed online, https://www.idtdna.com/Primerquest/Home/Index.
Reverse transcriptase-quantitative polymerase chain reaction (RT-qPCR)
The information regarding RT-qPCR analysis has been described previously44,45. In brief, gene-specific primers (Table 1) were used in PCR reactions (20 μl) containing 7.0 μl of ddH2O, 10.0 μl of 2×SYBR Green MasterMix (BioRad), 1.0 μl of each specific primer (10 μM), and 1.0 μl of first-strand cDNA template. The reactions were set up in 96-well format Microseal PCR plates (Biorad) in triplicates. Reactions were performed in a MyiQ single Color Real-Time PCR Detection System (BioRad). The standard curve and PCR efficiency of each candidate gene were constructed and calculated according to previously described methods44,45.
Data analysis
One way ANOVA was used to compare the gene expression of V-ATPase under each dietary RNAi treatments. Stability of the 16 candidate reference genes were evaluated by algorithms geNorm33, NormFinder54, BestKeeper55, and the ΔCt method56. Finally, RefFinder (http://www.leonxie.com/referencegene.php), a comprehensive software platform integrating all four algorithms, provided an overall ranking of the stability/suitability of these candidates57. Pairwise variation (V), as determined by geNorm, is an index for determining the optimal number of reference genes for accurate RT-qPCR normalization. A cut-off value for pairwise variation of 0.15 was recommended by Vandesompele et al. (2002)33. Beginning with two genes, this algorithm continuously adds another gene and recalculates the normalization factor ratio. If the added gene does not increase the normalization factor ratio over the proposed 0.15 cut-off value, the starting pair of genes is considered sufficient for normalizing data, otherwise, more genes should be incorporated.
Additional Information
How to cite this article: Yang, C. et al. Selection of reference genes for RT-qPCR analysis in a predatory biological control agent, Coleomegilla maculata (Coleoptera: Coccinellidae). Sci. Rep. 5, 18201; doi: 10.1038/srep18201 (2015).
Supplementary Material
Acknowledgments
Authors are grateful to Drs. Hui Li and Zhen Li for their assistance with the data analysis. This is publication No. 15-08-044 of the Kentucky Agricultural Experiment Station and is published with the approval of the Director. This work is supported by the National Institute of Food and Agriculture, U.S. Department of Agriculture, the Biotechnology Risk Assessment Grant under Award Agreement No.: 3048108827, a Special Fund for Agroscience Research in the Public Interest from China under Award Agreement No.: 201303028, and Hunan Provincial Natural Science Foundation of China No.: 14JJ6058. The granting agencies have no role in the study design, data collection and analysis, decision to publish, or preparation of the manuscript.
Footnotes
Author Contributions X.G.Z., H.P.P. and Y.L. conceived and designed research. H.P.P. and C.X.Y. conducted experiments. X.G.Z. contributed reagents and analytical tools. H.P.P. and C.X.Y. analyzed data. H.P.P., J.E.N., D.Y.Z., Z.H.Z. and X.G.Z. wrote the manuscript.
References
- Kim Y. H., Issa M. S., Cooper A. M. & Zhu K. Y. RNA interference: applications and advances in insect toxicology and insect pest management. Pestic. Biochem. Phys. 120, 109–117 (2015). [DOI] [PubMed] [Google Scholar]
- Pitino M., Coleman A. D., Maffei M. E., Ridout C. J. & Hogenhout S. A. Silencing of aphid genes by dsRNA feeding from plants. PLOS ONE 6, e25709 (2011). [DOI] [PMC free article] [PubMed] [Google Scholar]
- Mao J. J. & Zeng F. R. Plant-mediated RNAi of a gap gene-enhanced tobacco tolerance against the Myzus persicae. Transgenic Res. 23, 145–152 (2014). [DOI] [PubMed] [Google Scholar]
- Baum J. A. et al. Control of coleopteran insect pests through RNA interference. Nat. Biotechnol. 25, 1322–1326 (2007). [DOI] [PubMed] [Google Scholar]
- Mao Y. B. et al. Silencing a cotton bollworm P450 monooxygenase gene by plant-mediated RNAi impairs larval tolerance of gossypol. Nat. Biotechnol. 25, 1307–1313 (2007). [DOI] [PubMed] [Google Scholar]
- Mao Y. B., Tao X. Y., Xue X. Y., Wang L. J. & Chen X. Y. Cotton plants expressing CYP6AE14 double-stranded RNA show enhanced resistance to bollworms. Transgenic Res. 20, 665–673 (2011). [DOI] [PMC free article] [PubMed] [Google Scholar]
- Mao Y. B. et al. Cysteine protease enhances plant-mediated bollworm RNA interference. Plant Mol. Biol. 83, 119–129 (2013). [DOI] [PMC free article] [PubMed] [Google Scholar]
- Kumar P., Pandit S. S. & Baldwin I. T. Tobacco rattle virus vector: a rapid and transient means of silencing Manduca sexta genes by plant mediated RNA interference. PLOS ONE 7, e31347 (2012). [DOI] [PMC free article] [PubMed] [Google Scholar]
- Zha W. J. et al. Knockdown of midgut genes by dsRNA-transgenic plant-mediated RNA interference in the hemipteran insect Nilaparvata lugens. PLOS ONE 6, e20504 (2011). [DOI] [PMC free article] [PubMed] [Google Scholar]
- Xu L. J. et al. Silencing of an aphid carboxylesterase gene by use of plant-mediated RNAi impairs Sitobion avenae tolerance of Phoxim insecticides. Transgenic Res. 23, 389–396 (2014). [DOI] [PubMed] [Google Scholar]
- Kupferschmidt K. A lethal dose of RNA. Science 341, 732–733 (2013). [DOI] [PubMed] [Google Scholar]
- Palli S. R. RNA interference in Colorado potato beetle: steps toward development of dsRNA as a commercial insecticide. Curr. Opin. Insect Sci. 6, 1–8 (2014). [DOI] [PMC free article] [PubMed] [Google Scholar]
- Lundgren J. G. & Duan J. J. RNAi-based insecticidal crops: potential effects on non target species. BioScience 63, 657–665 (2013). [Google Scholar]
- Romeis J. et al. Assessment of risk of insect-resistant transgenic crops to nontarget arthropods. Nat. Biotechnol. 26, 203–208 (2008). [DOI] [PubMed] [Google Scholar]
- Romeis J., Meissle M. & Bigler F. Transgenic crops expressing Bacillus thuringiensis toxins and biological control. Nat. Biotechnol. 24, 63–71 (2006). [DOI] [PubMed] [Google Scholar]
- Roberts A. F., Devos Y., Lemgo G. N. Y & Zhou X. G. Biosafety research for non-target organism risk assessment of RNAi-based GE plants. Front. Plant Sci. 6, 958 (2015). [DOI] [PMC free article] [PubMed] [Google Scholar]
- Xu L. H., Zeng B. S., Norland J. E., Huang Y. P. & Zhou X. G . The coming of RNA-based pest controls. J. Plant Prot. 42, 673–690 (2015). [Google Scholar]
- Conrad M. S. The spotted lady beetle, Coleomegilla maculata (De Geer), as a predator of European corn borer eggs. J. Econ. Entomol. 52, 843–847 (1959). [Google Scholar]
- Groden E., Drummon F. A., Casagrande R. A. & Hayness D. L. Coleomegilla maculata (Coleopera: Coccinellidae): its predation upon the Colorado potato beetle (Coleoptera: Chrysomelidae) and its incidence in potatoes and surrounding crops. J. Econ. Entomol. 83, 1306–1315 (1990). [Google Scholar]
- Andow D. A. & Risch S. J. Predation in diversified agroecosystems: relations between a coccinellid predator Coleomegilla maculata and its food. J. Appl. Ecol. 22, 357–372 (1985). [Google Scholar]
- Seagraves M. P. & Yeargan K. V. Importance of predation by Coleomegilla maculata larvae in the natural control of the corn earworm in sweet corn. Biocontrol Sci. Techn. 19, 1067–1079 (2009). [Google Scholar]
- Lundgren J. G. & Wiedenmann R. N. Coleopteran-specific Cry3Bb toxin from transgenic corn pollen does not affect the fitness of a nontarget species, Coleomegilla maculata DeGeer (Coleoptera: Coccinellidae). Environ. Entomol. 3, 1213–1218 (2002). [Google Scholar]
- Duan J. J. et al. Evaluation of dietary effects of transgenic corn pollen expressing Cry3Bb1 protein on a non-target ladybird beetle, Coleomegilla maculala. Entomol. Exp. Appl. 104, 271–280 (2002). [Google Scholar]
- Tian J. C. et al. Using field-evolved resistance to Cry1F maize in a lepidopteran pest to demonstrate no adverse effects of Cry1F on one of its major predators. Transgenic Res. 21, 1303–1310 (2012). [DOI] [PMC free article] [PubMed] [Google Scholar]
- Li Y. H. et al. Development of a Tier-1 assay for assessing the toxicity of insecticidal substances against Coleomegilla maculata. Environ. Entomol. 40, 496–502 (2011). [Google Scholar]
- Li Y. H., Romeis J., Wang P., Peng Y. F. & Shelton A. M. A comprehensive assessment of the effects of Bt cotton on Coleomegilla maculata demonstrates no detrimental effects by Cry1Ac and Cry2Ab. PLOS ONE 6, e22185 (2011). [DOI] [PMC free article] [PubMed] [Google Scholar]
- Moser S. E., Harwood J. D. & Obrycki J. J. Larval feeding on Bt hybrid and non-Bt corn seedlings by Harmonia axyridis (Coleoptera: Coccinellidae) and Coleomegilla maculata (Coleoptera: Coccinellidae). Environ. Entomol. 37, 525–533 (2008). [DOI] [PubMed] [Google Scholar]
- Head G. P. Abundance of Coleomegilla maculata (Coleóptera: Coccinellidae) in corn rootworm-resistant СгуЗВb1 maize. J. Econ. Entomol, 98, 1992–1998 (2005). [DOI] [PubMed] [Google Scholar]
- Liu X. et al. Effect of Bt broccoli and resistant genotype of Plutella xylostella (Lepidoptera: Plutellidae) on life history and prey acceptance of the predator Coleomegilla maculata (Coleoptera: Coccinellidae). Biol. Control 91, 55–61 (2015). [Google Scholar]
- Pilcher C. D., Obrycki J. J., Rice M. E. & Lewis L. C. Preimaginal development, survival, and field abundance of insect predators on transgenic Bacillus thuringiensis corn. Environ. Entomol. 26, 446–454 (1997). [Google Scholar]
- Lundgren J. G. & Wiedenmann R. N. Nutritional suitability of corn pollen for the predator Coleomegilla maculata (Coleoptera: Coccinellidae). J. Insect Physiol. 50, 567–575 (2004). [DOI] [PubMed] [Google Scholar]
- Berezikov E. Evolution of microRNA diversity and regulation in animals. Nat. Rev. Genet. 12, 846–860 (2011). [DOI] [PubMed] [Google Scholar]
- Vandesompele J. et al. Accurate normalization of real-time quantitative RT-PCR data by geometric averaging of multiple internal control genes. Genome Biol. 3, research0034 (2002). [DOI] [PMC free article] [PubMed] [Google Scholar]
- Sinha D. K. & Smith C. M. Selection of reference genes for expression analysis in Diuraphis noxia (Hemiptera: Aphididae) fed on resistant and susceptible wheat plants. Sci. Rep. 4, 5059 (2014). [DOI] [PMC free article] [PubMed] [Google Scholar]
- Strube C., Buschbaum S., Wolken S. & Schnieder T. Evaluation of reference genes for quantitative real-time PCR to investigate protein disulfide isomerase transcription pattern in the bovine lungworm Dictyocaulus viviparus. Gene 425, 36–43 (2008). [DOI] [PubMed] [Google Scholar]
- Bustin S. A., Benes V., Nolan T. & Pfaffl M. W. Quantitative real-time RT-PCR–a perspective. J. Mol. Endocrinol. 34, 597–601(2005). [DOI] [PubMed] [Google Scholar]
- Guo J., Ling H., Wu Q., Xu L. & Que Y. The choice of reference genes for assessing gene expression in sugarcane under salinity and drought stresses. Sci. Rep. 4, 7042 (2014). [DOI] [PMC free article] [PubMed] [Google Scholar]
- Bustin S. A. et al. The need for transparency and good practices in the qPCR literature. Nat. Methods 10, 1063–1067 (2013). [DOI] [PubMed] [Google Scholar]
- Hellemans J. & Vandesompele J. Selection of reliable reference genes for RT-qPCR analysis. In Quantitative Real-Time PCR (pp. 19–26). Springer: New York, (2014). [DOI] [PubMed] [Google Scholar]
- Huggett J., Dheda K., Bustin S. & Zumla A. Real-time RT-PCR normalisation; strategies and considerations. Genes Immun. 6, 279–284 (2005). [DOI] [PubMed] [Google Scholar]
- Xiao X. et al. Validation of suitable reference genes for gene expression analysis in the halophyte Salicornia europaea by real-time quantitative PCR. Front. Plant Sci. 5, 788 (2015). [DOI] [PMC free article] [PubMed] [Google Scholar]
- Liang P., Guo Y. J., Zhou X. G. & Gao X. W. Expression profiling in Bemisia tabaci under insecticide treatment: indicating the necessity for custom reference gene selection. PLOS ONE 9, e87514 (2014). [DOI] [PMC free article] [PubMed] [Google Scholar]
- Dheilly N. M. et al. Who is the puppet master? Replication of a parasitic wasp-associated virus correlates with host behaviour manipulation. P. Roy. Soc. Lond B: Bio. 282, 20142773 (2015). [DOI] [PMC free article] [PubMed] [Google Scholar]
- Yang C. X., Pan H. P., Liu Y. & Zhou X. G. Stably expressed housekeeping genes across developmental stages in the two-spotted spider mite, Tetranychus urticae. PLOS ONE 10, e0120833 (2015). [DOI] [PMC free article] [PubMed] [Google Scholar]
- Pan H. P., Yang X. W., Siegfried B. D. & Zhou X. G. A comprehensive selection of reference genes for RT-qPCR analysis in a predatory lady beetle, Hippodamia convergens (Coleoptera: Coccinellidae). PLOS ONE 10, e0125868 (2015). [DOI] [PMC free article] [PubMed] [Google Scholar]
- Yang C. X., Pan H. P., Liu Y. & Zhou X. G. Selection of reference genes for expression analysis using quantitative real-time PCR in the pea aphid, Acyrthosiphon pisum (Harris) (Hemiptera, Aphidiae). PLOS ONE 9, e110454 (2014). [DOI] [PMC free article] [PubMed] [Google Scholar]
- Fu W. et al. Exploring valid reference genes for quantitative real-time PCR analysis in Plutella xylostella (Lepidoptera: Plutellidae). Int. J. Biol. Sci. 9, 792–802 (2014). [DOI] [PMC free article] [PubMed] [Google Scholar]
- Li R. M. et al. Reference gene selection for qRT-PCR analysis in the sweetpotato whitefly, Bemisia tabaci (Hemiptera: Aleyrodidae). PLOS ONE 8, e53006 (2013). [DOI] [PMC free article] [PubMed] [Google Scholar]
- Zhu X. et al. Selection and evaluation of reference genes for expression analysis using qRT-PCR in the beet armyworm Spodoptera exigua (Hübner) (Lepidoptera: Noctuidae). PLOS ONE 9, e84730 (2014). [DOI] [PMC free article] [PubMed] [Google Scholar]
- Thellin O. et al. Housekeeping genes as internal standards: use and limits. J. Biotechnol. 75, 291–295 (1999). [DOI] [PubMed] [Google Scholar]
- Bustin S. A. Absolute quantification of mRNA using real-time reverse transcription polymerase chain reaction assays. J. Mol. Endocrinol. 25, 169–193 (2000). [DOI] [PubMed] [Google Scholar]
- Dheda K. et al. The implications of using an inappropriate reference gene for real-time reverse transcription PCR data normalization. Anal. Biochem. 344, 141–143 (2005). [DOI] [PubMed] [Google Scholar]
- Svingen T., Jørgensen A. & Rajpert-De Meyts E. Validation of endogenous normalizing genes for expression analyses in adult human testis and germ cell neoplasms. Mol. Hum. Reprod. 20, 709–718 (2014). [DOI] [PubMed] [Google Scholar]
- Andersen C. L., Jensen J. L. & Ørntoft T. F. Normalization of real-time quantitative reverse transcription-PCR data: a model-based variance estimation approach to identify genes suited for normalization, applied to bladder and colon cancer data sets. Cancer Res. 64, 5245–5250 (2004). [DOI] [PubMed] [Google Scholar]
- Pfaffl M. W., Tichopad A., Prgomet C. & Neuvians T. P. Determination of stable housekeeping genes, differentially regulated target genes and sample integrity: BestKeeper–Excel-based tool using pair-wise correlations. Biotechnol. Lett. 26, 509–515 (2004). [DOI] [PubMed] [Google Scholar]
- Silver N., Best S., Jiang J. & Thein S. L. Selection of housekeeping genes for gene expression studies in human reticulocytes using real-time PCR. BMC Mol. Biol. 7, 33 (2006). [DOI] [PMC free article] [PubMed] [Google Scholar]
- Xie F. L., Xiao P., Chen D. L., Xu L. & Zhang B. miRDeepFinder: a miRNA analysis tool for deep sequencing of plant small RNAs. Plant Mol. Biol. 80, 75–84 (2012). [DOI] [PubMed] [Google Scholar]
Associated Data
This section collects any data citations, data availability statements, or supplementary materials included in this article.