

Abstract

Organic anion transporting polypeptides 1B1 and 1B3 are transporters selectively expressed on the basolateral membrane of the hepatocyte. Several studies reveal that they are involved in drug–drug interactions, cancer, and hyperbilirubinemia. In this study, we developed a set of classification models for OATP1B1 and 1B3 inhibition based on more than 1700 carefully curated compounds from literature, which were validated via cross-validation and by use of an external test set. After combining several sets of descriptors and classifiers, the 6 best models were selected according to their statistical performance and were used for virtual screening of DrugBank. Consensus scoring of the screened compounds resulted in the selection and purchase of nine compounds as potential dual inhibitors and of one compound as potential selective OATP1B3 inhibitor. Biological testing of the compounds confirmed the validity of the models, yielding an accuracy of 90% for OATP1B1 and 80% for OATP1B3, respectively. Moreover, at least half of the new identified inhibitors are associated with hyperbilirubinemia or hepatotoxicity, implying a relationship between OATP inhibition and these severe side effects.
Keywords: organic anion transporting polypeptide B1, organic anion transporting polypeptide B3, OATP1B1, OATP1B3, liver, hepatocyte, transporters, inhibitors, classification, Random Forest, Support Vector Machines, DrugBank, virtual screening
Introduction
Detoxification mainly takes place in the hepatocyte and is accomplished by a diverse series of transferase-mediated conjugation reactions with charged moieties such as glutathione, glucuronide, and sulfate, resulting in negatively charged, amphiphilic compounds that are efficiently secreted into bile or urine. The hepatocyte is an epithelial cell which comprises two membrane domains, the basolateral (sinusoidal) and the apical (canalicular) membrane.1,2 Together with metabolizing enzymes, transmembrane transporters are important determinants regarding drug metabolism and drug clearance by the liver. Their significant role has been increasingly recognized in terms of drug and metabolite pharmacokinetics.2,3 Transport proteins in the basolateral membrane of the liver cause drugs to enter the hepatocyte, where metabolism takes place, while in the apical membrane of the hepatocyte the residing ATP-dependent efflux pumps transfer drugs and metabolites from the hepatocyte to bile. Among the transporters residing on the basolateral (sinusoidal) membrane of human hepatocytes are organic anion transporting polypeptides (OATP1B1, 1B3, and 2B1), NTCP, OAT2, and OCT1. Among the canalicular transporters are MRPs (1, 2, 3, and 6), MDRs (1 and 3), BSEP (ABCB11), and BCRP (ABCG2).2,4,5
OATPs are encoded by the genes of the SLCO/Slco (SLCO for humans/Slco for rodents) superfamily.3,6−9 The particular superfamily was originally named SLC21A. However, the nomenclature of its members was updated and standardized in 2004 on the basis of phylogenetic relationships, resulting in its being renamed SLCO, the solute carrier family of OATPs.3,6,7,9 11 human OATPs have been identified, which are organized in 6 distinct families: OATP1, OATP2, OATP3, OATP4, OATP5, and OATP6. These might be split further into subfamilies (OATP1A, OATP1B, and OATP1C).7,10−13 OATP1B1 (encoded by the SLCO1B1 gene) and OATP1B3 (encoded by the SLCO1B3 gene) are transporters exclusively expressed on the basolateral membrane of the hepatocyte.6 They have a wide and overlapping range of substrates and inhibitors, including various endobiotics, such as bilirubin, estradiol-17β-glucuronide, thyroxine (T4), cholate, and taurocholate. In the liver, OATPs take up bile acids, thus helping in preservation of a circulating pool of bile acids, an important factor for bile flow. This way they contribute to the bile acids and cholesterol homeostasis.14,15 Furthermore, OATPs are among the transmembrane transporters that regulate the uptake of thyroid hormones into their target cells throughout the body, as well as from the mother to the fetus.14,16−19 Apart from endogenous compounds, OATPs can transport many marketed drugs, such as erythromycin, levofloxacin, imatinib, pitavastatin, and enalapril (substrates) and cyclosporine, atorvastatin, telmisartan, and diazepam (inhibitors). Due to their wide range of substrates and inhibitors, they are implicated in various drug–drug interactions.20−24
Additionally, they are closely associated with cancer, as many anticancer agents are OATP1B1 and 1B3 substrates or/and inhibitors. Therefore, they affect the intracellular concentration of these drugs and alter their effectiveness.25−27 The association between OATPs and cancer is also based on the fact that the localization and the expression level of these transporters alters in cancer tissues, which further influences the uptake and exposure of drugs.25,28−30Moreover, since these influx transporters are working together with efflux transporters and metabolizing enzymes, they are suspected to play an important role in chemoresistance during chemotherapy.25,31,32
Last, but not least, OATPs are correlated to hyperbilirubinemia, a condition of accumulation of bilirubin in the body. Hyperbilirubinemia has been extensively studied in terms of neurotoxicity, where it appeared that bilirubin may change synaptic potentials and functions of neurotransmitters. It can also interfere with oxidative phosphorylation, enhance DNA instability, interrupt protein synthesis, and block the activity of mitochondrial enzymes. Therefore, apart from neurotoxicity, bilirubin may lead to non-neural organ dysfunctions. Moreover, hyperbilirubinemia can be considered as an early warning of possible adverse effects such as hepatotoxicity, since hepatotoxicity is often accompanied by elevated levels of bilirubin.33−35
Bilirubin is taken up to the hepatocyte by OATP1B1 and 1B3 and is subsequently metabolized into mono- and diglucuronide conjugates by UGT1A1 (UDP-glucuronosyltransferase 1A1). These conjugated bilirubin-glucuronides are excreted into bile by the hepatobiliary ABC-transporter MRP2 (multidrug resistance protein 2), as well as, to a smaller extent, by BCRP.5,36 In the case of impaired biliary excretion, as a compensatory pathway, the glucuronidated bilirubin may also be secreted back to the sinusoidal blood by MRP3.5,33,36,37 Thus, since bilirubin is imported by OATP1B1 and 1B3, a potential inhibition of those transporters can lead to the increase of unconjugated bilirubin in the blood and eventually cause hyperbilirubinemia.
Considering the multifactorial role of OATP1B1 and OATP1B3 for drug uptake, efficacy, and metabolism, they also have been included in the table of “Selected Transporter-Mediated Clinical Significant Drug–Drug Interactions (7/28/2011)” of the FDA.38 Therefore, predictive models allowing the assessment of risk for a compound to interact with OATP1B1 and OATP1B3 would be useful tools at the early stage of drug development. Classification models for OATP1B1 and B3 inhibition are already available in the literature.39−41 Karlgren et al.40 generated a computational model for OATP1B1, based on 146 compounds (98 in the training set and 48 in the test set) using orthogonal partial least-squares projection to latent structures discriminant analysis (OPLS-DA) based on a set of molecular descriptors. As a follow-up,41 they also published a model for OATP1B1 and OATP1B3 inhibition, based on 225 compounds (two-thirds randomly assigned as a training set and one-third as a test set), using multivariate partial least-squares (PLS) regression and physicochemical descriptors. De Bruyn et al.39 followed a proteochemometric modeling approach, using almost 2000 compounds for their training set and 54 compounds as an external test set, combining protein-based and ligand-based molecular descriptors and using Random Forest as a classifier. After careful manual curation and removal of compounds that showed contradictory class labels, we used these data sets to develop a set of in silico classification models suitable for virtual screening of compound libraries. This was followed by virtual screening of DrugBank and subsequent biological evaluation of the top ranked compounds, in order to identify existent inhibitors among drugs that are currently on the market or in the stage of clinical trials.
Experimental Section
In Silico Modeling for the Prediction of OATP1B1 and OATP1B3 Inhibition
Selection and Curation of Data Sets
High quality data sets are key for statistical modeling.42−45 For our study we used two recently published large data sets for the inhibition of OATP1B1 and 1B3, one containing 2000 compounds39 and one consisting of 225 compounds.41 The first data set was used as a training set and the second data set as an external test set. The external test set was downloaded from ChEMBL,46 and the training set was kindly provided by Gerard J. P. van Westen. Subsequently, both data sets were curated according to a set of protocols, which have been developed in house:47
-
•
Inorganic compounds, salt parts as well as compounds containing metals and rare or special atoms were removed (MOE 2013.0801).48
-
•
The chemotypes were standardized using an in-house Pipeline Pilot (version 9.1.0.13)49 workflow.
-
•
Duplicates and permanently charged compounds were removed.
-
•
3D structures were generated using CORINA (version 3.4),50 and their energy was minimized with MOE 2013.0801, using default settings with an extra setting of preserving the existing chirality and changing the gradient to 0.05 RMS kcal/mol/A2.
Finally, the training and the test set were checked for duplicates. In total, 68 and 70 overlapping compounds were identified for OATP1B1 and OATP1B3, respectively. In most cases, the overlapping compounds were of the same class (using 50% (±10%) inhibition as threshold, as defined by the initial authors). For these cases, since the overlapping compounds were mostly noninhibitors, we decided to remove them from the training set and keep them in the test instead. Those compounds showing contradictory class labels (10 compounds for OATP1B1 and 2 compounds for OATP1B3) were removed from both data sets.
This procedure finally led to a training set of 1708 compounds (190 inhibitors and 1518 noninhibitors) for OATP1B1 and of 1725 compounds (124 inhibitors and 1601 noninhibitors) for OATP1B3, respectively. The external test set contained 201 compounds for OATP1B1 (64 inhibitors and 137 noninhibitors) and 209 compounds for OATP1B3 (40 inhibitors and 169 noninhibitors).
Generation of Statistical Models
Algorithms Used
The open-source software WEKA (version 3-7-10)51 served as the basis for generating classification models. The following classifiers were explored: Naive Bayes, k Nearest Neighbors (k = 5), Decision Tree (J48 in WEKA), Random Forest, and Support Vector Machines (SMO in WEKA). Furthermore, because of the highly imbalanced training set, the meta-classifiers MetaCost and CostSensitive Classifier, as implemented in WEKA, were used. They are both cost-sensitive meta-classifiers that artificially balance the training set. In each case, the cost matrix was set according to the ratio of noninhibitors vs inhibitors. In the case of OATP1B1 the ratio noninhibitors/inhibitors was equal to 8, thus the matrix used during the application of cost was [0.0, 1.0; 8.0, 0.0]. For OATP1B3 the respective ratio was equal to 13, thus the respective cost matrix was [0.0, 1.0; 13.0, 0.0].
The best results were obtained using MetaCost52 as meta-classifier and Random Forest (RF) and Support Vector Machines (SMO) as base-classifiers.
Molecular Descriptors
Using MOE 2013.0801,48 all the available 2D and selected 3D molecular descriptors (like the whole series of Volsurf descriptors) were calculated. Additionally, in order to generate models with open-source descriptors, an analogous set of descriptors was calculated with PaDEL-Descriptor (version 2.18).53 Additionally, several fingerprints such as MACCS-keys using PaDEL and ECFPs using RDkit were also calculated.
In a first run, a set of basic physicochemical descriptors were used for model generation. This should allow us to derive basic physicochemical properties driving OATP1B inhibition. For MOE, these comprised a_acc (number of H-bond acceptors), a_don (number of H-bond donors), logP (o/w) (lipophilicity), mr (molecular refractivity), TPSA (topological polar surface area), and weight (molecular weight, MW). The analogous descriptors calculated with PaDEL included nHBAcc_Lipinski, nHBDon_Lipinski, CrippenLogP, CrippenMR, TopoPSA, and MW. The absolute values were not fully identical to those calculated with MOE, as slightly different algorithms are used by the two software packages. In order to further enrich the original set of the six descriptors, a few topological descriptors were additionally calculated, thus leading to a third set comprising 11 molecular descriptors: nHBAcc_Lipinski, nHBDon_Lipinski (number of H-bond donors and acceptors according to Lipinski), CrippenLogP, CrippenMR (Wildman–Crippen logP and mr), TopoPSA, MW, nRotB (number of rotable bonds), topoRadius (topological radius), topoDiameter (topological diameter), topoShape (topological shape), and globalTopoChargeIndex (global topological charge index).
Finally, combining the three sets of descriptors with the two base-classifier methods selected, six models were generated for each transporter. A detailed description of the model settings is given in the Supporting Information.
Model Validation
The statistical models were validated using 5-fold and 10-fold cross-validation, as well as with the external test set. The parameters used comprised Accuracy, Sensitivity (True Positive Rate), Specificity, Mathews Correlation Coefficient (MCC), and Receiver Operating Characteristic (ROC) Area.54 A detailed description of all parameters is provided in the Supporting Information. The cost for the MetaCost meta-classifier was applied based on a standard confusion matrix.
The performance of all models was relatively equivalent with total accuracy values and ROC areas for the test set in the range of 0.81–0.86 and of 0.81–0.92, respectively. Generally, the OATP1B3 models performed slightly better than the ones for OATP1B1. In order to retain as much information as possible, all models were subsequently used for the virtual screening of DrugBank, implementing a consensus scoring approach. Therefore, the prediction score of each classification model for every compound was summed up, giving a float score prediction number between 0 and 6.
In Silico Screening of DrugBank
In order to perform a prospective assessment of the predictivity of our models, DrugBank (Version 4.1)55 (http://www.drugbank.ca/), which contains 7740 drug entries including 1584 FDA-approved small molecule drugs, 157 FDA-approved biotech (protein/peptide) drugs, 89 nutraceuticals, and over 6000 experimental drugs, was virtually screened, and the top ranked compounds were purchased and experimentally tested. The in silico screen was restricted to the small molecules (either approved or experimental), since this is the chemical space upon which the models were generated. Before the screening, the compounds underwent the same curation process as the compounds from the training and test sets. This resulted in a screening set of 6279 compounds in total. For each screened compound we obtained two scores for each model: (i) a binary score, 0 if the compound was predicted as noninhibitor and 1 if the compound was predicted as inhibitor; and (ii) a float-number score between 0 and 1, [0, 0.5] if the compound is predicted as noninhibitor and [0.5, 1] if the compound is predicted as inhibitor. The individual binary and the float-number scores for each model were added up and gave a consensus class prediction (integer consensus score) and a predictive score (float consensus score) for each compound, which were afterward ranked from inhibitors to noninhibitors according to these additive scores. In general, a compound was considered as being an inhibitor if it was predicted as inhibitor by at least 3 out of the 6 models for each transporter, while the float-number score was also taken into consideration.
Selection of Compounds for Biological Testing
For the selection and purchase of potential inhibitors, those compounds having an integer consensus score of 6 were taken and ranked according to their float consensus score. Subsequently, a similarity search based on MACCS fingerprints and the Tanimoto coefficient was performed with MOE, comparing the selected screening hits from DrugBank with the compounds included in the training and in the external test set. Thus, any high ranked compound in DrugBank showing a Tanimoto similarity higher than 0.85 to inhibitors from the training set or the test set was excluded from the shopping list. Furthermore, compounds that are known OATP1B1 and/or OATP1B3 inhibitors were also excluded. Last but not least, the final selection of compounds for purchase was influenced by their commercial availability and the respective costs. The ten compounds that were finally selected were purchased from Glentham Life Sciences, U.K. (http://www.glenthamls.com/, 6 compounds) and from Sigma-Aldrich (https://www.sigmaaldrich.com, 4 compounds). The purity of all compounds was ≥95%. Out of the ten compounds, nine were predicted as inhibitors for both OATP1B1 and OATP1B3 and one was predicted as selective OATP1B3 inhibitor with a binary score of 6 for OATP1B3 and of 1 for OATP1B1.
Inhibition Assay for OATP1B1 and OATP1B3
Chinese hamster ovary (CHO) cells that were stably transfected with OATP1B1 or OATP1B3 and wild-type CHO cells were provided by the University of Zurich, Switzerland, and have been extensively characterized previously.24,56,57 Cells were grown in Dulbecco’s modified Eagle medium (DMEM) supplemented with 10% FCS, 50 μg/mL l-proline, 100 U/mL penicillin, and 100 μg/mL streptomycin. The culture media of the transfected CHO cells additionally contained 500 μg/mL Geneticin sulfate (G418) (Sigma-Aldrich, Munich, Germany). Media and supplements were obtained from Invitrogen (Karlsruhe, Germany). Cells were incubated at 5% CO2 and 37 °C. For uptake experiments, CHO cells were seeded in 24-well plates (BD Biosciences, Heidelberg, Germany) at a density of 25,000 cells/well. Uptake assays were generally performed on day 3 after seeding, when the cells had grown to confluence. 24 h before starting the transport experiments, cells were additionally treated with 5 mM sodium butyrate (Sigma-Aldrich, Munich, Germany) to induce gene expression. Prior to the uptake experiments, cells were rinsed twice with 2 mL of prewarmed (37 °C) uptake buffer (116.4 mM NaCl, 5.3 mM KCL, 1 mM NaH2PO4, 0.8 mM MgSO4, 5.5 mM d-glucose, and 20 mM Hepes, pH adjusted to 7.4). Uptake was initiated by adding 0.5 mL of uptake buffer containing 5 μM of the fluorescent OATP1B1/1B3 substrate FMTX58 in the presence or absence of inhibitors. After 10 min culture at 37 °C, uptake was stopped by removing the uptake solution and washing the cells 3 times with ice-cold uptake buffer. The cells were then lysed with 0.5 mL of 0.5% Triton X-100 solution dissolved in PBS and placed on a plate shaker for 30 min. Fluorescence was measured in an Enspire Multimode plate reader (PerkinElmer, Waltham, MA) at an excitation wavelength of 485 and an emission wavelength of 528 nm.
IC50 values were determined by plotting the log inhibitor concentration against the net uptake rate and nonlinear regression of the data set using the equation
in which y is the net uptake rate (pmol/μg of protein/min), I is the inhibitor concentration (μM), s is the slope at the point of inversion, and a and b are the maximum and minimum values for cellular uptake (GraphPad Software, San Diego, CA, USA) . Net uptake was calculated for each inhibitor concentration as the difference in the uptake rates of the transporter-expressing and wild-type cell lines. Unless otherwise indicated, values are expressed as mean ± SD of three individual experiments. Significant differences from control values were determined using a Student’s paired t test at a significance level of p < 0.05.
Results and Discussion
The Problem of Imbalanced Data Sets
One of the major challenges when dealing with real life scenarios is the imbalance of data sets. While most classification studies published in the literature show an equal number of actives and inactives, our data sets comprised a ratio of 8/1 for noninhibitors/inhibitors for OATP1B1 and of 13/1 for OATP1B3, respectively (Figure 1). This resulted in a very poor performance when applying base classifiers directly on the training set, with sensitivity values lower than 0.2 (data not shown).
Figure 1.

Graphical representation of the numeric gap between inhibitors and noninhibitors of OATP1B1 and OATP1B3 for both the training and the test set.
There are several methods for dealing with imbalanced data when using machine learning techniques.59−61 Indicatively, they comprise undersampling, oversampling, bagging, boosting, and application of costs. In our case, the application of a cost for misclassification of the minority class, using the meta-classifier MetaCost in WEKA, yielded the best results.
Classification Models for OATP1B1 and OATP1B3
Combining several sets of descriptors with various base- and meta-classifiers resulted in a cluster of models, based on Random Forest and Support Vector Machines (SMO) in combination with MetaCost as a cost-sensitive meta-classifier. All models present in the final cluster were validated via 5- and 10-fold cross-validation, as well as with the use of an external test set, composed of 201 and 209 compounds for OATP1B1 and OATP1B3, respectively.41 Although the latter data set has been measured under different assay conditions than the respective one used in the training set, a comparison of the overlapping compounds showed high consistency. The statistical results of all models were quite similar and are presented in Tables 1 and 2.
Table 1. Detailed Statistical Results of OATP1B1 Inhibition Models.
| model | validation | accuracy | sensitivity | specificity | precision | MCC | ROC area |
|---|---|---|---|---|---|---|---|
| B1_6MOE_RF | test set | 0.846 | 0.719 | 0.905 | 0.780 | 0.638 | 0.815 |
| 10-fold CV | 0.843 | 0.611 | 0.872 | 0.374 | 0.394 | 0.795 | |
| 5-fold CV | 0.858 | 0.621 | 0.888 | 0.410 | 0.428 | 0.790 | |
| B1_6MOE_SMO | test set | 0.841 | 0.672 | 0.920 | 0.796 | 0.622 | 0.869 |
| 10-fold CV | 0.862 | 0.489 | 0.909 | 0.403 | 0.366 | 0.808 | |
| 5-fold CV | 0.862 | 0.495 | 0.908 | 0.402 | 0.368 | 0.791 | |
| B1_6PaD_SMO | test set | 0.811 | 0.719 | 0.854 | 0.697 | 0.568 | 0.814 |
| 10-fold CV | 0.841 | 0.626 | 0.868 | 0.373 | 0.399 | 0.790 | |
| 5-fold CV | 0.843 | 0.605 | 0.872 | 0.372 | 0.390 | 0.787 | |
| B1_6PaD_SMO | test set | 0.821 | 0.609 | 0.920 | 0.780 | 0.570 | 0.851 |
| 10-fold CV | 0.867 | 0.453 | 0.919 | 0.411 | 0.357 | 0.806 | |
| 5-fold CV | 0.864 | 0.453 | 0.915 | 0.400 | 0.348 | 0.799 | |
| test set | 0.831 | 0.719 | 0.833 | 0.742 | 0.607 | 0.845 | |
| B1_11PaD_RF | 10-fold CV | 0.854 | 0.579 | 0.889 | 0.394 | 0.398 | 0.797 |
| 5-fold CV | 0.853 | 0.595 | 0.885 | 0.394 | 0.404 | 0.801 | |
| B1_11PaD_SMO | test set | 0.821 | 0.547 | 0.949 | 0.833 | 0.568 | 0.868 |
| 10-fold CV | 0.861 | 0.505 | 0.905 | 0.400 | 0.371 | 0.801 | |
| 5-fold CV | 0.861 | 0.500 | 0.906 | 0.401 | 0.370 | 0.790 | |
| consensus model | 0.859 |
Table 2. Detailed Statistical Results of OATP1B3 Inhibition Models.
| model | validation | accuracy | sensitivity | specificity | precision | MCC | ROC area |
|---|---|---|---|---|---|---|---|
| B3_6MOE_RF | test set | 0.847 | 0.775 | 0.864 | 0.574 | 0.574 | 0.847 |
| 10-fold CV | 0.876 | 0.677 | 0.891 | 0.326 | 0.412 | 0.842 | |
| 5-fold CV | 0.871 | 0.661 | 0.887 | 0.312 | 0.394 | 0.821 | |
| B3_6MOE_SMO | test set | 0.852 | 0.825 | 0.858 | 0.579 | 0.603 | 0.919 |
| 10-fold CV | 0.900 | 0.597 | 0.923 | 0.376 | 0.422 | 0.866 | |
| 5-fold CV | 0.893 | 0.589 | 0.916 | 0.353 | 0.401 | 0.852 | |
| B3_6PaD_RF | test set | 0.828 | 0.825 | 0.828 | 0.532 | 0.563 | 0.877 |
| 10-fold CV | 0.870 | 0.677 | 0.884 | 0.312 | 0.400 | 0.844 | |
| 5-fold CV | 0.863 | 0.669 | 0.878 | 0.299 | 0.385 | 0.814 | |
| B3_6PaD_SMO | test set | 0.847 | 0.725 | 0.876 | 0.580 | 0.554 | 0.925 |
| 10-fold CV | 0.894 | 0.516 | 0.923 | 0.342 | 0.365 | 0.853 | |
| 5-fold CV | 0.896 | 0.508 | 0.926 | 0.348 | 0.366 | 0.840 | |
| B3_11PaD_RF | test set | 0.842 | 0.775 | 0.858 | 0.564 | 0.565 | 0.886 |
| 10-fold CV | 0.866 | 0.629 | 0.884 | 0.295 | 0.368 | 0.832 | |
| 5-fold CV | 0.863 | 0.645 | 0.880 | 0.294 | 0.372 | 0.825 | |
| B3_11PaD_SMO | test set | 0.866 | 0.750 | 0.893 | 0.625 | 0.602 | 0.924 |
| 10-fold CV | 0.881 | 0.581 | 0.904 | 0.320 | 0.372 | 0.849 | |
| 5-fold CV | 0.883 | 0.613 | 0.904 | 0.332 | 0.394 | 0.844 | |
| consensus model | 0.917 |
As can be seen in Tables 1 and 2, all six models for each transporter showed approximately the same performance. Thus, we decided to implement a consensus scoring approach to allow input of all models when screening DrugBank, since it has been often suggested in the literature that consensus modeling outperforms single modeling approaches.62−66 This would also increase our confidence regarding the selection of potential OATP1B1 and 1B3 inhibitors for experimental testing, especially in the case of contradictory results among different models. For getting the consensus score, the prediction scores of all models were summed up in order to get a final prediction. The validity of this approach was partially confirmed by calculating the ROC area of the consensus models based on the results of the external test set, as well as by plotting the respective ROC curves, using R67 (Figure 2). Although for both transporters the consensus models did not exhibit the highest AUC, the consensus model for OATP1B3 had the steepest ROC curve vs all the individual ones and was thus selected as the best solution for the subsequent in silico screen of DrugBank. In the case of OATP1B1, the ROC curve was steeper than the curves of five of the individual models, while there was one model, the SMO_11 PaD_B1, which had a slightly steeper curve. However, also for this case the consensus model was used for screening, since the difference was almost insignificant and we were in favor of using a majority vote for screening and compound selection rather than relying on a single model.
Figure 2.

Comparative ROC plots of individual and consensus models for each transporter: (a) total OATP1B1 models ROC plot, (b) OATP1B1 models zoom ROC plot (TP rate [0.0, 0.5] and FP rate [0.0, 0.1]), (c) total OATP1B3 models ROC plot, and (d) OATP1B3 models zoom ROC plot (TP rate [0.0, 0.5] and FP rate [0.0, 0.1]). Black continuous line represents the performance of the consensus model, with red 6MOE_RF, with green 6MOE_SMO, with dark blue 6 PaD_RF, with yellow 6 PaD_SMO, with cyan 11 PaD_RF, with violet 11 PaD_SMO, and with dashed brown line a random performance of 50%.
In Silico Screening of DrugBank
In order to prospectively validate the in silico models, DrugBank was virtually screened using all of the six classification models for each transporter, and the compounds were ranked according to the probability score of being an inhibitor. For OATP1B1, 5371/6279 compounds of DrugBank were predicted as noninhibitors by the consensus vote of the 6 models (85.5%), while 908/6279 were predicted as inhibitors. From the predicted inhibitors, 271 compounds were given an integer score of 6, i.e., they were predicted as inhibitors by all 6 classification models (4.36% of whole DrugBank). For OATP1B3, the overall figures were quite identical (905/6279 compounds were predicted as inhibitors, with 407 compounds showing a consensus score of 6/6). Integer and float consensus scores of all compounds are provided in the Supporting Information.
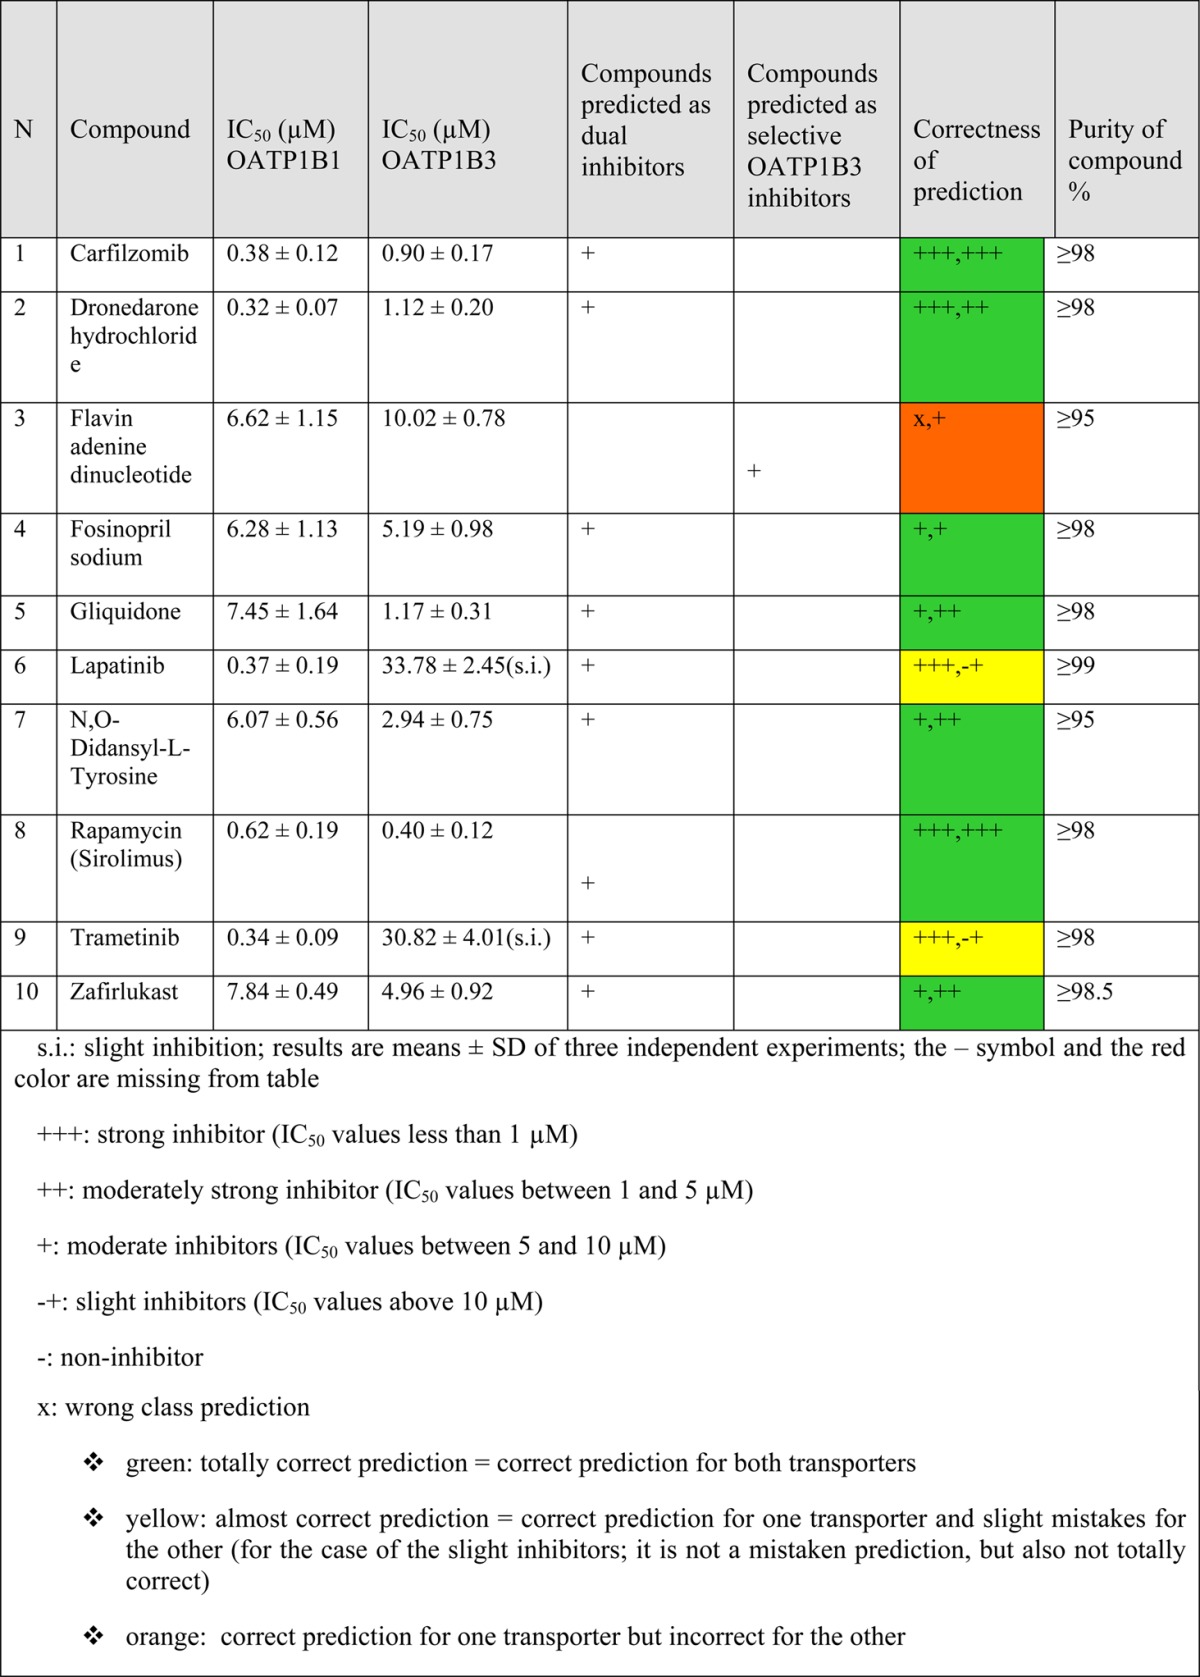
Besides validation of our models by identification of new, hitherto unknown inhibitors of OATP1B1 and OATP1B3 from DrugBank, we also aimed at identifying subtype selective inhibitors. Unfortunately, the development of a 4-class classification model gave poor statistical results (data not shown). Thus, for each compound we compared the predictive scores for both transporters. However, this was quite challenging, since most of the compounds either were presenting the same inhibition profile for both transporters or they were already known OATP1B1 or 1B3 selective inhibitors. Finally, with an integer consensus score of 1 and a float consensus score of 2.062 for OATP1B1 vs 6 (integer score) and 4.430 (float score) for OATP1B3, flavin adenine dinucleotide was proposed as potential selective OATP1B3 inhibitor. As we could not identify a suitable OATP1B1 selective inhibitor, the remaining nine compounds that were selected for biological testing were predicted to inhibit both transporters. All of the selected OATP1B1/1B3 inhibitors, as well as their assay results, are presented in Table 3.
Table 3. Inhibition of OATP1B1 and OATP1B3.
Results of the Inhibition Assay
Since the model’s threshold for inhibitors was 10 μM, compounds with IC50 values less than 1 μM were considered as strong inhibitors (+++), compounds with IC50 values between 1 and 5 μM as moderately strong inhibitors (++), compounds with IC50 values between 5 and 10 μM as moderate inhibitors (+), and compounds having IC50 values above 10 μM as slight inhibitors as long as an IC50 value could be obtained. In cases in which it was impossible to obtain an IC50 value, the compound was considered as noninhibitor.
Considering that the classification models were generated on a threshold of 10 μM, the obtained results are very encouraging regarding the predictive capabilities of the models. The consensus model for OATP1B1 was correct for 9/9 inhibitors, while it was mistaken for the case of the selective OATP1B3 inhibitor. Flavin adenine dinucleotide was also an OATP1B1 inhibitor, which renders it a false negative. For OATP1B3, the respective consensus model was able to predict correctly 8/10 compounds. The two remaining compounds (lapatinib and trametinib) that were predicted as inhibitors had IC50 values above the threshold of the model.
Searching in the literature for any association between these newly identified OATP inhibitors and hepatotoxicity manifestations, such as hyperbilirubinemia, revealed the following findings: Carfilzomib was specifically reported as nonhepatotoxic,68 and we could not find any association to hepatotoxicity for flavin adenine dinucleotide, gliquidone, and N,O-didansyl-l-tyrosine. Flavin adenine dinucleotide is a redox factor, important for the function of many flavoenzymes,69 thus it could not be particularly toxic, while gliquidone is considered a safe antidiabetic drug and has actually been found to improve liver injury in diabetic patients.70N,O-Didansyl-l-tyrosine is an antibacterial agent, still in the experimental stage, so it is quite unlikely to have already reports regarding its toxicity. For trametinib, no reports for hyperbilirubinemia were found. However, it is known for elevating hepatic serum enzymes.71 Finally, dronedarone, fosinopril, lapatinib, rapamycin, and zafirlukast are reported for causing hyperbilirubinemia, when checking in online sources72 and in the literature,73 while there are also some literature reports for hepatotoxicity of these compounds.68,73−78
During the preparation of this manuscript, an additional OATP1B1 classification model was published by van de Steeg et al.79 Their Bayesian model was based on a training set of 437 compounds (37 inhibitors and 400 noninhibitors) and an internal set of 155 compounds for validation (12 inhibitors and 143 noninhibitors), resulting from the screening of a commercial library of 640 FDA-approved drugs. Among the 20 strongest OATP1B1 and OATP1B3 inhibitors are rapamycin and fosinopril, which were also in our hit list. For the rest of the compounds we tested, to the best of our knowledge, they are reported for the first time in our study as OATP1B1 and/or 1B3 inhibitors. Moreover, the analysis of the top 20 compounds from van de Steeg et al. further confirmed the validity and high predictivity of our models. For OATP1B1, 5 compounds were not virtually screened by us, either because they did not exist in DrugBank or because they were removed in some stage of the data set curation. Another 7 compounds (cyclosporin A, atazanavir, dipyridamiole, telmisartan, nicardipine, estradiol, spironolactone) were already included either in our training set or in the test set (6/7 predicted correctly as inhibitors). For the remaining 6 compounds, 5/6 are predicted correctly as inhibitors by our consensus model (bromocriptine mesylate, pranlukast, suramin, troglitazone and docetaxel), while sulfasalazine is predicted as noninhibitor. However, for sulfasalazine we must note that it was initially part of both the De Bruyn39 data set and the Karlgren41 data set. As De Bruyn et al. annotated it as noninhibitor, and Karlgren et al. evaluated it as inhibitor, it was removed from both data sets. Nevertheless, we must emphasize that De Bruyn et al. and Karlgren et al. use different assays. The assay we used is similar to the one from De Bruyn et al. (the source of our training set), while van de Steeg et al. use an assay similar to the one by Karlgren et al. (the source of our test set). This implies that the particular compound might give different results for different assays, and that this is a probable reason for its misclassification by our model.
For OATP1B3, an analogous picture occurs. Six compounds were not virtually screened because of their absence in DrugBank, 7 compounds (cyclosporin A, atazanavir, dipyridamiole, telmisartan, mifepristone, fluvastatin, clarithromycin) were included either in our training set or our test set, and for the remaining 5 compounds we had an accuracy of 100% by our consensus model (suramin, docetaxel, clobetasol propionate, bromocriptine mesylate, and losartan).
Conclusions
The transportome of the liver is most probably the most complex one in the human body. It comprises numerous uptake and efflux transporters that regulate the concentrations of metabolites and endogenous substrates, such as bile acids and bilirubin. Thus, perturbation of this system by drugs might lead to symptoms such as cholestasis or hyperbilirubinemia. With this manuscript we introduce a set of in silico models which aid in the potential early detection of hepatotoxicity manifestations, such as hyperbilirubinemia, by predicting the probability of a compound to block OATP1B1 and OATP1B3 mediated transport of bilirubin. The models have been derived on the basis of a large, manually curated data set, and have been extensively validated by statistical methods, as well as by in silico screening of DrugBank followed by experimental testing of top ranked hits. Among the 9/10 hits confirmed as OATP inhibitors, five are reported for causing hyperbilirubinemia. These results strongly support the use of validated in silico models for prioritizing compounds in the hit triaging process.
Acknowledgments
The research leading to these results has received support from the Innovative Medicines Initiative Joint Undertaking under grant agreements No. 115002 (eTOX) resources of which are composed of financial contribution from the European Union’s Seventh Framework Programme (FP7/2007-2013) and EFPIA companies’ in kind contribution. We also acknowledge financial support provided by the Austrian Science Fund, Grant F3502. We are thankful to Gerard J. P. van Westen for kindly providing the sd file of the data set from De Bruyn et al. 2013.39 E.K. is cordially thankful to colleagues Dr. Lars Richter for his help with data curation and Floriane Montanari (MSc) for the fruitful discussions throughout the project.
Glossary
Abbreviations Used
- OATP1B1
organic anion transporting polypeptide 1B1
- OATP1B3
organic anion transporting polypeptide 1B3
- IC50
half maximal inhibitory concentration
- OATP2B1
organic anion transporting polypeptide 2B1
- NTCP
Na+-taurocholate cotransporting polypeptide
- OAT2
organic anion transporter 2
- OCT1
organic cation transporter 1
- MRPs
multidrug resistance associated proteins
- MDRs
multidrug resistance proteins
- ABC transporters
ATP-binding cassette transporters
- BSEP
bile salt export pump
- BCRP
breast cancer resistance protein
- UGT1A1
UDP-glucuronosyltransferase 1A1
- E1S
estrone sulfate
- DHEAS
dehydroepiandrosterone sulfate
- RF
Random Forest
- SVM
Support Vector Machines
- SMO
sequential minimal optimization
- FMTX
fluoro-methotrexate
- CHO cells
Chinese hamster ovary cells
Supporting Information Available
The Supporting Information is available free of charge on the ACS Publications website at DOI: 10.1021/acs.molpharmaceut.5b00583.
The authors declare no competing financial interest.
Supplementary Material
References
- Paulusma C. C.; Oude Elferink R. P. The canalicular multispecific organic anion transporter and conjugated hyperbilirubinemia in rat and man. J. Mol. Med. (Heidelberg, Ger.) 1997, 756420–8 10.1007/s001090050127. [DOI] [PubMed] [Google Scholar]
- Faber K. N.; Müller M.; Jansen P. L. M. Drug transport proteins in the liver. Adv. Drug Delivery Rev. 2003, 551107–124 10.1016/S0169-409X(02)00173-4. [DOI] [PubMed] [Google Scholar]
- Shitara Y.; Maeda K.; Ikejiri K.; Yoshida K.; Horie T.; Sugiyama Y. Clinical significance of organic anion transporting polypeptides (OATPs) in drug disposition: their roles in hepatic clearance and intestinal absorption. Biopharm. Drug Dispos. 2013, 34145–78 10.1002/bdd.1823. [DOI] [PubMed] [Google Scholar]
- Kimoto E.; Yoshida K.; Balogh L. M.; Bi Y. A.; Maeda K.; El-Kattan A.; Sugiyama Y.; Lai Y. Characterization of organic anion transporting polypeptide (OATP) expression and its functional contribution to the uptake of substrates in human hepatocytes. Mol. Pharmaceutics 2012, 9123535–42 10.1021/mp300379q. [DOI] [PubMed] [Google Scholar]
- Sticova E.; Jirsa M. New insights in bilirubin metabolism and their clinical implications. World J. Gastroenterol 2013, 19386398–407 10.3748/wjg.v19.i38.6398. [DOI] [PMC free article] [PubMed] [Google Scholar]
- Roth M.; Araya J. J.; Timmermann B. N.; Hagenbuch B. Isolation of Modulators of the Liver-Specific Organic Anion-Transporting Polypeptides (OATPs) 1B1 and 1B3 from Rollinia emarginata Schlecht (Annonaceae). J. Pharmacol. Exp. Ther. 2011, 3392624–632 10.1124/jpet.111.184564. [DOI] [PMC free article] [PubMed] [Google Scholar]
- Hagenbuch B.; Stieger B. The SLCO (former SLC21) superfamily of transporters. Mol. Aspects Med. 2013, 342–3396–412 10.1016/j.mam.2012.10.009. [DOI] [PMC free article] [PubMed] [Google Scholar]
- Iusuf D.; van de Steeg E.; Schinkel A. H. Functions of OATP1A and 1B transporters in vivo: insights from mouse models. Trends Pharmacol. Sci. 2012, 332100–8 10.1016/j.tips.2011.10.005. [DOI] [PubMed] [Google Scholar]
- Hagenbuch B.; Meier P. Organic anion transporting polypeptides of the OATP/SLC21 family: phylogenetic classification as OATP/SLCO superfamily, new nomenclature and molecular/functional properties. Pfluegers Arch. 2004, 4475653–665 10.1007/s00424-003-1168-y. [DOI] [PubMed] [Google Scholar]
- van de Steeg E.; van Esch A.; Wagenaar E.; Kenworthy K. E.; Schinkel A. H. Influence of human OATP1B1, OATP1B3, and OATP1A2 on the pharmacokinetics of methotrexate and paclitaxel in humanized transgenic mice. Clin. Cancer Res. 2013, 194821–32 10.1158/1078-0432.CCR-12-2080. [DOI] [PubMed] [Google Scholar]
- Stieger B.; Hagenbuch B. Organic anion-transporting polypeptides. Curr. Top. Membr. 2014, 73, 205–32 10.1016/B978-0-12-800223-0.00005-0. [DOI] [PMC free article] [PubMed] [Google Scholar]
- Hagenbuch B.; Gui C. Xenobiotic transporters of the human organic anion transporting polypeptides (OATP) family. Xenobiotica 2008, 387–8778–801 10.1080/00498250801986951. [DOI] [PubMed] [Google Scholar]
- Kalliokoski A.; Niemi M. Impact of OATP transporters on pharmacokinetics. Br. J. Pharmacol. 2009, 1583693–705 10.1111/j.1476-5381.2009.00430.x. [DOI] [PMC free article] [PubMed] [Google Scholar]
- Kullak-Ublick G. A.; Stieger B.; Meier P. J. Enterohepatic bile salt transporters in normal physiology and liver disease. Gastroenterology 2004, 1261322–42 10.1053/j.gastro.2003.06.005. [DOI] [PubMed] [Google Scholar]
- Alrefai W. A.; Gill R. K. Bile acid transporters: structure, function, regulation and pathophysiological implications. Pharm. Res. 2007, 24101803–23 10.1007/s11095-007-9289-1. [DOI] [PubMed] [Google Scholar]
- van der Deure W. M.; Peeters R. P.; Visser T. J. Molecular aspects of thyroid hormone transporters, including MCT8, MCT10, and OATPs, and the effects of genetic variation in these transporters. J. Mol. Endocrinol. 2010, 4411–11 10.1677/JME-09-0042. [DOI] [PubMed] [Google Scholar]
- Jansen J.; Friesema E. C.; Milici C.; Visser T. J. Thyroid hormone transporters in health and disease. Thyroid 2005, 158757–68 10.1089/thy.2005.15.757. [DOI] [PubMed] [Google Scholar]
- Hagenbuch B. Cellular entry of thyroid hormones by organic anion transporting polypeptides. Best Pract Res. Clin Endocrinol Metab 2007, 212209–21 10.1016/j.beem.2007.03.004. [DOI] [PubMed] [Google Scholar]
- Abe T.; Suzuki T.; Unno M.; Tokui T.; Ito S. Thyroid hormone transporters: recent advances. Trends Endocrinol. Metab. 2002, 135215–20 10.1016/S1043-2760(02)00599-4. [DOI] [PubMed] [Google Scholar]
- Hirano M.; Maeda K.; Shitara Y.; Sugiyama Y. Drug-drug interaction between pitavastatin and various drugs via OATP1B1. Drug Metab. Dispos. 2006, 3471229–1236 10.1124/dmd.106.009290. [DOI] [PubMed] [Google Scholar]
- Neuvonen P. J.; Niemi M.; Backman J. T. Drug interactions with lipid-lowering drugs: Mechanisms and clinical relevance. Clin. Pharmacol. Ther. 2006, 806565–581 10.1016/j.clpt.2006.09.003. [DOI] [PubMed] [Google Scholar]
- Noe J.; Portmann R.; Brun M. E.; Funk C. Substrate-dependent drug-drug interactions between gemfibrozil, fluvastatin and other organic anion-transporting peptide (OATP) substrates on OATP1B1, OATP2B1, and OATP1B3. Drug Metab. Dispos. 2007, 3581308–1314 10.1124/dmd.106.012930. [DOI] [PubMed] [Google Scholar]
- Shitara Y. Clinical Importance of OATP1B1 and OATP1B3 in Drug-Drug Interactions. Drug Metab. Pharmacokinet. 2011, 263220–227 10.2133/dmpk.DMPK-10-RV-094. [DOI] [PubMed] [Google Scholar]
- Treiber A.; Schneiter R.; Hausler S.; Stieger B. Bosentan is a substrate of human OATP1B1 and OATP1B3: Inhibition of hepatic uptake as the common mechanism of its interactions with cyclosporin a, rifampicin, and sildenafil. Drug Metab. Dispos. 2007, 3581400–1407 10.1124/dmd.106.013615. [DOI] [PubMed] [Google Scholar]
- Buxhofer-Ausch V.; Secky L.; Wlcek K.; Svoboda M.; Kounnis V.; Briasoulis E.; Tzakos A. G.; Jaeger W.; Thalhammer T. Tumor-Specific Expression of Organic Anion-Transporting Polypeptides: Transporters as Novel Targets for Cancer Therapy. J. Drug Delivery 2013, 2013, 863539. 10.1155/2013/863539. [DOI] [PMC free article] [PubMed] [Google Scholar]
- Obaidat A.; Roth M.; Hagenbuch B. The Expression and Function of Organic Anion Transporting Polypeptides in Normal Tissues and in Cancer. Annu. Rev. Pharmacol. Toxicol. 2012, 521135–151 10.1146/annurev-pharmtox-010510-100556. [DOI] [PMC free article] [PubMed] [Google Scholar]
- Svoboda M.; Wlcek K.; Taferner B.; Hering S.; Stieger B.; Tong D.; Zeillinger R.; Thalhammer T.; Jager W. Expression of organic anion-transporting polypeptides 1B1 and 1B3 in ovarian cancer cells: Relevance for paclitaxel transport. Biomed. Pharmacother. 2011, 656417–426 10.1016/j.biopha.2011.04.031. [DOI] [PubMed] [Google Scholar]
- Nakanishi T. Drug transporters as targets for cancer chemotherapy. Cancer Genomics Proteomics 2007, 43241–54. [PubMed] [Google Scholar]
- Thakkar N.; Lockhart A. C.; Lee W. Role of Organic Anion-Transporting Polypeptides (OATPs) in Cancer Therapy. AAPS J. 2015, 173535–45 10.1208/s12248-015-9740-x. [DOI] [PMC free article] [PubMed] [Google Scholar]
- Cutler M. J.; Choo E. F. Overview of SLC22A and SLCO families of drug uptake transporters in the context of cancer treatments. Curr. Drug Metab. 2011, 128793–807 10.2174/138920011798357060. [DOI] [PubMed] [Google Scholar]
- Lee W.; Belkhiri A.; Lockhart A. C.; Merchant N.; Glaeser H.; Harris E. I.; Washington M. K.; Brunt E. M.; Zaika A.; Kim R. B.; El-Rifai W. Overexpression of OATP1B3 Confers Apoptotic Resistance in Colon Cancer. Cancer Res. 2008, 682410315–10323 10.1158/0008-5472.CAN-08-1984. [DOI] [PMC free article] [PubMed] [Google Scholar]
- Silvy F.; Lissitzky J. C.; Bruneau N.; Zucchini N.; Landrier J. F.; Lombardo D.; Verrando P. Resistance to cisplatin-induced cell death conferred by the activity of organic anion transporting polypeptides (OATP) in human melanoma cells. Pigm. Cell Melanoma Res. 2013, 264592. 10.1111/pcmr.12108. [DOI] [PubMed] [Google Scholar]
- Chang J. H.; Plise E.; Cheong J.; Ho Q.; Lin M. Evaluating the In Vitro Inhibition of UGT1A1, OATP1B1, OATP1B3, MRP2, and BSEP in Predicting Drug-Induced Hyperbilirubinemia. Mol. Pharmaceutics 2013, 1083067–3075 10.1021/mp4001348. [DOI] [PubMed] [Google Scholar]
- Thanavaro J. L. An Overview of Drug-induced Liver Injury. Journal for Nurse Practitioners 2011, 710819–826 10.1016/j.nurpra.2011.07.007. [DOI] [Google Scholar]
- Leise M. D.; Poterucha J. J.; Talwalkar J. A. Drug-induced liver injury. Mayo Clin. Proc. 2014, 89195–106 10.1016/j.mayocp.2013.09.016. [DOI] [PubMed] [Google Scholar]
- Templeton I.; Eichenbaum G.; Sane R.; Zhou J., Case Study 5. Deconvoluting Hyperbilirubinemia: Differentiating Between Hepatotoxicity and Reversible Inhibition of UGT1A1, MRP2, or OATP1B1 in Drug Development. In Enzyme Kinetics in Drug Metabolism; Humana Press: 2014; Vol. 1113, pp 471–483. [DOI] [PubMed] [Google Scholar]
- Campbell S. D.; de Morais S. M.; Xu J. J. Inhibition of human organic anion transporting polypeptide OATP 1B1 as a mechanism of drug-induced hyperbilirubinemia. Chem.-Biol. Interact. 2004, 1502179–187 10.1016/j.cbi.2004.08.008. [DOI] [PubMed] [Google Scholar]
- http://www.fda.gov/Drugs/DevelopmentApprovalProcess/DevelopmentResources/DrugInteractionsLabeling/ucm093664.htm.
- De Bruyn T.; van Westen G. J. P.; IJzerman A. P.; Stieger B.; de Witte P.; Augustijns P. F.; Annaert P. P. Structure-Based Identification of OATP1B1/3 Inhibitors. Mol. Pharmacol. 2013, 8361257–1267 10.1124/mol.112.084152. [DOI] [PubMed] [Google Scholar]
- Karlgren M.; Ahlin G.; Bergstrom C. A.; Svensson R.; Palm J.; Artursson P. In vitro and in silico strategies to identify OATP1B1 inhibitors and predict clinical drug-drug interactions. Pharm. Res. 2012, 292411–26 10.1007/s11095-011-0564-9. [DOI] [PMC free article] [PubMed] [Google Scholar]
- Karlgren M.; Vildhede A.; Norinder U.; Wisniewski J. R.; Kimoto E.; Lai Y.; Haglund U.; Artursson P. Classification of Inhibitors of Hepatic Organic Anion Transporting Polypeptides (OATPs): Influence of Protein Expression on Drug–Drug Interactions. J. Med. Chem. 2012, 55104740–4763 10.1021/jm300212s. [DOI] [PMC free article] [PubMed] [Google Scholar]
- Wang R. Y.; Kon H. B.; Madnick S. E. Data quality requirements analysis and modeling. Data Eng., 1993. Proc. Ninth Int. Conf. 1993, 670–677 10.1109/ICDE.1993.344012. [DOI] [Google Scholar]
- Wang R. Y.; Storey V. C.; Firth C. P. A framework for analysis of data quality research. Knowledge and Data Engineering, IEEE Transactions on 1995, 74623–640 10.1109/69.404034. [DOI] [Google Scholar]
- Chu X.; Ilyas I. F.; Papotti P.; Ye Y. RuleMiner: Data quality rules discovery. Data Eng. (ICDE), 2014 IEEE 30th Int. Conf. 2014, 1222–1225 10.1109/ICDE.2014.6816746. [DOI] [Google Scholar]
- Yuan M.; Liu W.; Huang G.; Gao J. A Noval Data Quality Controlling and Assessing Model Based on Rules. ISECS ’10 Proc. 2010 Third Int. Symp. Electron. Commer. Secur. 2010, 29–32 10.1109/ISECS.2010.15. [DOI] [Google Scholar]
- https://www.ebi.ac.uk/chembl/.
- Zdrazil B.; Pinto M.; Vasanthanathan P.; Williams A. J.; Balderud L. Z.; Engkvist O.; Chichester C.; Hersey A.; Overington J. P.; Ecker G. F. Annotating Human P-Glycoprotein Bioassay Data. Mol. Inf. 2012, 318599–609 10.1002/minf.201200059. [DOI] [PMC free article] [PubMed] [Google Scholar]
- Molecular Operating Environment (MOE), 2013.08.01; Chemical Computing Group Inc.: 1010 Sherbooke St. West, Suite #910, Montreal, QC, Canada, H3A 2R7, 2015. [Google Scholar]
- Pipeline Pilot, 9.1.0.13; Accelrys Software Inc.: San Diego, 2013. [Google Scholar]
- Sadowski J.; Gasteiger J.; Klebe G. Comparison of Automatic Three-Dimensional Model Builders Using 639 X-ray Structures. J. Chem. Inf. Model. 1994, 3441000–1008 10.1021/ci00020a039. [DOI] [Google Scholar]
- Hall M.; Frank E.; Holmes G.; Pfahringer B.; Reutemann P.; Witten I. H. The WEKA data mining software: an update. SIGKDD Explor. Newsl. 2009, 11110–18 10.1145/1656274.1656278. [DOI] [Google Scholar]
- Domingos P.MetaCost: a general method for making classifiers cost-sensitive. In Proceedings of the fifth ACM SIGKDD international conference on Knowledge discovery and data mining, ACM: San Diego, CA, USA, 1999. [Google Scholar]
- Yap C. W. PaDEL-descriptor: An open source software to calculate molecular descriptors and fingerprints. J. Comput. Chem. 2011, 3271466–1474 10.1002/jcc.21707. [DOI] [PubMed] [Google Scholar]
- Baldi P.; Brunak S.; Chauvin Y.; Andersen C. A. F.; Nielsen H. Assessing the accuracy of prediction algorithms for classification: an overview. Bioinformatics 2000, 165412–424 10.1093/bioinformatics/16.5.412. [DOI] [PubMed] [Google Scholar]
- Law V.; Knox C.; Djoumbou Y.; Jewison T.; Guo A. C.; Liu Y.; Maciejewski A.; Arndt D.; Wilson M.; Neveu V.; Tang A.; Gabriel G.; Ly C.; Adamjee S.; Dame Z. T.; Han B.; Zhou Y.; Wishart D. S. DrugBank 4.0: shedding new light on drug metabolism. Nucleic Acids Res. 2014, 42D1D1091–D1097 10.1093/nar/gkt1068. [DOI] [PMC free article] [PubMed] [Google Scholar]
- Gui C.; Miao Y.; Thompson L.; Wahlgren B.; Mock M.; Stieger B.; Hagenbuch B. Effect of pregnane X receptor ligands on transport mediated by human OATP1B1 and OATP1B3. Eur. J. Pharmacol. 2008, 584157–65 10.1016/j.ejphar.2008.01.042. [DOI] [PMC free article] [PubMed] [Google Scholar]
- Riha J.; Brenner S.; Böhmdorfer M.; Giessrigl B.; Pignitter M.; Schueller K.; Thalhammer T.; Stieger B.; Somoza V.; Szekeres T.; Jäger W. Resveratrol and its major sulfated conjugates are substrates of organic anion transporting polypeptides (OATPs): Impact on growth of ZR-75–1 breast cancer cells. Mol. Nutr. Food Res. 2014, 5891830–1842 10.1002/mnfr.201400095. [DOI] [PubMed] [Google Scholar]
- Gui C.; Obaidat A.; Chaguturu R.; Hagenbuch B. Development of a cell-based high-throughput assay to screen for inhibitors of organic anion transporting polypeptides 1B1 and 1B3. Curr. Chem. Genomics 2010, 4, 1–8 10.2174/1875397301004010001. [DOI] [PMC free article] [PubMed] [Google Scholar]
- Chawla N. V.; Bowyer K. W.; Hall L. O.; Kegelmeyer W. P. SMOTE: Synthetic minority over-sampling technique. J. Artif. Intell. Res. 2002, 16, 321–357. [Google Scholar]
- Galar M.; Fernandez A.; Barrenechea E.; Bustince H.; Herrera F. A Review on Ensembles for the Class Imbalance Problem: Bagging-, Boosting-, and Hybrid-Based Approaches. Ieee Transactions on Systems Man and Cybernetics Part C-Applications and Reviews 2012, 424463–484 10.1109/TSMCC.2011.2161285. [DOI] [Google Scholar]
- Kotsiantis S.; Kanellopoulos D.; Pintelas P. Handling imbalanced datasets: A review. GESTS Int. Trans. Comput. Sci. Eng. 2006, 30125–36. [Google Scholar]
- Li J.; Lei B.; Liu H.; Li S.; Yao X.; Liu M.; Gramatica P. QSAR study of malonyl-CoA decarboxylase inhibitors using GA-MLR and a new strategy of consensus modeling. J. Comput. Chem. 2008, 29162636–47 10.1002/jcc.21002. [DOI] [PubMed] [Google Scholar]
- Gramatica P.; Pilutti P.; Papa E. Validated QSAR prediction of OH tropospheric degradation of VOCs: splitting into training-test sets and consensus modeling. J. Chem. Inf. Model. 2004, 4451794–802 10.1021/ci049923u. [DOI] [PubMed] [Google Scholar]
- Li Y.; Shao X.; Cai W. A consensus least squares support vector regression (LS-SVR) for analysis of near-infrared spectra of plant samples. Talanta 2007, 721217–22 10.1016/j.talanta.2006.10.022. [DOI] [PubMed] [Google Scholar]
- Ganguly M.; Brown N.; Schuffenhauer A.; Ertl P.; Gillet V. J.; Greenidge P. A. Introducing the consensus modeling concept in genetic algorithms: application to interpretable discriminant analysis. J. Chem. Inf. Model. 2006, 4652110–24 10.1021/ci050529l. [DOI] [PubMed] [Google Scholar]
- Gramatica P.; Giani E.; Papa E. Statistical external validation and consensus modeling: a QSPR case study for Koc prediction. J. Mol. Graphics Modell. 2007, 256755–66 10.1016/j.jmgm.2006.06.005. [DOI] [PubMed] [Google Scholar]
- R Core Team. R: A language and environment for statistical computing; R Foundation for Statistical Computing: Vienna, Austria, 2013. http://www.R-project.org/. [Google Scholar]
- Zhu X.; Kruhlak N. L. Construction and analysis of a human hepatotoxicity database suitable for QSAR modeling using post-market safety data. Toxicology 2014, 321062–72 10.1016/j.tox.2014.03.009. [DOI] [PubMed] [Google Scholar]
- Giancaspero T. A.; Busco G.; Panebianco C.; Carmone C.; Miccolis A.; Liuzzi G. M.; Colella M.; Barile M. FAD synthesis and degradation in the nucleus create a local flavin cofactor pool. J. Biol. Chem. 2013, 2884029069–80 10.1074/jbc.M113.500066. [DOI] [PMC free article] [PubMed] [Google Scholar]
- Yanardag R.; Ozsoy-Sacan O.; Orak H.; Ozgey Y. Protective effects of glurenorm (gliquidone) treatment on the liver injury of experimental diabetes. Drug Chem. Toxicol. 2005, 284483–97 10.1080/01480540500262961. [DOI] [PubMed] [Google Scholar]
- http://livertox.nih.gov/.
- http://medsfacts.com/reaccover.php?pt=HYPERBILIRUBINAEMIA.
- Liu Z.; Shi Q.; Ding D.; Kelly R.; Fang H.; Tong W. Translating clinical findings into knowledge in drug safety evaluation--drug induced liver injury prediction system (DILIps). PLoS Comput. Biol. 2011, 712e1002310. 10.1371/journal.pcbi.1002310. [DOI] [PMC free article] [PubMed] [Google Scholar]
- Ekins S.; Williams A. J.; Xu J. J. A predictive ligand-based Bayesian model for human drug-induced liver injury. Drug Metab. Dispos. 2010, 38122302–8 10.1124/dmd.110.035113. [DOI] [PubMed] [Google Scholar]
- Fourches D.; Barnes J. C.; Day N. C.; Bradley P.; Reed J. Z.; Tropsha A. Cheminformatics analysis of assertions mined from literature that describe drug-induced liver injury in different species. Chem. Res. Toxicol. 2010, 231171–83 10.1021/tx900326k. [DOI] [PMC free article] [PubMed] [Google Scholar]
- Rodgers A. D.; Zhu H.; Fourches D.; Rusyn I.; Tropsha A. Modeling liver-related adverse effects of drugs using knearest neighbor quantitative structure-activity relationship method. Chem. Res. Toxicol. 2010, 234724–32 10.1021/tx900451r. [DOI] [PMC free article] [PubMed] [Google Scholar]
- Chen M.; Vijay V.; Shi Q.; Liu Z.; Fang H.; Tong W. FDA-approved drug labeling for the study of drug-induced liver injury. Drug Discovery Today 2011, 1615–16697–703 10.1016/j.drudis.2011.05.007. [DOI] [PubMed] [Google Scholar]
- Liu R.; Yu X.; Wallqvist A. Data-driven identification of structural alerts for mitigating the risk of drug-induced human liver injuries. J. Cheminf. 2015, 7, 4. 10.1186/s13321-015-0053-y. [DOI] [PMC free article] [PubMed] [Google Scholar]
- van de Steeg E.; Venhorst J.; Jansen H. T.; Nooijen I. H.; DeGroot J.; Wortelboer H. M.; Vlaming M. L. Generation of Bayesian prediction models for OATP-mediated drug-drug interactions based on inhibition screen of OATP1B1, OATP1B1 *15 and OATP1B3. Eur. J. Pharm. Sci. 2015, 70, 29–36 10.1016/j.ejps.2015.01.004. [DOI] [PubMed] [Google Scholar]
Associated Data
This section collects any data citations, data availability statements, or supplementary materials included in this article.