

Abstract
Introduction
Although cerebrovascular disease has long been known to co-occur with Alzheimer's disease (AD), recent studies suggest an etiologic contribution to AD pathogenesis. We used four dimensional (4D)-flow magnetic resonance imaging (MRI) to evaluate blood flow and pulsatility indices in the circle of Willis. We hypothesized decreased mean blood flow and increased pulsatility, metrics indicative of poor vascular health, would be associated with cerebral atrophy and an AD cerebrospinal fluid (CSF) profile.
Methods
A total of 312 patients along the AD continuum (172 middle aged, 60 cognitively healthy older, 44 mild cognitive impairment, and 36 AD) underwent MRI, CSF, and medical examinations. Regression was used to predict CSF biomarkers and atrophy from 4D-flow and analysis of covariance to compare vascular health between groups.
Results
Decreased mean flow in the middle cerebral artery (MCA) and superior portion of the internal carotid artery (sICA) and increased pulsatility in the MCA were associated with greater brain atrophy. Decreased mean flow in the sICA was associated with lower amyloid beta 1–42 (Aβ42) in the CSF, a pathologic biomarker profile associated with AD. Interestingly, although metrics of flow and pulsatility differed markedly across the AD spectrum, there were no significant differences in cardiovascular risk score, mean arterial pressure, and pulse pressure across the three age-matched older cohorts.
Discussion
By measuring intracranial arterial health directly with 4D-flow MRI, these data suggest that intracranial arterial health is compromised in symptomatic AD. Even after accounting for disease stage, cerebral artery health is associated with atrophy and an AD Aβ42 profile, suggesting neurovascular health may contribute to the etiopathogenesis of AD.
Keywords: Mean blood flow, Pulsatility index, Circle of Willis, Cardiovascular risk, Alzheimer's disease
1. Introduction
Although viewed as separate clinical entities, the line between Alzheimer's disease (AD) and vascular-mediated cognitive decline is increasingly blurred. An autopsy study found that of patients clinically diagnosed with AD, almost half had mixed pathology, the most common of which was vascular. This suggests that vascular pathology may be a salient contributing feature to dementia [1], [2]. Additionally, patients with mixed pathology were more likely than those with singular pathology to present with dementia clinically [1]. The American Heart and Stroke Associations posit that the synergism between AD and vascular pathology heightens the risk of cognitive impairment. It is suggested that the same risk factors identified for stroke may also predict AD; specifically, hypertension is believed to be a risk factor for poor brain aging and dementia [3], [4], [5]. Providing further credence to this intertwined relationship, autopsy studies show that patients with AD were more likely to have significant atherosclerotic deposits in the circle of Willis compared with those in controls [6].
In addition to vascular pathology measured at autopsy, intracranial blood flow has also been shown to differ between AD patients and controls. A study using two-dimensional (2D) phase-contrast magnetic resonance imaging (MRI) in eight AD patients and nine controls found that AD patients had 20% lower total blood flow, suggesting a role for reduced blood flow in AD [7]. Transcranial Doppler (TCD), an ultrasound method commonly used in clinical practice for diagnosing emboli, stenosis, and hemorrhage, demonstrates reduced steady-state cerebral blood flow in AD [8]. Additionally, a TCD analysis in 103 subjects reported decreased mean arterial flow and an increased pulsatility index (PI) in AD patients, suggesting that TCD screening may be able to mitigate symptomatology by identifying people who would benefit from medications to improve cardiovascular health, and by extension, cerebrovascular function [9].
Pulsatility of the cerebral vessels may be especially telling; a study of nondemented elderly participants showed that pulse wave velocity in the brachial-ankle vascular bed, a metric of mixed central and peripheral arterial stiffness, was higher in individuals who were amyloid positive on Pittsburgh imaging compound-B imaging [10]. Another study explored the relationship between arterial stiffness and amyloid deposition over time, finding that a one standard deviation (SD) increase in central pulse wave velocity was associated with an approximately twofold increase in amyloid deposition over a 2-year period [11].
Recent advances in MR hardware and acquisition and reconstruction methods have facilitated the use of 4D-flow MRI in clinically feasible scan times [12]. Of particular interest for cranial imaging is an approach called phase contrast vastly undersampled isotropic projection imaging (PC VIPR), which uses the concept of radial undersampling for accelerated imaging with high spatial and temporal resolution [13], [14]. PC VIPR simultaneously captures the vessel anatomy as well as the vascular flow in the form of a velocity vector field throughout the cardiac cycle and over a large imaging volume. Subsequent postprocessing allows for detailed hemodynamic analysis of various vessels. Using this PC VIPR technique to analyze flow in 11 cranial vessel segments in 314 individuals across the AD spectrum, we observed that AD patients had the lowest intracranial arterial flow, followed by mild cognitive impairment (MCI), than nondemented older controls, and finally middle-aged adults exhibiting the highest flow [15]. The opposite relationship was observed for PI, a surrogate metric of vessel stiffness, with the highest PI values seen in dementia patients. These results were especially marked in the middle cerebral artery (MCA) and the superior portion of the internal carotid artery (sICA) [15]. Given the significant differences in mean blood flow and PI between diagnostic cohorts, the purpose of this study was to determine the relationship between vascular health and markers of AD, including brain atrophy as shown on MRI, and amyloid and tau pathology measured via cerebrospinal fluid (CSF). Furthermore, given that clinical measures of cardiovascular disease were significantly associated with amyloid deposition in several studies [3], [10], [11], a major focus of the present study was to determine if intracranial 4D-flow MRI might account for unique variance in our outcome measures not accounted for by a current gold-standard for assessing cardiovascular disease risk, the atherosclerotic cardiovascular disease (ASCVD) risk score.
2. Methods
2.1. Subject population
A total of 312 (mean age = 64.85 years; SD, 10.26) participants from the University of Wisconsin Alzheimer's Disease Research Center participated in the study. The study population spanned cognitively healthy middle-aged adults, cognitively healthy older adults, clinically diagnosed MCI, and dementia due to AD patients. AD and MCI patients were recruited from local clinics, cognitively healthy older adults were recruited from the spouses of AD and MCI participants, and both middle-aged and cognitively healthy older participants were recruited from the community through advertising. Diagnosis was determined by consensus conference based on established clinical criteria [16]. Detailed demographic data can be found in Table 1.
Table 1.
Demographic and diagnostic information
| Information | Total sample (n = 312) | Middle aged (n = 172) | Cognitively healthy older (n = 60) | MCI (n = 44) | AD (n = 36) |
|---|---|---|---|---|---|
| Age in years (mean: SD) | 64.85: 10.26 | 57.62: 5.10 | 74.36: 5.24 | 73.68: 8.55 | 72.74: 9.88 |
| Sex (# females, %) | 189, 60.1 | 127, 73.8 | 34, 56.7 | 15, 34.1 | 13, 36.1 |
| Parental dementia history positive (# positive, %) | 207, 66.3 | 135, 78.5 | 28, 46.7 | 25, 56.8 | 19, 52.8 |
| APOE ε4 positive (# positive, %)∗ | 135, 43.3 | 72, 41.9 | 20, 33.3 | 21, 47.7 | 22, 61.1 |
| Years of education (mean: SD) | 15.94: 2.62 | 16.16: 2.32 | 16.42: 2.94 | 15.66: 2.58 | 14.47: 3.02 |
| MMSE (mean: SD) | 27.94: 3.17 | 29.46: 0.77 | 29.00: 1.07 | 26.09: 2.79 | 21.58: 3.71 |
| CDR sum of boxes (mean: SD) | 0.835: 1.668 | 0.023: 0.119 | 0.150: 0.394 | 1.932: 1.371 | 4.514: 1.610 |
| CDR global (mean: SD) | 0.181: 0.318 | 0.012: 0.076 | 0.058: 0.162 | 0.511: 0.170 | 0.792: 0.325 |
| ASCVD 10-y risk score % (mean: SD) | 14.76: 16.81 | 4.58: 4.43 | 26.92: 16.34 | 29.12: 18.72 | 25.90: 19.74 |
| Diabetes (# diagnosed, %) | 30, 9.6 | 13, 7.6 | 7, 11.7 | 8, 18.2 | 2, 5.6 |
| Undergoing medical treatment for hypertension (#, %) | 118, 37.8 | 43, 25.0 | 30, 50.0 | 26, 59.1 | 19, 52.8 |
Abbreviations: SD, standard deviation; MCI, mild cognitive impairment; AD, Alzheimer's disease; APOE, apolipoprotein E; MMSE, mini-mental state examination; CDR, clinical dementia rating; ASCVD, atherosclerotic cardiovascular disease.
Six subjects not genotyped (three cognitively healthy older, two MCI, one AD); positive refers to presence of at least one APOE ε4 allele.
2.2. MR imaging protocol
Subjects were scanned using a clinical 3T MRI system (MR750; GE Healthcare, Waukesha, WI, USA) with an 8-channel head coil (Excite HD Brain Coil; GE Healthcare). Four-dimensional flow MRI data were acquired with PC VIPR [13]. Scan parameters were as follows: venc = 80 cm/s, imaging volume = 22 cm3, acquired isotropic spatial resolution = 0.7 mm3, repetition time (TR)/echo time (TE) = 7.4/2.7 ms, flip angle α = 10°, bandwidth = 83.3 KHz, 14,000 projection angles, scan time ∼ 7 minutes, and retrospective cardiac gating reconstructed into 20 cardiac phases with temporal interpolation [17]. A T1-weighted volume was acquired in the axial plane with a three-dimensional (3D) fast spoiled gradient echo-sequence using the following parameters: inversion time (TI) = 450 ms; TR = 8.1 ms; TE = 3.2 ms; flip angle = 12°; acquisition matrix = 256 × 256; field of view (FOV) = 256 mm; and slice thickness = 1.0 mm. A 3D T2-weighted fluid attenuated inversion recovery sequence was acquired in the sagittal plane using the following parameters: TI = 1868 ms, TR = 6000 ms; TE = 123 ms; flip angle = 90°; acquisition matrix = 256 × 256; FOV = 256 mm; slice thickness = 2.0 mm, and no gap yielding a voxel resolution of 1 mm × 1 mm × 2 mm. MRI images were read by one of the authors for anomalies that required patient notification.
2.3. Flow analysis
Velocity data from the PC VIPR examinations were used for hemodynamic evaluation. Segmentation of the arterial tree was performed in MATLAB (The MathWorks, Natick, MA, USA) from PC angiograms generated from the 4D-flow MRI data, whereas interactive flow visualization and selection of planes for quantitative analysis were conducted in EnSight (CEI, Apex, NC, USA). For this purpose, flow analysis planes were manually placed orthogonal to the vessel orientation in 11 vessel segments: distal cervical internal carotid artery (ICA) (left and right), distal petrous ICA (from hereafter referred to as sICA) (left and right), 5 mm above the basilar artery origin, 5 mm from the MCA (left and right), and the proximal posterior cerebral artery P1 and P2 segments (left and right) (Fig. 1). Two-dimensional cine image series with through-plane velocities were generated from 4D-flow MRI data at the selected planes and analyzed in a customized MATLAB tool [18]. Mean blood flow (mL/min), cross-sectional area, PI [PI = (Qmax−Qmin)/Qmean; Q = flow], and resistive index [RI = (Qmax−Qmin)/Qmax] were calculated for all vessel segments.
Fig. 1.
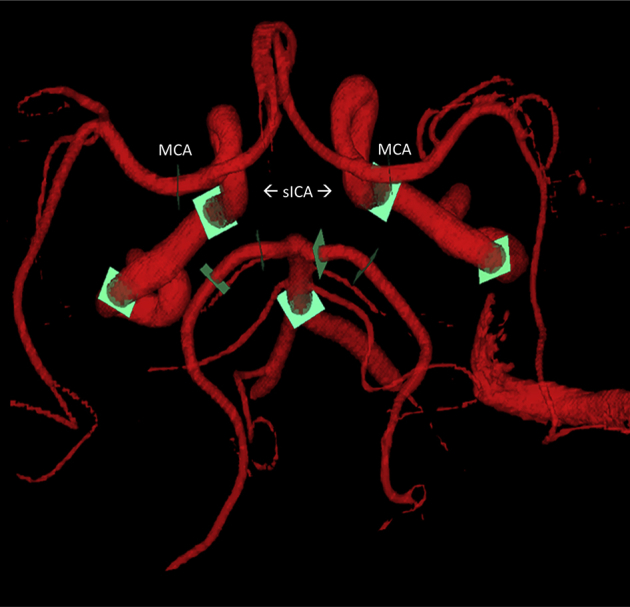
PC VIPR angiogram. Schematic of a PC VIPR angiogram used for quantitative flow and pulsatility analysis. Green orthogonal analysis planes denote where measurements were taken for the 11 vessel segments. MCA and sICA, vessels that were the subject of the present study, are labeled. Abbreviations: PC VIPR, phase contrast vastly undersampled isotropic projection imaging; MCA, middle cerebral artery; sICA, superior portion of the internal carotid artery.
2.4. Volumetric analysis
Gray matter, white matter, and CSF volumes were determined using SPM 12 segmentation procedures (“tissue volumes” utility). This computes the totals of the modulated warped tissue segmentations [19]. Global atrophy was defined as the CSF volume to brain volume ratio and was calculated by dividing the CSF volume (subarachnoid and ventricular CSF compartments) by the sum of the gray and white matter volumes.
2.5. CSF collection
CSF collection was performed in the morning after a minimum 12-hour fast. The procedure was as follows: a Sprotte spinal needle was inserted into the L3-L4 or L4-L5 vertebral interspace and CSF was removed via slow suction. Within 30 minutes of collection, the CSF was centrifuged to remove red blood cells or other debris, aliquoted into 0.5-mL polypropylene tubes and stored at −80°C [20]. Samples were sent in bulk for analysis at the Clinical Neurochemistry Laboratory at the Sahlgrenska Academy of the University of Gothenburg, Sweden. The CSF samples were assayed for total tau (T-tau), phosphorylated tau (P-tau181), and amyloid beta 1–42 (Aβ42) using commercially available enzyme-linked immunosorbent assay methods (INNOTEST assays; Fujirebio, Ghent, Belgium) as described previously [21], [22], [23]. Board-certified laboratory technicians blinded to clinical diagnosis performed all analyses on one occasion. All samples were analyzed according to protocols approved by the Swedish Board of Accreditation and Conformity Assessment using one batch of reagents (intraassay coefficients of variation <10%).
2.6. ASCVD risk score, mean arterial pressure, and pulse pressure calculations
The ASCVD risk score is a formula developed by the American College of Cardiology and the American Heart Association to estimate risk of a cardiovascular event in the next 10 years [24]. It is an updated version of the Framingham risk score (FRS). The variables needed include systolic blood pressure (and whether this value is medically treated or untreated), total and high density lipoprotein (HDL) cholesterol, age, sex, race, diabetes status, and smoking status. These data were acquired at the clinical visit closest to the scan date (mean, 66.2 days; SD, 44.7). Systolic and diastolic pressures were measured using a brachial sphygmomanometer. Mean arterial pressure (MAP), a metric that represents organ perfusion, was calculated according to the following formula: MAP = 1/3 (systolic pressure−diastolic pressure) + diastolic pressure. Pulse pressure (PP) was calculated as the difference between systolic and diastolic pressures.
2.7. Statistical analysis
IBM SPSS version 22 was used for statistical analyses. Linear regressions, with 4D-flow metrics as the predictor variables and age, sex, and diagnostic group as covariates, were performed. To control for the four specific diagnostic categories, dummy codes were included as covariates in the linear regression models [25]. The older adult, MCI, and AD groups were coded relative to the middle-aged cohort, which was hypothesized to have the least vascular pathology, owing to the fact that they have no dementia diagnosis and are the youngest subjects. For atrophy analyses, linear regressions with MCA and sICA mean blood flow and MCA and sICA PIs as the independent variables were performed. Degrees of freedom for all linear regression analyses were included to account for the fact that not all participants have all PC VIPR measurements, some of which were unmeasurable due to variant anatomy. For CSF analyses, dependent variables were CSF Aβ42, T-tau, and P-tau181, and independent variables were MCA and sICA mean blood flow and PIs. To compare vascular health between older controls and participants diagnosed with MCI and AD, analysis of covariance models with age and gender covariates were used, with MAP, PP, or ASCVD risk score as the dependent variables. For MAP and PP, a covariate of antihypertensive treatment (yes/no) was added because unlike ASCVD, these metrics do not take into account treated blood pressure status.
3. Results
Detailed demographic and descriptive breakdown by diagnostic cohort (172 middle aged, 60 cognitively healthy older, 44 MCI, and 36 AD) can be found in Table 1.
3.1. ASCVD risk score, MAP, and PP analyses
The percentage risk of having a cardiovascular event in the next 10 years was on average 4.58% (SD, 4.43), 26.92% (SD, 16.34), 29.12% (SD, 18.72), and 25.90% (SD, 19.74) for the middle aged, cognitively healthy older, MCI, and AD groups, respectively. Notably, for the three older groups, this is approximately a 10% greater score on average than expected for adults with ideal cardiovascular health [24]. MAP, PP, and ASCVD risk score did not differ among the three older groups (cognitively healthy older adults, MCI, and AD) (Fig. 2A–C). Given the skewness of the ASCVD risk scores and high SDs, the risk scores were log transformed to achieve normality in a post hoc analysis; similarly to that calculated with the raw scores, no statistical difference was found between the three older cohorts.
Fig. 2.

Between-group analyses of ASCVD risk score, MAP, and pulse pressure. Graphical results of the between-diagnostic group ANCOVA analyses examining (A) ASCVD risk score, (B) pulse pressure and (C), mean arterial pressure. There is no significant difference for any of these metrics in the three older age groups (cognitively healthy older adults, MCI, and AD) when age and gender are included as covariates. Graphical representations (means) are without adjustment for covariates to ease in readability of percentage risk and blood pressure axes. Abbreviations: ASCVD, atherosclerotic cardiovascular disease; MAP, mean arterial pressure; MCI, mild cognitive impairment; ANCOVA, analysis of covariance; AD, Alzheimer's disease; CI, confidence interval.
3.2. Atrophy analyses
After accounting for diagnosis, lower mean blood flow and higher PI each predicted a greater degree of brain atrophy across all participants. This was true for both the MCA (flow and pulsatility) as well as for flow in the sICA. For the average blood flow of the MCA left and right vessels, a bilateral metric, the β coefficient was −0.132 (t[DF248] = −3.206, P = .002) and for the sICA, the β was −0.123 (t[DF264] = −3.276, P = .001) (Fig. 3A and B). The opposite relationship was seen for PI, with greater PI predicting greater loss of brain volume. For the PI of the MCA (average of left and right MCA PI), the β coefficient was 0.142 (t[DF120] = 2.184, P = .031) (Fig. 4). PI in the sICA did not significantly predict atrophy.
Fig. 3.

Lower mean blood flow is associated with a greater degree of atrophy. Scatter plot of the results of the linear regression examining the relationship between mean flow and atrophy, controlling for age, gender, and diagnostic group. Atrophy is calculated as the ratio of CSF to gray matter + white matter. Mean flow, in both the (A) superior portion of the internal carotid artery (ICA) and the (B) middle cerebral artery (MCA), negatively predict atrophy, where subjects with lower mean flow had greater degrees of atrophy. Abbreviations: MCI, mild cognitive impairment; AD, Alzheimer's disease.
Fig. 4.

Higher pulsatility index is associated with a greater degree of atrophy. Scatter plot of the results of the linear regression examining the relationship between pulsatility and atrophy, controlling for age, gender, and diagnostic group. Atrophy is calculated as the ratio of CSF to gray matter + white matter. Pulsatility in the middle cerebral artery (MCA) positively predicted atrophy, where subjects with higher pulsatility (stiffer vessels) had greater degrees of atrophy. Abbreviations: MCI, mild cognitive impairment; AD, Alzheimer's disease.
3.3. CSF biomarker analyses
A linear regression controlling for age, sex, and diagnosis found a significant positive relationship between flow in the sICA and Aβ42 in the CSF. For the average flow of the left and right vessels, the β coefficient was 0.177 (t[DF141] = 2.191, P = .030), indicating that individuals with lower blood flow have lower amounts of Aβ42 in the CSF, and by inference, greater amyloid deposition in the brain (Fig. 5A). On examination of the association between mean blood flow in the MCA and Aβ42 levels in CSF, there was a trend approaching significance; the β coefficient was 0.161 (t[DF137] = 1.867, P = .064) (Fig. 5B). Pulsatility did not predict CSF Aβ42, and neither flow nor pulsatility was significantly related to CSF markers of tau pathology.
Fig. 5.

Lower mean blood flow is associated with lower levels of CSF Aβ42. Scatter plot of the results of the linear regression examining the relationship between mean blood flow and CSF Aβ42, controlling for age, gender, and diagnostic group. Lower mean flow of the (A) superior portion of the internal carotid artery (ICA) is associated with lower levels of Aβ42 in the CSF, suggesting possible reduced amyloid clearance/increased deposition in the brain. (B) Flow in the middle cerebral artery (MCA) shows a trending relationship. Abbreviations: MCI, mild cognitive impairment; AD, Alzheimer's disease; CSF, cerebrospinal fluid; Aβ42, amyloid beta 1–42.
4. Discussion
The results of this study converge with prior studies suggesting that vascular measures are associated with AD pathology. Intracranial blood flow was associated with both atrophy and CSF markers of amyloid. Accurate characterization of vascular pathology in vivo is important, given that approximately 50% of individuals with clinically diagnosed AD have mixed pathology at the time of autopsy, the most common of which is both amyloid and infarct [2]. The interrelationship between AD pathology and vascular health is further underscored by the fact that individuals who have significant amyloid positivity on positron emission tomography imaging have greater vascular bed pulse wave velocity [10], [11]. The present study uniquely examines the health of the intracranial arteries of the circle of Willis and demonstrates that reduced blood flow and increased PI of these arteries are associated with various features of the AD pathologic profile.
4.1. ASCVD risk score, MAP, and PP
As the ASCVD risk score has been recently implemented, there is a paucity of literature regarding its relationship to AD. The earlier FRS has been extensively examined; a study of 1755 offspring of the Framingham cohort was studied both in 1991–1995 and again in 2005–2008. At the initial visit, the FRS was calculated, and at the follow-up visit, memory tests administered. The researchers found that individuals with a higher cardiovascular risk score at midlife were more likely to experience memory decline [26]. Additionally, a study of 1202 patients from the Alzheimer's Disease Neuroimaging Initiative (ADNI) cohort found that patients with AD biomarker positivity and high stroke risk (as identified by the FRS) had the lowest cognitive performance [27]. In contrast, a study of 82 elderly patients with mild-to-moderate cognitive deficits (mean age, 79.0 ± 5.9 years; 67.1% females) did not find that present FRS was predictive of further decline [28].
There are components of the vascular risk score that relate specifically to peripheral vessel health. In particular, higher PP, or a greater difference between systolic and diastolic pressures, is believed to be due to increased arterial stiffness. A study of 877 participants (aged 55–91 years) from the ADNI cohort sought to examine the relationship between PP and AD CSF biomarkers. Patients with a positive biomarker profile were found to have greater PP than individuals who were P-tau181 negative. Subjects in their very-old age group (80–91 years) with a higher PP or MAP at baseline progressed more rapidly to dementia [29].
Our study suggests that intracranial 4D-flow metrics of vascular health may be more direct predictors of AD pathology than the ASCVD risk score, PP, and MAP. This is evidenced by the fact that although there is significant difference between the three older diagnostic groups on intracranial 4D-flow metrics, they do not differ on MAP, PP, or ASCVD score. This suggests that intracranial blood flow and PI in the cerebral arteries may measure intracranial vascular health in a more specific manner than the overall ASCVD risk score or peripheral pressure metrics, and thus may have greater utility in the prediction of AD pathology.
4.2. Atrophy
Considerable research suggests a significant contribution of vascular pathology to cognitive decline, with a potentially synergistic effect on cognition when combined with pathognomonic AD pathology. In a neuropathologic study where ratings of atrophy and large vessel disease were performed by pathologists blind to study objectives, more severe large-vessel vascular disease was associated with a greater degree of cortical atrophy [30]. The SMArt-MR (second manifestations of arterial disease) study sought to investigate the vascular contributions to cognitive decline in patients with symptomatic atherosclerotic disease. Researchers found that patients with atrophy and high white matter hyperintensity lesion volume had increased cognitive decline compared with subjects with a lesser amount of vascular pathology [31]. Furthermore, an interaction was observed with brain volume and the presence of infarcts, where subjects with brain volume reduction and infarct pathology displayed perturbed executive functioning, although this relationship was not seen in subjects with reduced brain volume but without infarcts [32].
The additive nature of vascular/infarct and amyloid pathology in increasing the odds of dementia and the incidence of cognitive decline has been shown in myriad studies, as discussed in the American Heart Association/American Stroke Association scientific statement to health care professionals [4]. Our study suggests that increased loss of brain volume due to impaired blood flow dynamics may be a biological mechanism for this additive hypothesis paradigm. The positive correlation between 4D-flow MRI metrics of poor vascular health (lower mean blood flow and increased PI) and atrophy observed in our study suggests that intracranial cerebral artery health is an important contributor to atrophy, and explains something beyond age-related volume loss or volume loss expected when disease state is controlled for in regression analyses.
4.3. CSF biomarkers
Amyloid plaque deposition in the brain parenchyma is a hallmark of AD, and recent research has suggested an association of intracranial vascular health with this pathologic marker. In a metabolic labeling study of 12 control and 12 AD subjects, production of Aβ40 and Aβ42 was not different between groups, but clearance rates were significantly reduced in AD patients [33]. Most soluble β-amyloid is believed to be removed via paravascular clearance, suggesting a role for disturbed blood flow in the pathogenesis of plaques [34]. Furthermore, β-amyloid tends to cluster around large diameter arterial vessels as opposed to smaller capillaries, suggesting that arterial health, such as that measured by 4D-flow MRI, is important to investigate [35]. Probing this relationship directly, a study of transgenic mice expressing human β-amyloid protein found that manipulation of cerebral blood flow by aortic constriction resulted in greater cerebral amyloid angiopathy and amyloid plaques [36]. This mechanism may support the association between greater MCA and sICA flow and Aβ42 levels in the CSF demonstrated in our study and requires more investigation.
4.4. Limitations and future directions
One potential limitation is that analyses were conducted across diagnostic groups; this design was chosen to examine the full continuum of pathology across participants and because sample sizes of the AD and MCI groups were not large enough to have sufficient statistical power for within-group analyses. Additionally, the ASCVD risk equation is validated for patients aged between 40 and 79 years, and 30 subjects in this study were aged ≥80 years. The risk equation includes a parameter for hypertensive medication, but does not account for type or dose. As this study design was cross-sectional, determinants of causality cannot be made; plans are underway, however, for participants to return for longitudinal follow-up imaging, which will allow greater ability to define the interrelationship between AD and vascular pathologies. The middle-aged group in particular will be a focus of future studies because they are enriched for AD risk factors, to determine how vascular health at midlife contributes to subsequent cognitive decline. Additional planned analyses include a systematic examination of T2* scans for cerebral microhemorrhages, as these may partially account for the increased pulsatility seen in AD patients [37].
5. Conclusions
PC VIPR is a novel 4D-flow MRI method that can be used to evaluate intracranial mean flow and pulsatility associated with AD in both preclinical and disease stages. These data show that 4D-flow metrics indicative of reduced intracranial arterial health are associated with increased cerebral atrophy and reduced CSF levels of Aβ42. Interestingly, blood flow and PI measurements seem to capture additional information beyond that acquired using a gold-standard vascular risk score. This suggests that the intracranial arterial health component of overall vascular health merits further study to further clarify its unique role in AD pathogenesis.
Research in context.
-
1.
Systematic review: The authors surveyed the literature using standard online sources, data presented at conferences, and discussions with collaborators. The contribution of vascular risk factors to the etiopathogenesis of Alzheimer's disease is not completely understood; however, there are a number of publications addressing this issue that are cited herein.
-
2.
Interpretation: These findings support a theory by which intracranial arterial health (mean blood flow and pulsatility index) is related to various pathologic changes (cerebral atrophy, cerebrospinal fluid amyloid beta 1–42) associated with Alzheimer's disease.
-
3.
Future directions: The analyses in the present article are cross-sectional and generate important additional questions. Longitudinal analysis of intracranial arterial health parameters will be performed to determine how these relate to the incidence and speed of cognitive decline and the accumulation of Alzheimer's-related pathology.
Acknowledgments
The project described was supported by the Wisconsin Alzheimer's Disease Research Center P50-AG033514, the Medical Scientist Training Program (MSTP) training grant T32GM008692 (SB), the Rath Distinguished Graduate Research Fellowship (SB), the Training, Education, and Mentoring in Science (TEAM) Fellowship grant R25GM083252 (LRR), and the Clinical and Translational Science Award (CTSA) program, through the NIH National Center for Advancing Translational Sciences, grant UL1TR000427. The content is solely the responsibility of the authors and does not necessarily represent the official views of the NIH. The authors extend their deepest gratitude to all individuals who participated in the study.
References
- 1.Schneider J.A., Bennett D.A. Where vascular meets neurodegenerative disease. Stroke. 2010;41:S144–S146. doi: 10.1161/STROKEAHA.110.598326. [DOI] [PMC free article] [PubMed] [Google Scholar]
- 2.Schneider J.A., Arvanitakis Z., Leurgans S.E., Bennett D.A. The neuropathology of probable Alzheimer disease and mild cognitive impairment. Ann Neurol. 2009;66:200–208. doi: 10.1002/ana.21706. [DOI] [PMC free article] [PubMed] [Google Scholar]
- 3.Hughes T.M., Craft S., Lopez O.L. Review of “the potential role of arterial stiffness in the pathogenesis of Alzheimer's disease”. Neurodegener Dis Manag. 2015;5:121–135. doi: 10.2217/nmt.14.53. [DOI] [PMC free article] [PubMed] [Google Scholar]
- 4.Gorelick P.B., Scuteri A., Black S.E., Decarli C., Greenberg S.M., Iadecola C. Vascular contributions to cognitive impairment and dementia: A statement for healthcare professionals from the American Heart Association/American Stroke Association. Stroke. 2011;42:2672–2713. doi: 10.1161/STR.0b013e3182299496. [DOI] [PMC free article] [PubMed] [Google Scholar]
- 5.Skoog I., Lernfelt B., Landahl S., Palmertz B., Andreasson L.A., Nilsson L. 15-year longitudinal study of blood pressure and dementia. Lancet. 1996;347:1141–1145. doi: 10.1016/s0140-6736(96)90608-x. [DOI] [PubMed] [Google Scholar]
- 6.Roher A.E., Tyas S.L., Maarouf C.L., Daugs I.D., Kokjohn T.A., Emmerling M.R. Intracranial atherosclerosis as a contributing factor to Alzheimer's disease dementia. Alzheimers Dement. 2011;7:436–444. doi: 10.1016/j.jalz.2010.08.228. [DOI] [PMC free article] [PubMed] [Google Scholar]
- 7.Roher A.E., Debbins J.P., Malek-Ahmadi M., Chen K., Pipe J.G., Maze S. Cerebral blood flow in Alzheimer's disease. Vasc Health Risk Manag. 2012;8:599–611. doi: 10.2147/VHRM.S34874. [DOI] [PMC free article] [PubMed] [Google Scholar]
- 8.Claassen J.A., Diaz-Arrastia R., Martin-Cook K., Levine B.D., Zhang R. Altered cerebral hemodynamics in early Alzheimer disease: A pilot study using transcranial Doppler. J Alzheimers Dis. 2009;17:621–629. doi: 10.3233/JAD-2009-1079. [DOI] [PMC free article] [PubMed] [Google Scholar]
- 9.Roher A.E., Garami Z., Tyas S.L., Maarouf C.L., Kokjohn T.A., Belohlavek M. Transcranial Doppler ultrasound blood flow velocity and pulsatility index as systemic indicators for Alzheimer's disease. Alzheimers Dement. 2011;7:445–455. doi: 10.1016/j.jalz.2010.09.002. [DOI] [PMC free article] [PubMed] [Google Scholar]
- 10.Hughes T.M., Kuller L.H., Barinas-Mitchell E.J., Mackey R.H., McDade E.M., Klunk W.E. Pulse wave velocity is associated with beta-amyloid deposition in the brains of very elderly adults. Neurology. 2013;81:1711–1718. doi: 10.1212/01.wnl.0000435301.64776.37. [DOI] [PMC free article] [PubMed] [Google Scholar]
- 11.Hughes T.M., Kuller L.H., Barinas-Mitchell E.J., McDade E.M., Klunk W.E., Cohen A.D. Arterial stiffness and beta-amyloid progression in nondemented elderly adults. JAMA Neurol. 2014;71:562–568. doi: 10.1001/jamaneurol.2014.186. [DOI] [PMC free article] [PubMed] [Google Scholar]
- 12.Markl M., Frydrychowicz A., Kozerke S., Hope M., Wieben O. 4D flow MRI. J Magn Reson Imaging. 2012;36:1015–1036. doi: 10.1002/jmri.23632. [DOI] [PubMed] [Google Scholar]
- 13.Gu T., Korosec F.R., Block W.F., Fain S.B., Turk Q., Lum D. PC VIPR: A high-speed 3D phase-contrast method for flow quantification and high-resolution angiography. AJNR Am J Neuroradiol. 2005;26:743–749. [PMC free article] [PubMed] [Google Scholar]
- 14.Johnson K.M., Lum D.P., Turski P.A., Block W.F., Mistretta C.A., Wieben O. Improved 3D phase contrast MRI with off-resonance corrected dual echo VIPR. Magn Reson Med. 2008;60:1329–1336. doi: 10.1002/mrm.21763. [DOI] [PMC free article] [PubMed] [Google Scholar]
- 15.Rivera-Rivera L, Patrick T, Schrauben E, Kilgas P, Hoffman C, Johnson KM, et al. 4D flow MRI for intracranial hemodynamic assessment in Alzheimer's disease. ISMRM 23rd Scientific Meeting and Exhibition, Toronto, Canada. 2015; 4312.
- 16.McKhann G.M., Knopman D.S., Chertkow H., Hyman B.T., Jack C.R., Jr., Kawas C.H. The diagnosis of dementia due to Alzheimer's disease: Recommendations from the National Institute on Aging-Alzheimer's Association workgroups on diagnostic guidelines for Alzheimer's disease. Alzheimers Dement. 2011;7:263–269. doi: 10.1016/j.jalz.2011.03.005. [DOI] [PMC free article] [PubMed] [Google Scholar]
- 17.Liu J., Redmond M.J., Brodsky E.K., Alexander A.L., Lu A., Thornton F.J. Generation and visualization of four-dimensional MR angiography data using an undersampled 3-D projection trajectory. IEEE Trans Med Imaging. 2006;25:148–157. doi: 10.1109/TMI.2005.861706. [DOI] [PubMed] [Google Scholar]
- 18.Stalder A.F., Russe M.F., Frydrychowicz A., Bock J., Hennig J., Markl M. Quantitative 2D and 3D phase contrast MRI: Optimized analysis of blood flow and vessel wall parameters. Magn Reson Med. 2008;60:1218–1231. doi: 10.1002/mrm.21778. [DOI] [PubMed] [Google Scholar]
- 19.Malone I.B., Leung K.K., Clegg S., Barnes J., Whitwell J.L., Ashburner J. Accurate automatic estimation of total intracranial volume: a nuisance variable with less nuisance. Neuroimage. 2015;104:366–372. doi: 10.1016/j.neuroimage.2014.09.034. [DOI] [PMC free article] [PubMed] [Google Scholar]
- 20.Mielke M.M., Haughey N.J., Bandaru V.V., Zetterberg H., Blennow K., Andreasson U. Cerebrospinal fluid sphingolipids, beta-amyloid, and tau in adults at risk for Alzheimer's disease. Neurobiol Aging. 2014;35:2486–2494. doi: 10.1016/j.neurobiolaging.2014.05.019. [DOI] [PMC free article] [PubMed] [Google Scholar]
- 21.Blennow K., Wallin A., Agren H., Spenger C., Siegfried J., Vanmechelen E. Tau protein in cerebrospinal fluid: A biochemical marker for axonal degeneration in Alzheimer disease? Mol Chem Neuropathol. 1995;26:231–245. doi: 10.1007/BF02815140. [DOI] [PubMed] [Google Scholar]
- 22.Vanmechelen E., Vanderstichele H., Davidsson P., Van Kerschaver E., Van Der Perre B., Sjogren M. Quantification of tau phosphorylated at threonine 181 in human cerebrospinal fluid: A sandwich ELISA with a synthetic phosphopeptide for standardization. Neurosci Lett. 2000;285:49–52. doi: 10.1016/s0304-3940(00)01036-3. [DOI] [PubMed] [Google Scholar]
- 23.Andreasen N., Hesse C., Davidsson P., Minthon L., Wallin A., Winblad B. Cerebrospinal fluid beta-amyloid(1-42) in Alzheimer disease: Differences between early- and late-onset Alzheimer disease and stability during the course of disease. Arch Neurol. 1999;56:673–680. doi: 10.1001/archneur.56.6.673. [DOI] [PubMed] [Google Scholar]
- 24.Goff D.C., Jr., Lloyd-Jones D.M., Bennett G., Coady S., D'Agostino R.B., Sr., Gibbons R. 2013 ACC/AHA guideline on the assessment of cardiovascular risk: A report of the American College of Cardiology/American Heart Association Task Force on Practice Guidelines. J Am Coll Cardiol. 2014;63:2935–2959. doi: 10.1016/j.jacc.2013.11.005. [DOI] [PMC free article] [PubMed] [Google Scholar]
- 25.West S.G., Aiken L.S., Cham H., Liu Y. Multiple regression: The basics and beyond for clinical scientists. In: Comer J.S., Kendall P.C., editors. The Oxford handbook of research strategies for clinical psychology. Oxford University Press; New York: 2013. 272–252. [Google Scholar]
- 26.Gupta A., Preis S.R., Beiser A., Devine S., Hankee L., Seshadri S. Mid-life cardiovascular risk impacts memory function: The Framingham Offspring Study. Alzheimer Dis Assoc Disord. 2015;29:117–123. doi: 10.1097/WAD.0000000000000059. [DOI] [PMC free article] [PubMed] [Google Scholar]
- 27.Hohman T.J., Samuels L.R., Liu D., Gifford K.A., Mukherjee S., Benson E.M. Stroke risk interacts with Alzheimer's disease biomarkers on brain aging outcomes. Neurobiol Aging. 2015;36:2501–2508. doi: 10.1016/j.neurobiolaging.2015.05.021. [DOI] [PMC free article] [PubMed] [Google Scholar]
- 28.Curiati P.K., Magaldi R.M., Suemoto C.K., Bottino C.M., Nitrini R., Farfel J.M. Vascular risk as a predictor of cognitive decline in a cohort of elderly patients with mild to moderate dementia. Dement Geriatr Cogn Dis Extra. 2014;4:402–409. doi: 10.1159/000368190. [DOI] [PMC free article] [PubMed] [Google Scholar]
- 29.Nation D.A., Edmonds E.C., Bangen K.J., Delano-Wood L., Scanlon B.K., Han S.D. Pulse pressure in relation to tau-mediated neurodegeneration, cerebral amyloidosis, and progression to dementia in very old adults. JAMA Neurol. 2015;72:546–553. doi: 10.1001/jamaneurol.2014.4477. [DOI] [PMC free article] [PubMed] [Google Scholar]
- 30.Crystal H.A., Schneider J.A., Bennett D.A., Leurgans S., Levine S.R. Associations of cerebrovascular and Alzheimer's disease pathology with brain atrophy. Curr Alzheimer Res. 2014;11:309–316. doi: 10.2174/1567205011666140302194358. [DOI] [PMC free article] [PubMed] [Google Scholar]
- 31.Kooistra M., Geerlings M.I., van der Graaf Y., Mali W.P., Vincken K.L., Kappelle L.J. Vascular brain lesions, brain atrophy, and cognitive decline. The Second Manifestations of ARTerial disease–Magnetic Resonance (SMART-MR) study. Neurobiol Aging. 2014;35:35–41. doi: 10.1016/j.neurobiolaging.2013.07.004. [DOI] [PubMed] [Google Scholar]
- 32.Muller M., Appelman A.P., van der Graaf Y., Vincken K.L., Mali W.P., Geerlings M.I. Brain atrophy and cognition: Interaction with cerebrovascular pathology? Neurobiol Aging. 2011;32:885–893. doi: 10.1016/j.neurobiolaging.2009.05.005. [DOI] [PubMed] [Google Scholar]
- 33.Mawuenyega K.G., Sigurdson W., Ovod V., Munsell L., Kasten T., Morris J.C. Decreased clearance of CNS beta-amyloid in Alzheimer's disease. Science. 2010;330:1774. doi: 10.1126/science.1197623. [DOI] [PMC free article] [PubMed] [Google Scholar]
- 34.Iliff J.J., Wang M., Liao Y., Plogg B.A., Peng W., Gundersen G.A. A paravascular pathway facilitates CSF flow through the brain parenchyma and the clearance of interstitial solutes, including amyloid beta. Sci Transl Med. 2012;4:147ra11. doi: 10.1126/scitranslmed.3003748. [DOI] [PMC free article] [PubMed] [Google Scholar]
- 35.Armstrong R.A. Classic beta-amyloid deposits cluster around large diameter blood vessels rather than capillaries in sporadic Alzheimer's disease. Curr Neurovasc Res. 2006;3:289–294. doi: 10.2174/156720206778792948. [DOI] [PubMed] [Google Scholar]
- 36.Li H., Guo Q., Inoue T., Polito V.A., Tabuchi K., Hammer R.E. Vascular and parenchymal amyloid pathology in an Alzheimer disease knock-in mouse model: Interplay with cerebral blood flow. Mol Neurodegener. 2014;9:28. doi: 10.1186/1750-1326-9-28. [DOI] [PMC free article] [PubMed] [Google Scholar]
- 37.Smith E.E., Vijayappa M., Lima F., Delgado P., Wendell L., Rosand J. Impaired visual evoked flow velocity response in cerebral amyloid angiopathy. Neurology. 2008;71:1424–1430. doi: 10.1212/01.wnl.0000327887.64299.a4. [DOI] [PMC free article] [PubMed] [Google Scholar]